

Key Insights
The global display driver market is poised for significant expansion, projected to reach $9467.18 million by 2025, with a compound annual growth rate (CAGR) of 6.6%. This growth is propelled by the escalating demand for high-resolution displays across a wide spectrum of applications. Key growth drivers include the widespread adoption of smartphones, tablets, and laptops featuring advanced display technologies such as OLED. The automotive sector's increasing integration of larger, higher-resolution infotainment systems and instrument clusters is also a substantial contributor. Furthermore, the emergence of foldable and flexible displays necessitates sophisticated display driver integrated circuits (DDICs) for intricate display configurations. While manufacturing complexities and material dependencies may present some challenges, the overall market outlook remains robust. In terms of segmentation, large DDICs dominate the form factor segment, underscoring the prevalence of larger displays in current applications. Leading players, including Novatek Microelectronics, Synaptics, and Himax, are actively engaged in innovation and product diversification within the LCD and OLED display driver segments, fostering intense competition and stimulating market growth, particularly in manufacturing hubs like China and Taiwan. Continued integration of advanced display technologies in consumer and industrial products will be a critical factor for market expansion throughout the forecast period.
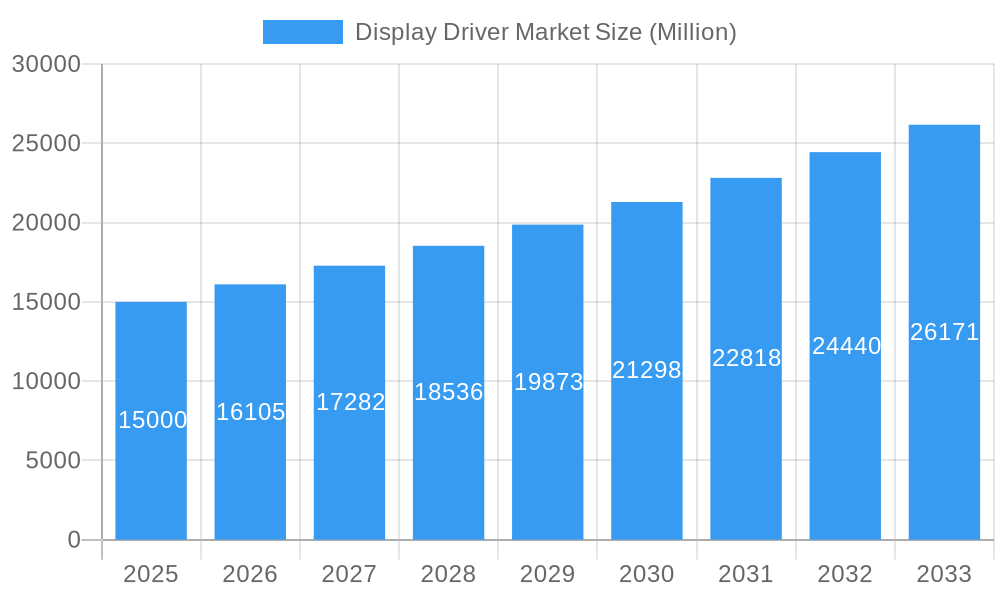
Display Driver Market Market Size (In Billion)
Key market trends include the increasing adoption of advanced display technologies like AMOLED and MicroLED, driving demand for more sophisticated DDICs. Mini-LED backlighting in high-end televisions and laptops further contributes to this trend. Additionally, the growing emphasis on energy-efficient displays is spurring the development of low-power DDICs. A significant emerging trend is the incorporation of artificial intelligence (AI) and machine learning (ML) into display driver ICs to enhance image quality and optimize power management. Geographic expansion, especially in developing economies with burgeoning consumer electronics markets, is expected to further accelerate market growth. Competitive dynamics are intensifying as companies prioritize product innovation, strategic partnerships, and mergers and acquisitions. The forecast period (2025-2033) anticipates consistent growth driven by the anticipated adoption of new display technologies and expanding application demand.
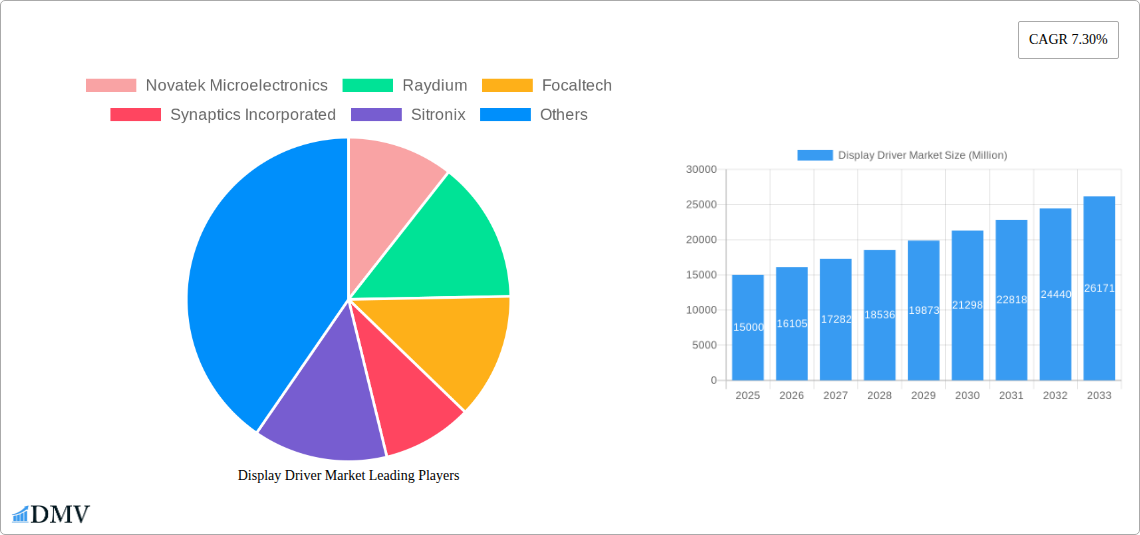
Display Driver Market Company Market Share
Display Driver Market: A Comprehensive Report (2019-2033)
This insightful report provides a detailed analysis of the Display Driver Market, projecting significant growth from 2025 to 2033. We delve into market dynamics, technological advancements, competitive landscapes, and future opportunities, offering crucial insights for stakeholders across the display driver ecosystem. With a focus on key segments including Large DDIC, Small and Medium DDIC, LCD and OLED applications, this report utilizes data from the historical period (2019-2024), base year (2025), and estimated year (2025) to provide a robust forecast (2025-2033). The total market value is expected to reach xx Million by 2033.
Display Driver Market Composition & Trends
This section examines the competitive landscape, innovation drivers, regulatory frameworks, substitute products, end-user trends, and merger and acquisition (M&A) activities within the display driver market. We analyze market share distribution among key players such as Novatek Microelectronics, Raydium, Focaltech, Synaptics Incorporated, Sitronix, Himax, Samsung Electronics Co Ltd, Magnachip Semiconductor, Fitipower Integrated Technology Inc, LX Semicon, MediaTek and others. The report quantifies market concentration using metrics like the Herfindahl-Hirschman Index (HHI) and assesses the impact of recent M&A activities, including deal values and their influence on market dynamics. Innovation catalysts, such as advancements in display technologies (OLED, mini-LED, MicroLED) and their effects on demand for advanced display drivers, are thoroughly explored. The regulatory environment, including government initiatives impacting the semiconductor industry, are also analyzed. Finally, we examine substitute products and their potential to disrupt market share.
- Market Concentration: The market exhibits a [High/Medium/Low] level of concentration, with the top 5 players accounting for approximately xx% of the market share in 2024.
- M&A Activity: In the past five years, the market has witnessed [Number] significant M&A deals totaling approximately xx Million. These transactions have primarily focused on [mention acquisition targets - e.g., expanding product portfolios, accessing new technologies].
- Innovation Catalysts: Advancements in display technologies like OLED and mini-LED are driving demand for high-performance display drivers capable of supporting higher resolutions and faster refresh rates.
- Regulatory Landscape: [Describe specific regulations and their impact - e.g., government subsidies for semiconductor manufacturing].
- Substitute Products: [Discuss alternative technologies and their market penetration, e.g., new types of display drivers].
Display Driver Market Industry Evolution
This section delves into the historical and projected growth trajectory of the display driver market, analyzing technological advancements and shifting consumer preferences. We examine growth rates across different segments and applications (LCD, OLED). The increasing adoption of smartphones, smartwatches, and automotive displays significantly influences market growth. The integration of new technologies, such as artificial intelligence (AI) and machine learning (ML) in display drivers, is analyzed with data points illustrating its adoption rate. Technological innovations such as higher resolution, HDR, and low-power consumption features are highlighted and linked to market growth rates.
Leading Regions, Countries, or Segments in Display Driver Market
This section identifies the dominant regions, countries, and segments within the display driver market—analyzing factors contributing to their leadership. We focus on OLED, Large DDIC, Small and Medium DDIC, and LCD segments and the geographical regions where these display driver applications are most prevalent. We analyze investment trends, government support, manufacturing infrastructure, and consumer demand as key driving forces behind market dominance.
- Dominant Region: [e.g., Asia-Pacific] accounts for the largest market share due to [Reasons: e.g., high concentration of display manufacturing, strong consumer demand for consumer electronics].
- Key Drivers (Asia-Pacific):
- High consumer electronics production and consumption.
- Strong government support for the semiconductor industry.
- Significant investments in display technology research and development.
- Dominant Segment: The [e.g., Large DDIC] segment holds the largest market share due to [Reasons: e.g., increasing demand for larger displays in laptops and monitors].
- Dominant Application: The [e.g., LCD] application dominates the market due to [Reasons: e.g., cost-effectiveness and wide availability].
Display Driver Market Product Innovations
Recent innovations in display drivers focus on improving energy efficiency, enhancing image quality, and reducing manufacturing costs. Key advancements include the integration of advanced power management techniques, higher-resolution support, and improved color accuracy. Unique selling propositions such as lower latency and support for advanced display features (e.g., HDR, high refresh rates) are driving adoption. The integration of AI and ML for enhanced display performance is a key future development.
Propelling Factors for Display Driver Market Growth
Several factors propel the growth of the display driver market. The increasing demand for high-resolution displays in consumer electronics, coupled with the expansion of the automotive and industrial display sectors, fuels market growth. Technological advancements, like mini-LED and MicroLED backlighting, require advanced display drivers, creating further opportunities. Government incentives for the semiconductor industry and rising investments in display technology research and development also contribute significantly.
Obstacles in the Display Driver Market
Despite positive growth prospects, the display driver market faces challenges such as increasing component costs, supply chain disruptions, and fierce competition from established players. Geopolitical uncertainties and trade regulations can also create instability. The impact of these constraints on market growth and pricing is analyzed in detail.
Future Opportunities in Display Driver Market
Future opportunities lie in emerging applications such as augmented reality (AR) and virtual reality (VR) headsets, as well as in the growing automotive display market. The development of more energy-efficient display drivers and the integration of advanced features will be crucial for future market expansion. New display technologies like MicroLED will generate demand for specialized display drivers.
Major Players in the Display Driver Market Ecosystem
- Novatek Microelectronics
- Raydium
- Focaltech
- Synaptics Incorporated
- Sitronix
- Himax
- Samsung Electronics Co Ltd
- Magnachip Semiconductor
- Fitipower Integrated Technology Inc
- LX Semicon
- MediaTek
Key Developments in Display Driver Market Industry
- August 2022: LX Semicon established a research team to develop automotive display driver ICs for central information displays, clusters, head-up displays, and other in-vehicle displays. This signifies a significant expansion of the automotive display driver market.
- May 2022: Tesla's upgrade to the Model S and Model X, including a motorized swivel function for the center screen and a new backseat gaming display, underscores the rising demand for advanced in-car entertainment systems and high-quality displays. This development highlights the market's increasing sophistication and potential.
Strategic Display Driver Market Forecast
The display driver market is poised for continued growth, driven by technological advancements and expanding applications across various sectors. The increasing demand for high-resolution, energy-efficient displays will fuel market expansion. Technological innovations, coupled with government initiatives and strategic investments, suggest a robust and positive outlook for the forecast period.
Display Driver Market Segmentation
-
1. Form Factor
- 1.1. Large DDIC
- 1.2. Small and Medium DDIC
-
2. Application
-
2.1. LCD
- 2.1.1. Desktop Monitor
- 2.1.2. Notebook PC
- 2.1.3. LCD TV
- 2.1.4. Tablet
- 2.1.5. LCD Smartphone
- 2.1.6. Others
-
2.2. OLED
- 2.2.1. OLED TV
- 2.2.2. OLED Smartphone
-
2.1. LCD
-
3. Geography
- 3.1. China
- 3.2. Taiwan
- 3.3. Korea
- 3.4. Americas
- 3.5. Others
Display Driver Market Segmentation By Geography
- 1. China
- 2. Taiwan
- 3. Korea
- 4. Americas
- 5. Others
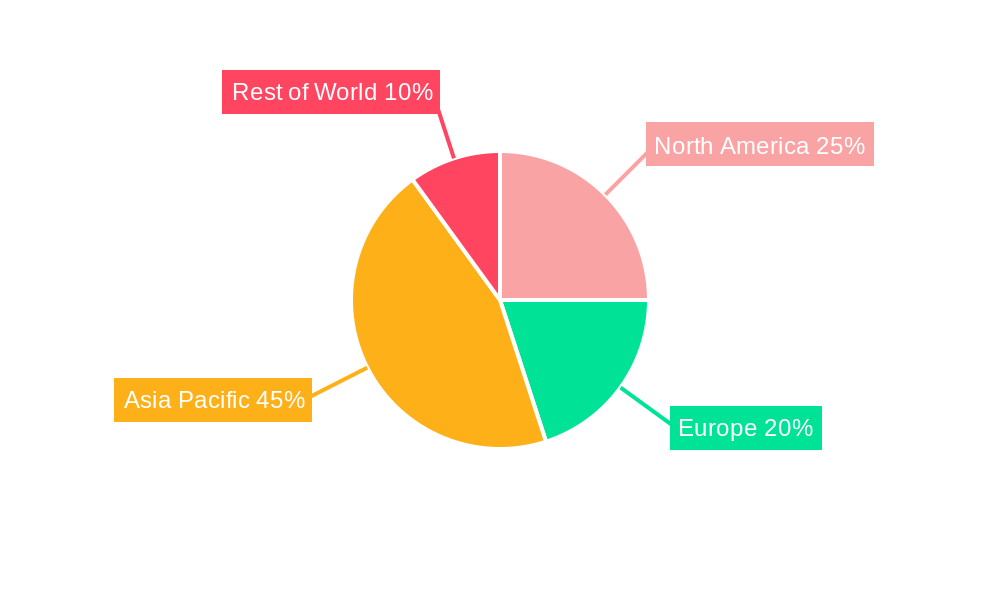
Display Driver Market Regional Market Share
Geographic Coverage of Display Driver Market
Display Driver Market REPORT HIGHLIGHTS
| Aspects | Details |
|---|---|
| Study Period | 2020-2034 |
| Base Year | 2025 |
| Estimated Year | 2026 |
| Forecast Period | 2026-2034 |
| Historical Period | 2020-2025 |
| Growth Rate | CAGR of 6.6% from 2020-2034 |
| Segmentation |
|
Table of Contents
- 1. Introduction
- 1.1. Research Scope
- 1.2. Market Segmentation
- 1.3. Research Objective
- 1.4. Definitions and Assumptions
- 2. Executive Summary
- 2.1. Market Snapshot
- 3. Market Dynamics
- 3.1. Market Drivers
- 3.2. Market Restrains
- 3.3. Market Trends
- 3.4. Market Opportunities
- 4. Market Factor Analysis
- 4.1. Porters Five Forces
- 4.1.1. Bargaining Power of Suppliers
- 4.1.2. Bargaining Power of Buyers
- 4.1.3. Threat of New Entrants
- 4.1.4. Threat of Substitutes
- 4.1.5. Competitive Rivalry
- 4.2. PESTEL analysis
- 4.3. BCG Analysis
- 4.3.1. Stars (High Growth, High Market Share)
- 4.3.2. Cash Cows (Low Growth, High Market Share)
- 4.3.3. Question Mark (High Growth, Low Market Share)
- 4.3.4. Dogs (Low Growth, Low Market Share)
- 4.4. Ansoff Matrix Analysis
- 4.5. Supply Chain Analysis
- 4.6. Regulatory Landscape
- 4.7. Current Market Potential and Opportunity Assessment (TAM–SAM–SOM Framework)
- 4.8. DMV Analyst Note
- 4.1. Porters Five Forces
- 5. Market Analysis, Insights and Forecast 2021-2033
- 5.1. Market Analysis, Insights and Forecast - by Form Factor
- 5.1.1. Large DDIC
- 5.1.2. Small and Medium DDIC
- 5.2. Market Analysis, Insights and Forecast - by Application
- 5.2.1. LCD
- 5.2.1.1. Desktop Monitor
- 5.2.1.2. Notebook PC
- 5.2.1.3. LCD TV
- 5.2.1.4. Tablet
- 5.2.1.5. LCD Smartphone
- 5.2.1.6. Others
- 5.2.2. OLED
- 5.2.2.1. OLED TV
- 5.2.2.2. OLED Smartphone
- 5.2.1. LCD
- 5.3. Market Analysis, Insights and Forecast - by Geography
- 5.3.1. China
- 5.3.2. Taiwan
- 5.3.3. Korea
- 5.3.4. Americas
- 5.3.5. Others
- 5.4. Market Analysis, Insights and Forecast - by Region
- 5.4.1. China
- 5.4.2. Taiwan
- 5.4.3. Korea
- 5.4.4. Americas
- 5.4.5. Others
- 5.1. Market Analysis, Insights and Forecast - by Form Factor
- 6. Global Display Driver Market Analysis, Insights and Forecast, 2021-2033
- 6.1. Market Analysis, Insights and Forecast - by Form Factor
- 6.1.1. Large DDIC
- 6.1.2. Small and Medium DDIC
- 6.2. Market Analysis, Insights and Forecast - by Application
- 6.2.1. LCD
- 6.2.1.1. Desktop Monitor
- 6.2.1.2. Notebook PC
- 6.2.1.3. LCD TV
- 6.2.1.4. Tablet
- 6.2.1.5. LCD Smartphone
- 6.2.1.6. Others
- 6.2.2. OLED
- 6.2.2.1. OLED TV
- 6.2.2.2. OLED Smartphone
- 6.2.1. LCD
- 6.3. Market Analysis, Insights and Forecast - by Geography
- 6.3.1. China
- 6.3.2. Taiwan
- 6.3.3. Korea
- 6.3.4. Americas
- 6.3.5. Others
- 6.1. Market Analysis, Insights and Forecast - by Form Factor
- 7. China Display Driver Market Analysis, Insights and Forecast, 2020-2032
- 7.1. Market Analysis, Insights and Forecast - by Form Factor
- 7.1.1. Large DDIC
- 7.1.2. Small and Medium DDIC
- 7.2. Market Analysis, Insights and Forecast - by Application
- 7.2.1. LCD
- 7.2.1.1. Desktop Monitor
- 7.2.1.2. Notebook PC
- 7.2.1.3. LCD TV
- 7.2.1.4. Tablet
- 7.2.1.5. LCD Smartphone
- 7.2.1.6. Others
- 7.2.2. OLED
- 7.2.2.1. OLED TV
- 7.2.2.2. OLED Smartphone
- 7.2.1. LCD
- 7.3. Market Analysis, Insights and Forecast - by Geography
- 7.3.1. China
- 7.3.2. Taiwan
- 7.3.3. Korea
- 7.3.4. Americas
- 7.3.5. Others
- 7.1. Market Analysis, Insights and Forecast - by Form Factor
- 8. Taiwan Display Driver Market Analysis, Insights and Forecast, 2020-2032
- 8.1. Market Analysis, Insights and Forecast - by Form Factor
- 8.1.1. Large DDIC
- 8.1.2. Small and Medium DDIC
- 8.2. Market Analysis, Insights and Forecast - by Application
- 8.2.1. LCD
- 8.2.1.1. Desktop Monitor
- 8.2.1.2. Notebook PC
- 8.2.1.3. LCD TV
- 8.2.1.4. Tablet
- 8.2.1.5. LCD Smartphone
- 8.2.1.6. Others
- 8.2.2. OLED
- 8.2.2.1. OLED TV
- 8.2.2.2. OLED Smartphone
- 8.2.1. LCD
- 8.3. Market Analysis, Insights and Forecast - by Geography
- 8.3.1. China
- 8.3.2. Taiwan
- 8.3.3. Korea
- 8.3.4. Americas
- 8.3.5. Others
- 8.1. Market Analysis, Insights and Forecast - by Form Factor
- 9. Korea Display Driver Market Analysis, Insights and Forecast, 2020-2032
- 9.1. Market Analysis, Insights and Forecast - by Form Factor
- 9.1.1. Large DDIC
- 9.1.2. Small and Medium DDIC
- 9.2. Market Analysis, Insights and Forecast - by Application
- 9.2.1. LCD
- 9.2.1.1. Desktop Monitor
- 9.2.1.2. Notebook PC
- 9.2.1.3. LCD TV
- 9.2.1.4. Tablet
- 9.2.1.5. LCD Smartphone
- 9.2.1.6. Others
- 9.2.2. OLED
- 9.2.2.1. OLED TV
- 9.2.2.2. OLED Smartphone
- 9.2.1. LCD
- 9.3. Market Analysis, Insights and Forecast - by Geography
- 9.3.1. China
- 9.3.2. Taiwan
- 9.3.3. Korea
- 9.3.4. Americas
- 9.3.5. Others
- 9.1. Market Analysis, Insights and Forecast - by Form Factor
- 10. Americas Display Driver Market Analysis, Insights and Forecast, 2020-2032
- 10.1. Market Analysis, Insights and Forecast - by Form Factor
- 10.1.1. Large DDIC
- 10.1.2. Small and Medium DDIC
- 10.2. Market Analysis, Insights and Forecast - by Application
- 10.2.1. LCD
- 10.2.1.1. Desktop Monitor
- 10.2.1.2. Notebook PC
- 10.2.1.3. LCD TV
- 10.2.1.4. Tablet
- 10.2.1.5. LCD Smartphone
- 10.2.1.6. Others
- 10.2.2. OLED
- 10.2.2.1. OLED TV
- 10.2.2.2. OLED Smartphone
- 10.2.1. LCD
- 10.3. Market Analysis, Insights and Forecast - by Geography
- 10.3.1. China
- 10.3.2. Taiwan
- 10.3.3. Korea
- 10.3.4. Americas
- 10.3.5. Others
- 10.1. Market Analysis, Insights and Forecast - by Form Factor
- 11. Others Display Driver Market Analysis, Insights and Forecast, 2020-2032
- 11.1. Market Analysis, Insights and Forecast - by Form Factor
- 11.1.1. Large DDIC
- 11.1.2. Small and Medium DDIC
- 11.2. Market Analysis, Insights and Forecast - by Application
- 11.2.1. LCD
- 11.2.1.1. Desktop Monitor
- 11.2.1.2. Notebook PC
- 11.2.1.3. LCD TV
- 11.2.1.4. Tablet
- 11.2.1.5. LCD Smartphone
- 11.2.1.6. Others
- 11.2.2. OLED
- 11.2.2.1. OLED TV
- 11.2.2.2. OLED Smartphone
- 11.2.1. LCD
- 11.3. Market Analysis, Insights and Forecast - by Geography
- 11.3.1. China
- 11.3.2. Taiwan
- 11.3.3. Korea
- 11.3.4. Americas
- 11.3.5. Others
- 11.1. Market Analysis, Insights and Forecast - by Form Factor
- 12. Competitive Analysis
- 12.1. Company Profiles
- 12.1.1 Novatek Microelectronics
- 12.1.1.1. Company Overview
- 12.1.1.2. Products
- 12.1.1.3. Company Financials
- 12.1.1.4. SWOT Analysis
- 12.1.2 Raydium
- 12.1.2.1. Company Overview
- 12.1.2.2. Products
- 12.1.2.3. Company Financials
- 12.1.2.4. SWOT Analysis
- 12.1.3 Focaltech
- 12.1.3.1. Company Overview
- 12.1.3.2. Products
- 12.1.3.3. Company Financials
- 12.1.3.4. SWOT Analysis
- 12.1.4 Synaptics Incorporated
- 12.1.4.1. Company Overview
- 12.1.4.2. Products
- 12.1.4.3. Company Financials
- 12.1.4.4. SWOT Analysis
- 12.1.5 Sitronix
- 12.1.5.1. Company Overview
- 12.1.5.2. Products
- 12.1.5.3. Company Financials
- 12.1.5.4. SWOT Analysis
- 12.1.6 Himax
- 12.1.6.1. Company Overview
- 12.1.6.2. Products
- 12.1.6.3. Company Financials
- 12.1.6.4. SWOT Analysis
- 12.1.7 Samsung Electronics Co Ltd
- 12.1.7.1. Company Overview
- 12.1.7.2. Products
- 12.1.7.3. Company Financials
- 12.1.7.4. SWOT Analysis
- 12.1.8 Magnachip Semiconductor
- 12.1.8.1. Company Overview
- 12.1.8.2. Products
- 12.1.8.3. Company Financials
- 12.1.8.4. SWOT Analysis
- 12.1.9 Fitipower Integrated Technology Inc
- 12.1.9.1. Company Overview
- 12.1.9.2. Products
- 12.1.9.3. Company Financials
- 12.1.9.4. SWOT Analysis
- 12.1.10 LX Semicon*List Not Exhaustive
- 12.1.10.1. Company Overview
- 12.1.10.2. Products
- 12.1.10.3. Company Financials
- 12.1.10.4. SWOT Analysis
- 12.1.11 MediaTek
- 12.1.11.1. Company Overview
- 12.1.11.2. Products
- 12.1.11.3. Company Financials
- 12.1.11.4. SWOT Analysis
- 12.1.1 Novatek Microelectronics
- 12.2. Market Entropy
- 12.2.1 Company's Key Areas Served
- 12.2.2 Recent Developments
- 12.3. Company Market Share Analysis 2025
- 12.3.1 Top 5 Companies Market Share Analysis
- 12.3.2 Top 3 Companies Market Share Analysis
- 12.4. List of Potential Customers
- 13. Research Methodology
List of Figures
- Figure 1: Global Display Driver Market Revenue Breakdown (million, %) by Region 2025 & 2033
- Figure 2: China Display Driver Market Revenue (million), by Form Factor 2025 & 2033
- Figure 3: China Display Driver Market Revenue Share (%), by Form Factor 2025 & 2033
- Figure 4: China Display Driver Market Revenue (million), by Application 2025 & 2033
- Figure 5: China Display Driver Market Revenue Share (%), by Application 2025 & 2033
- Figure 6: China Display Driver Market Revenue (million), by Geography 2025 & 2033
- Figure 7: China Display Driver Market Revenue Share (%), by Geography 2025 & 2033
- Figure 8: China Display Driver Market Revenue (million), by Country 2025 & 2033
- Figure 9: China Display Driver Market Revenue Share (%), by Country 2025 & 2033
- Figure 10: Taiwan Display Driver Market Revenue (million), by Form Factor 2025 & 2033
- Figure 11: Taiwan Display Driver Market Revenue Share (%), by Form Factor 2025 & 2033
- Figure 12: Taiwan Display Driver Market Revenue (million), by Application 2025 & 2033
- Figure 13: Taiwan Display Driver Market Revenue Share (%), by Application 2025 & 2033
- Figure 14: Taiwan Display Driver Market Revenue (million), by Geography 2025 & 2033
- Figure 15: Taiwan Display Driver Market Revenue Share (%), by Geography 2025 & 2033
- Figure 16: Taiwan Display Driver Market Revenue (million), by Country 2025 & 2033
- Figure 17: Taiwan Display Driver Market Revenue Share (%), by Country 2025 & 2033
- Figure 18: Korea Display Driver Market Revenue (million), by Form Factor 2025 & 2033
- Figure 19: Korea Display Driver Market Revenue Share (%), by Form Factor 2025 & 2033
- Figure 20: Korea Display Driver Market Revenue (million), by Application 2025 & 2033
- Figure 21: Korea Display Driver Market Revenue Share (%), by Application 2025 & 2033
- Figure 22: Korea Display Driver Market Revenue (million), by Geography 2025 & 2033
- Figure 23: Korea Display Driver Market Revenue Share (%), by Geography 2025 & 2033
- Figure 24: Korea Display Driver Market Revenue (million), by Country 2025 & 2033
- Figure 25: Korea Display Driver Market Revenue Share (%), by Country 2025 & 2033
- Figure 26: Americas Display Driver Market Revenue (million), by Form Factor 2025 & 2033
- Figure 27: Americas Display Driver Market Revenue Share (%), by Form Factor 2025 & 2033
- Figure 28: Americas Display Driver Market Revenue (million), by Application 2025 & 2033
- Figure 29: Americas Display Driver Market Revenue Share (%), by Application 2025 & 2033
- Figure 30: Americas Display Driver Market Revenue (million), by Geography 2025 & 2033
- Figure 31: Americas Display Driver Market Revenue Share (%), by Geography 2025 & 2033
- Figure 32: Americas Display Driver Market Revenue (million), by Country 2025 & 2033
- Figure 33: Americas Display Driver Market Revenue Share (%), by Country 2025 & 2033
- Figure 34: Others Display Driver Market Revenue (million), by Form Factor 2025 & 2033
- Figure 35: Others Display Driver Market Revenue Share (%), by Form Factor 2025 & 2033
- Figure 36: Others Display Driver Market Revenue (million), by Application 2025 & 2033
- Figure 37: Others Display Driver Market Revenue Share (%), by Application 2025 & 2033
- Figure 38: Others Display Driver Market Revenue (million), by Geography 2025 & 2033
- Figure 39: Others Display Driver Market Revenue Share (%), by Geography 2025 & 2033
- Figure 40: Others Display Driver Market Revenue (million), by Country 2025 & 2033
- Figure 41: Others Display Driver Market Revenue Share (%), by Country 2025 & 2033
List of Tables
- Table 1: Global Display Driver Market Revenue million Forecast, by Form Factor 2020 & 2033
- Table 2: Global Display Driver Market Revenue million Forecast, by Application 2020 & 2033
- Table 3: Global Display Driver Market Revenue million Forecast, by Geography 2020 & 2033
- Table 4: Global Display Driver Market Revenue million Forecast, by Region 2020 & 2033
- Table 5: Global Display Driver Market Revenue million Forecast, by Form Factor 2020 & 2033
- Table 6: Global Display Driver Market Revenue million Forecast, by Application 2020 & 2033
- Table 7: Global Display Driver Market Revenue million Forecast, by Geography 2020 & 2033
- Table 8: Global Display Driver Market Revenue million Forecast, by Country 2020 & 2033
- Table 9: Global Display Driver Market Revenue million Forecast, by Form Factor 2020 & 2033
- Table 10: Global Display Driver Market Revenue million Forecast, by Application 2020 & 2033
- Table 11: Global Display Driver Market Revenue million Forecast, by Geography 2020 & 2033
- Table 12: Global Display Driver Market Revenue million Forecast, by Country 2020 & 2033
- Table 13: Global Display Driver Market Revenue million Forecast, by Form Factor 2020 & 2033
- Table 14: Global Display Driver Market Revenue million Forecast, by Application 2020 & 2033
- Table 15: Global Display Driver Market Revenue million Forecast, by Geography 2020 & 2033
- Table 16: Global Display Driver Market Revenue million Forecast, by Country 2020 & 2033
- Table 17: Global Display Driver Market Revenue million Forecast, by Form Factor 2020 & 2033
- Table 18: Global Display Driver Market Revenue million Forecast, by Application 2020 & 2033
- Table 19: Global Display Driver Market Revenue million Forecast, by Geography 2020 & 2033
- Table 20: Global Display Driver Market Revenue million Forecast, by Country 2020 & 2033
- Table 21: Global Display Driver Market Revenue million Forecast, by Form Factor 2020 & 2033
- Table 22: Global Display Driver Market Revenue million Forecast, by Application 2020 & 2033
- Table 23: Global Display Driver Market Revenue million Forecast, by Geography 2020 & 2033
- Table 24: Global Display Driver Market Revenue million Forecast, by Country 2020 & 2033
Frequently Asked Questions
1. What is the projected Compound Annual Growth Rate (CAGR) of the Display Driver Market?
The projected CAGR is approximately 6.6%.
2. Which companies are prominent players in the Display Driver Market?
Key companies in the market include Novatek Microelectronics, Raydium, Focaltech, Synaptics Incorporated, Sitronix, Himax, Samsung Electronics Co Ltd, Magnachip Semiconductor, Fitipower Integrated Technology Inc, LX Semicon*List Not Exhaustive, MediaTek.
3. What are the main segments of the Display Driver Market?
The market segments include Form Factor, Application, Geography.
4. Can you provide details about the market size?
The market size is estimated to be USD 9467.18 million as of 2022.
5. What are some drivers contributing to market growth?
Rising Demand for LCD Panels for Mobile Devices. TVs. and PC Monitors; Increase Investment in Innovative Display for the Automotive Sector.
6. What are the notable trends driving market growth?
OLED Display Technology Drive the Market Growth.
7. Are there any restraints impacting market growth?
Vendor Lock-in is a Major Barrier to the Adoption of Pharmacy Management Systems.
8. Can you provide examples of recent developments in the market?
August 2022 - LX Semicon, a South Korean chip fabless firm, has formed a research team dedicated to developing automobile display driver ICs. The team will build display driver ICs for central information display, cluster, head-up display, and other displays on automobiles.
9. What pricing options are available for accessing the report?
Pricing options include single-user, multi-user, and enterprise licenses priced at USD 4750, USD 5250, and USD 8750 respectively.
10. Is the market size provided in terms of value or volume?
The market size is provided in terms of value, measured in million.
11. Are there any specific market keywords associated with the report?
Yes, the market keyword associated with the report is "Display Driver Market," which aids in identifying and referencing the specific market segment covered.
12. How do I determine which pricing option suits my needs best?
The pricing options vary based on user requirements and access needs. Individual users may opt for single-user licenses, while businesses requiring broader access may choose multi-user or enterprise licenses for cost-effective access to the report.
13. Are there any additional resources or data provided in the Display Driver Market report?
While the report offers comprehensive insights, it's advisable to review the specific contents or supplementary materials provided to ascertain if additional resources or data are available.
14. How can I stay updated on further developments or reports in the Display Driver Market?
To stay informed about further developments, trends, and reports in the Display Driver Market, consider subscribing to industry newsletters, following relevant companies and organizations, or regularly checking reputable industry news sources and publications.
Methodology
Step 1 - Identification of Relevant Samples Size from Population Database


Step 2 - Approaches for Defining Global Market Size (Value, Volume* & Price*)

Note*: In applicable scenarios
Step 3 - Data Sources
Primary Research
- Web Analytics
- Survey Reports
- Research Institute
- Latest Research Reports
- Opinion Leaders
Secondary Research
- Annual Reports
- White Paper
- Latest Press Release
- Industry Association
- Paid Database
- Investor Presentations

Step 4 - Data Triangulation
Involves using different sources of information in order to increase the validity of a study
These sources are likely to be stakeholders in a program - participants, other researchers, program staff, other community members, and so on.
Then we put all data in single framework & apply various statistical tools to find out the dynamic on the market.
During the analysis stage, feedback from the stakeholder groups would be compared to determine areas of agreement as well as areas of divergence