

Key Insights
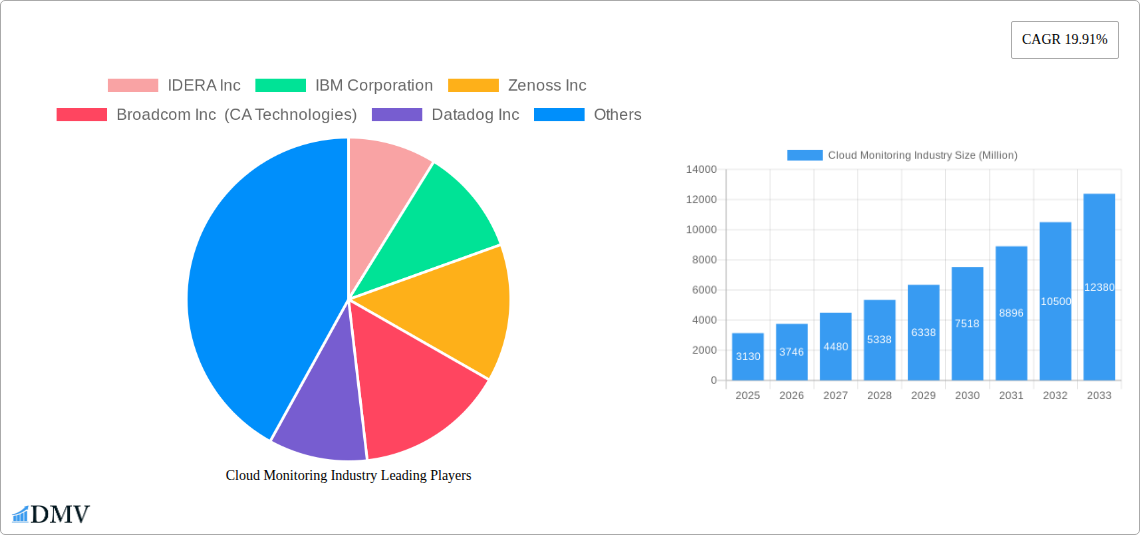
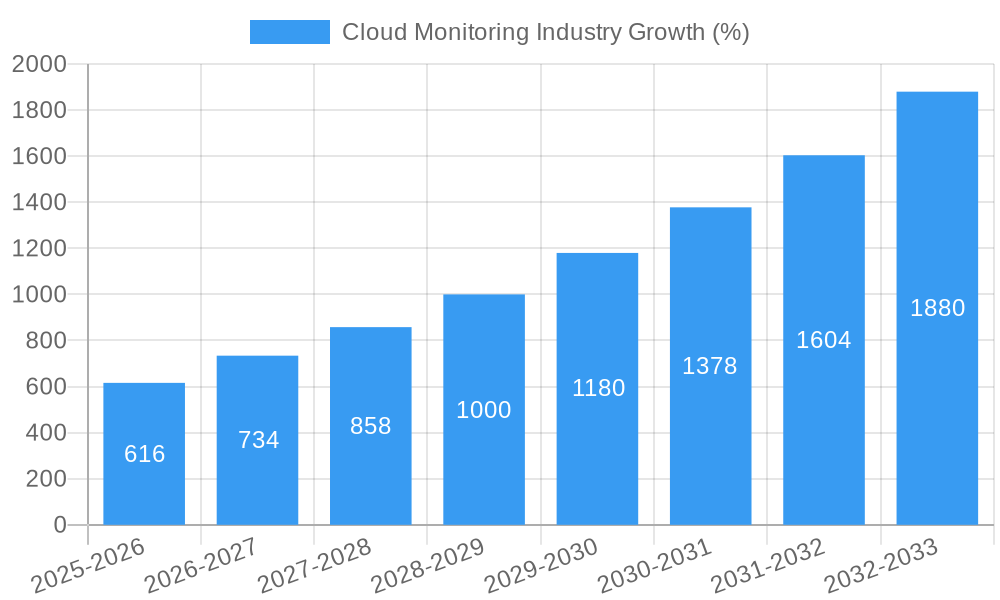
The global cloud monitoring market is experiencing robust growth, projected to reach a substantial size driven by the increasing adoption of cloud computing across various sectors. The market's Compound Annual Growth Rate (CAGR) of 19.91% from 2019 to 2024 indicates a significant upward trajectory, expected to continue throughout the forecast period (2025-2033). Key drivers include the rising need for enhanced application performance, improved operational efficiency, and proactive threat detection in dynamic cloud environments. Businesses are increasingly relying on comprehensive monitoring solutions to ensure service availability, optimize resource utilization, and maintain compliance with stringent security regulations. The market is segmented by model (IaaS, SaaS, PaaS) and end-user industry (BFSI, Retail, IT & Telecommunications, Healthcare, Government, Manufacturing, and others). The SaaS model currently dominates due to its ease of deployment and scalability, while the BFSI and IT & Telecommunications sectors are major contributors to market revenue owing to their heavy reliance on cloud infrastructure. Competitive pressures are shaping the market landscape, with established players like IBM, Microsoft, and Oracle competing with emerging innovative companies offering specialized solutions. Geographic expansion, particularly in rapidly developing economies in Asia Pacific, further fuels market expansion. Challenges include managing the complexity of hybrid and multi-cloud environments, along with the need for robust data security and privacy measures.
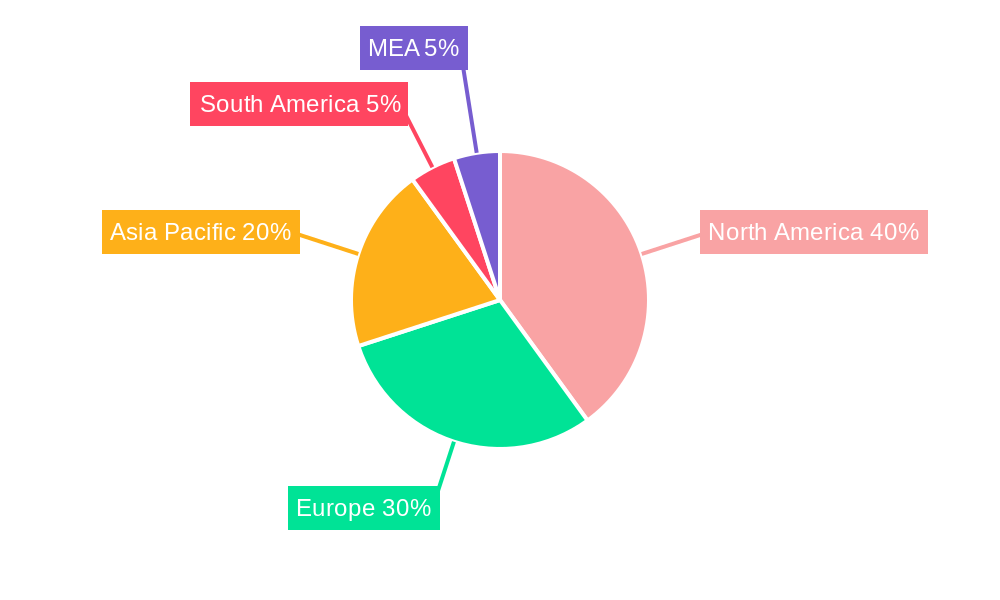
The forecast period (2025-2033) promises continued expansion driven by factors such as the increasing adoption of DevOps methodologies, the growth of IoT devices generating vast amounts of data requiring monitoring, and the expanding use of AI and machine learning for improved anomaly detection and predictive analytics within cloud environments. North America currently holds a substantial market share due to high cloud adoption rates and technological advancements, yet Asia Pacific is expected to witness significant growth due to rapid digital transformation initiatives in countries like India and China. The diverse needs of different industry sectors are expected to fuel further specialization within the cloud monitoring market, leading to the emergence of niche players catering to specific vertical requirements. Overall, the market demonstrates a robust outlook, characterized by ongoing innovation and considerable growth potential across various segments and regions.
Cloud Monitoring Industry Market Report: 2019-2033
This comprehensive report provides an in-depth analysis of the Cloud Monitoring industry, projecting a market value exceeding $xx Million by 2033. The study covers the period from 2019 to 2033, with 2025 serving as the base and estimated year. The report meticulously examines market trends, competitive dynamics, technological advancements, and growth opportunities, offering invaluable insights for stakeholders.
Cloud Monitoring Industry Market Composition & Trends
The global cloud monitoring market, valued at $xx Million in 2024, exhibits a moderately consolidated structure with key players like Datadog, IBM, and AWS holding significant market share. However, the market is dynamic, fueled by continuous innovation in areas like AI-powered observability and automation. The regulatory landscape, while evolving, generally supports cloud adoption, albeit with increasing data privacy concerns. Substitute products, such as on-premise monitoring solutions, are gradually losing ground to the scalability and cost-effectiveness of cloud-based alternatives. End-users across diverse sectors, including BFSI, IT & Telecommunications, and Healthcare, drive market demand. The market has witnessed several significant M&A activities in recent years, with deal values totaling $xx Million, reflecting the consolidation trend and strategic acquisitions for technological expansion.
- Market Share Distribution (2024): AWS (xx%), IBM (xx%), Datadog (xx%), Others (xx%).
- M&A Deal Value (2019-2024): $xx Million
- Key Innovation Catalysts: AI/ML-driven analytics, automation, serverless monitoring.
- Major Regulatory Considerations: Data privacy (GDPR, CCPA), security compliance (SOC 2, ISO 27001).
Cloud Monitoring Industry Industry Evolution
The cloud monitoring market has experienced robust growth throughout the historical period (2019-2024), driven by the widespread adoption of cloud computing and the increasing complexity of cloud-native applications. The Compound Annual Growth Rate (CAGR) during this period is estimated at xx%. Technological advancements, particularly in areas such as artificial intelligence (AI) and machine learning (ML), have significantly enhanced the capabilities of cloud monitoring solutions. AI-powered anomaly detection and predictive analytics are becoming increasingly prevalent, enabling proactive issue resolution and optimized resource management. Consumer demand is shifting towards solutions that offer greater visibility, comprehensive observability, and seamless integration with existing IT infrastructure. The rising adoption of microservices architecture and containerization further fuels the demand for sophisticated cloud monitoring capabilities. The market is projected to maintain a healthy CAGR of xx% during the forecast period (2025-2033), reaching a market value exceeding $xx Million by 2033.
- CAGR (2019-2024): xx%
- Projected CAGR (2025-2033): xx%
- Adoption Rate (2024): xx% of enterprises using cloud-based monitoring.
Leading Regions, Countries, or Segments in Cloud Monitoring Industry
North America currently dominates the cloud monitoring market, driven by high cloud adoption rates, robust IT infrastructure, and substantial investments in technological innovation. Within the segment breakdown, the SaaS model holds the largest market share, attributed to its flexibility, scalability, and cost-effectiveness. The BFSI and IT & Telecommunications sectors are significant end-user segments, owing to their critical dependence on reliable and secure IT infrastructure.
- Dominant Region: North America
- Fastest-Growing Region: Asia-Pacific
- Largest Segment (By Model): SaaS
- Key Drivers (North America): High cloud adoption, strong IT infrastructure investments, early adoption of new technologies.
- Key Drivers (BFSI): Stringent regulatory compliance needs, high data security requirements, increasing digital transformation initiatives.
Cloud Monitoring Industry Product Innovations
Recent product innovations focus on enhanced AI/ML capabilities, improved automation, and greater integration with DevOps and CI/CD pipelines. This includes advanced anomaly detection, predictive analytics, and automated remediation capabilities. Many solutions are incorporating serverless monitoring and support for containerized environments. Unique selling propositions often center around ease of use, comprehensive visibility, and cost optimization.
Propelling Factors for Cloud Monitoring Industry Growth
The cloud monitoring market is fueled by a multitude of factors, including the increasing adoption of cloud computing, the growing complexity of IT infrastructure, the rising demand for improved application performance, and the need for enhanced security. Government initiatives supporting digital transformation and regulatory compliance requirements contribute significantly to market growth.
Obstacles in the Cloud Monitoring Industry Market
Market growth is hampered by factors including the high cost of implementation and maintenance, the complexity of integrating with existing IT infrastructure, and the lack of skilled professionals. Moreover, intense competition amongst established players and emerging vendors creates pricing pressure and necessitates continuous innovation to retain market share.
Future Opportunities in Cloud Monitoring Industry
Future opportunities lie in expanding into emerging markets, further developing AI/ML capabilities, and integrating with emerging technologies like edge computing and IoT. Providing customized solutions tailored to specific industry verticals and increasing focus on security and compliance will further propel market growth.
Major Players in the Cloud Monitoring Industry Ecosystem
- IDERA Inc
- IBM Corporation
- Zenoss Inc
- Broadcom Inc (CA Technologies)
- Datadog Inc
- Microsoft Corporation
- Oracle Corporation
- AWS
- LogicMonitor Inc
Key Developments in Cloud Monitoring Industry Industry
- June 2022: Cisco expanded its cloud-based management solutions, adding Nexus data center and Catalyst campus switches, and launching a cloud-native version of AppDynamics. This significantly broadened Cisco's reach in the cloud monitoring market.
- April 2023: Sumo Logic earned the AWS cloud operations competency in monitoring and observability, solidifying its position within the AWS ecosystem and reinforcing its credibility in the market.
Strategic Cloud Monitoring Industry Market Forecast
The cloud monitoring market is poised for sustained growth driven by the ongoing shift towards cloud computing, the increasing complexity of cloud-native applications, and the growing demand for enhanced security and observability. The integration of AI and ML will further enhance solution capabilities, paving the way for proactive issue resolution and improved resource management. The market’s expansion into emerging sectors and geographies presents substantial growth potential for both established and new market entrants.
Cloud Monitoring Industry Segmentation
-
1. Model
- 1.1. IaaS
- 1.2. SaaS
- 1.3. PaaS
-
2. End-User Industry
- 2.1. BFSI
- 2.2. Retail
- 2.3. IT and Telecommunications
- 2.4. Healthcare
- 2.5. Government
- 2.6. Manufacturing
- 2.7. Other End-User Industries
Cloud Monitoring Industry Segmentation By Geography
-
1. North America
- 1.1. United States
- 1.2. Canada
-
2. Europe
- 2.1. United Kingdom
- 2.2. Germany
- 2.3. France
- 2.4. Spain
-
3. Asia
- 3.1. China
- 3.2. Japan
- 3.3. Singapore
- 3.4. Australia and New Zealand
-
4. Latin America
- 4.1. Mexico
- 4.2. Brazil
-
5. Middle East and Africa
- 5.1. United Arab Emirates
- 5.2. Saudi Arabia
Cloud Monitoring Industry REPORT HIGHLIGHTS
| Aspects | Details |
|---|---|
| Study Period | 2019-2033 |
| Base Year | 2024 |
| Estimated Year | 2025 |
| Forecast Period | 2025-2033 |
| Historical Period | 2019-2024 |
| Growth Rate | CAGR of 19.91% from 2019-2033 |
| Segmentation |
|
Table of Contents
- 1. Introduction
- 1.1. Research Scope
- 1.2. Market Segmentation
- 1.3. Research Methodology
- 1.4. Definitions and Assumptions
- 2. Executive Summary
- 2.1. Introduction
- 3. Market Dynamics
- 3.1. Introduction
- 3.2. Market Drivers
- 3.2.1. Growth in Cloud Adoption Across End Users; Rising Need for Efficiently Managing the Performance and Security of Cloud Platforms
- 3.3. Market Restrains
- 3.3.1. Diminishing Profit Margins and Ongoing Changes in Macro-environment
- 3.4. Market Trends
- 3.4.1. Growth in Cloud Adoption Across End Users is Expected to Drive the Market Growth
- 4. Market Factor Analysis
- 4.1. Porters Five Forces
- 4.2. Supply/Value Chain
- 4.3. PESTEL analysis
- 4.4. Market Entropy
- 4.5. Patent/Trademark Analysis
- 5. Global Cloud Monitoring Industry Analysis, Insights and Forecast, 2019-2031
- 5.1. Market Analysis, Insights and Forecast - by Model
- 5.1.1. IaaS
- 5.1.2. SaaS
- 5.1.3. PaaS
- 5.2. Market Analysis, Insights and Forecast - by End-User Industry
- 5.2.1. BFSI
- 5.2.2. Retail
- 5.2.3. IT and Telecommunications
- 5.2.4. Healthcare
- 5.2.5. Government
- 5.2.6. Manufacturing
- 5.2.7. Other End-User Industries
- 5.3. Market Analysis, Insights and Forecast - by Region
- 5.3.1. North America
- 5.3.2. Europe
- 5.3.3. Asia
- 5.3.4. Latin America
- 5.3.5. Middle East and Africa
- 5.1. Market Analysis, Insights and Forecast - by Model
- 6. North America Cloud Monitoring Industry Analysis, Insights and Forecast, 2019-2031
- 6.1. Market Analysis, Insights and Forecast - by Model
- 6.1.1. IaaS
- 6.1.2. SaaS
- 6.1.3. PaaS
- 6.2. Market Analysis, Insights and Forecast - by End-User Industry
- 6.2.1. BFSI
- 6.2.2. Retail
- 6.2.3. IT and Telecommunications
- 6.2.4. Healthcare
- 6.2.5. Government
- 6.2.6. Manufacturing
- 6.2.7. Other End-User Industries
- 6.1. Market Analysis, Insights and Forecast - by Model
- 7. Europe Cloud Monitoring Industry Analysis, Insights and Forecast, 2019-2031
- 7.1. Market Analysis, Insights and Forecast - by Model
- 7.1.1. IaaS
- 7.1.2. SaaS
- 7.1.3. PaaS
- 7.2. Market Analysis, Insights and Forecast - by End-User Industry
- 7.2.1. BFSI
- 7.2.2. Retail
- 7.2.3. IT and Telecommunications
- 7.2.4. Healthcare
- 7.2.5. Government
- 7.2.6. Manufacturing
- 7.2.7. Other End-User Industries
- 7.1. Market Analysis, Insights and Forecast - by Model
- 8. Asia Cloud Monitoring Industry Analysis, Insights and Forecast, 2019-2031
- 8.1. Market Analysis, Insights and Forecast - by Model
- 8.1.1. IaaS
- 8.1.2. SaaS
- 8.1.3. PaaS
- 8.2. Market Analysis, Insights and Forecast - by End-User Industry
- 8.2.1. BFSI
- 8.2.2. Retail
- 8.2.3. IT and Telecommunications
- 8.2.4. Healthcare
- 8.2.5. Government
- 8.2.6. Manufacturing
- 8.2.7. Other End-User Industries
- 8.1. Market Analysis, Insights and Forecast - by Model
- 9. Latin America Cloud Monitoring Industry Analysis, Insights and Forecast, 2019-2031
- 9.1. Market Analysis, Insights and Forecast - by Model
- 9.1.1. IaaS
- 9.1.2. SaaS
- 9.1.3. PaaS
- 9.2. Market Analysis, Insights and Forecast - by End-User Industry
- 9.2.1. BFSI
- 9.2.2. Retail
- 9.2.3. IT and Telecommunications
- 9.2.4. Healthcare
- 9.2.5. Government
- 9.2.6. Manufacturing
- 9.2.7. Other End-User Industries
- 9.1. Market Analysis, Insights and Forecast - by Model
- 10. Middle East and Africa Cloud Monitoring Industry Analysis, Insights and Forecast, 2019-2031
- 10.1. Market Analysis, Insights and Forecast - by Model
- 10.1.1. IaaS
- 10.1.2. SaaS
- 10.1.3. PaaS
- 10.2. Market Analysis, Insights and Forecast - by End-User Industry
- 10.2.1. BFSI
- 10.2.2. Retail
- 10.2.3. IT and Telecommunications
- 10.2.4. Healthcare
- 10.2.5. Government
- 10.2.6. Manufacturing
- 10.2.7. Other End-User Industries
- 10.1. Market Analysis, Insights and Forecast - by Model
- 11. North America Cloud Monitoring Industry Analysis, Insights and Forecast, 2019-2031
- 11.1. Market Analysis, Insights and Forecast - By Country/Sub-region
- 11.1.1 United States
- 11.1.2 Canada
- 11.1.3 Mexico
- 12. Europe Cloud Monitoring Industry Analysis, Insights and Forecast, 2019-2031
- 12.1. Market Analysis, Insights and Forecast - By Country/Sub-region
- 12.1.1 Germany
- 12.1.2 United Kingdom
- 12.1.3 France
- 12.1.4 Spain
- 12.1.5 Italy
- 12.1.6 Spain
- 12.1.7 Belgium
- 12.1.8 Netherland
- 12.1.9 Nordics
- 12.1.10 Rest of Europe
- 13. Asia Pacific Cloud Monitoring Industry Analysis, Insights and Forecast, 2019-2031
- 13.1. Market Analysis, Insights and Forecast - By Country/Sub-region
- 13.1.1 China
- 13.1.2 Japan
- 13.1.3 India
- 13.1.4 South Korea
- 13.1.5 Southeast Asia
- 13.1.6 Australia
- 13.1.7 Indonesia
- 13.1.8 Phillipes
- 13.1.9 Singapore
- 13.1.10 Thailandc
- 13.1.11 Rest of Asia Pacific
- 14. South America Cloud Monitoring Industry Analysis, Insights and Forecast, 2019-2031
- 14.1. Market Analysis, Insights and Forecast - By Country/Sub-region
- 14.1.1 Brazil
- 14.1.2 Argentina
- 14.1.3 Peru
- 14.1.4 Chile
- 14.1.5 Colombia
- 14.1.6 Ecuador
- 14.1.7 Venezuela
- 14.1.8 Rest of South America
- 15. North America Cloud Monitoring Industry Analysis, Insights and Forecast, 2019-2031
- 15.1. Market Analysis, Insights and Forecast - By Country/Sub-region
- 15.1.1 United States
- 15.1.2 Canada
- 15.1.3 Mexico
- 16. MEA Cloud Monitoring Industry Analysis, Insights and Forecast, 2019-2031
- 16.1. Market Analysis, Insights and Forecast - By Country/Sub-region
- 16.1.1 United Arab Emirates
- 16.1.2 Saudi Arabia
- 16.1.3 South Africa
- 16.1.4 Rest of Middle East and Africa
- 17. Competitive Analysis
- 17.1. Global Market Share Analysis 2024
- 17.2. Company Profiles
- 17.2.1 IDERA Inc
- 17.2.1.1. Overview
- 17.2.1.2. Products
- 17.2.1.3. SWOT Analysis
- 17.2.1.4. Recent Developments
- 17.2.1.5. Financials (Based on Availability)
- 17.2.2 IBM Corporation
- 17.2.2.1. Overview
- 17.2.2.2. Products
- 17.2.2.3. SWOT Analysis
- 17.2.2.4. Recent Developments
- 17.2.2.5. Financials (Based on Availability)
- 17.2.3 Zenoss Inc
- 17.2.3.1. Overview
- 17.2.3.2. Products
- 17.2.3.3. SWOT Analysis
- 17.2.3.4. Recent Developments
- 17.2.3.5. Financials (Based on Availability)
- 17.2.4 Broadcom Inc (CA Technologies)
- 17.2.4.1. Overview
- 17.2.4.2. Products
- 17.2.4.3. SWOT Analysis
- 17.2.4.4. Recent Developments
- 17.2.4.5. Financials (Based on Availability)
- 17.2.5 Datadog Inc
- 17.2.5.1. Overview
- 17.2.5.2. Products
- 17.2.5.3. SWOT Analysis
- 17.2.5.4. Recent Developments
- 17.2.5.5. Financials (Based on Availability)
- 17.2.6 Microsoft Corporation
- 17.2.6.1. Overview
- 17.2.6.2. Products
- 17.2.6.3. SWOT Analysis
- 17.2.6.4. Recent Developments
- 17.2.6.5. Financials (Based on Availability)
- 17.2.7 Oracle Corporation
- 17.2.7.1. Overview
- 17.2.7.2. Products
- 17.2.7.3. SWOT Analysis
- 17.2.7.4. Recent Developments
- 17.2.7.5. Financials (Based on Availability)
- 17.2.8 AWS
- 17.2.8.1. Overview
- 17.2.8.2. Products
- 17.2.8.3. SWOT Analysis
- 17.2.8.4. Recent Developments
- 17.2.8.5. Financials (Based on Availability)
- 17.2.9 LogicMonitor Inc
- 17.2.9.1. Overview
- 17.2.9.2. Products
- 17.2.9.3. SWOT Analysis
- 17.2.9.4. Recent Developments
- 17.2.9.5. Financials (Based on Availability)
- 17.2.1 IDERA Inc
List of Figures
- Figure 1: Global Cloud Monitoring Industry Revenue Breakdown (Million, %) by Region 2024 & 2032
- Figure 2: Global Cloud Monitoring Industry Volume Breakdown (K Unit, %) by Region 2024 & 2032
- Figure 3: North America Cloud Monitoring Industry Revenue (Million), by Country 2024 & 2032
- Figure 4: North America Cloud Monitoring Industry Volume (K Unit), by Country 2024 & 2032
- Figure 5: North America Cloud Monitoring Industry Revenue Share (%), by Country 2024 & 2032
- Figure 6: North America Cloud Monitoring Industry Volume Share (%), by Country 2024 & 2032
- Figure 7: Europe Cloud Monitoring Industry Revenue (Million), by Country 2024 & 2032
- Figure 8: Europe Cloud Monitoring Industry Volume (K Unit), by Country 2024 & 2032
- Figure 9: Europe Cloud Monitoring Industry Revenue Share (%), by Country 2024 & 2032
- Figure 10: Europe Cloud Monitoring Industry Volume Share (%), by Country 2024 & 2032
- Figure 11: Asia Pacific Cloud Monitoring Industry Revenue (Million), by Country 2024 & 2032
- Figure 12: Asia Pacific Cloud Monitoring Industry Volume (K Unit), by Country 2024 & 2032
- Figure 13: Asia Pacific Cloud Monitoring Industry Revenue Share (%), by Country 2024 & 2032
- Figure 14: Asia Pacific Cloud Monitoring Industry Volume Share (%), by Country 2024 & 2032
- Figure 15: South America Cloud Monitoring Industry Revenue (Million), by Country 2024 & 2032
- Figure 16: South America Cloud Monitoring Industry Volume (K Unit), by Country 2024 & 2032
- Figure 17: South America Cloud Monitoring Industry Revenue Share (%), by Country 2024 & 2032
- Figure 18: South America Cloud Monitoring Industry Volume Share (%), by Country 2024 & 2032
- Figure 19: North America Cloud Monitoring Industry Revenue (Million), by Country 2024 & 2032
- Figure 20: North America Cloud Monitoring Industry Volume (K Unit), by Country 2024 & 2032
- Figure 21: North America Cloud Monitoring Industry Revenue Share (%), by Country 2024 & 2032
- Figure 22: North America Cloud Monitoring Industry Volume Share (%), by Country 2024 & 2032
- Figure 23: MEA Cloud Monitoring Industry Revenue (Million), by Country 2024 & 2032
- Figure 24: MEA Cloud Monitoring Industry Volume (K Unit), by Country 2024 & 2032
- Figure 25: MEA Cloud Monitoring Industry Revenue Share (%), by Country 2024 & 2032
- Figure 26: MEA Cloud Monitoring Industry Volume Share (%), by Country 2024 & 2032
- Figure 27: North America Cloud Monitoring Industry Revenue (Million), by Model 2024 & 2032
- Figure 28: North America Cloud Monitoring Industry Volume (K Unit), by Model 2024 & 2032
- Figure 29: North America Cloud Monitoring Industry Revenue Share (%), by Model 2024 & 2032
- Figure 30: North America Cloud Monitoring Industry Volume Share (%), by Model 2024 & 2032
- Figure 31: North America Cloud Monitoring Industry Revenue (Million), by End-User Industry 2024 & 2032
- Figure 32: North America Cloud Monitoring Industry Volume (K Unit), by End-User Industry 2024 & 2032
- Figure 33: North America Cloud Monitoring Industry Revenue Share (%), by End-User Industry 2024 & 2032
- Figure 34: North America Cloud Monitoring Industry Volume Share (%), by End-User Industry 2024 & 2032
- Figure 35: North America Cloud Monitoring Industry Revenue (Million), by Country 2024 & 2032
- Figure 36: North America Cloud Monitoring Industry Volume (K Unit), by Country 2024 & 2032
- Figure 37: North America Cloud Monitoring Industry Revenue Share (%), by Country 2024 & 2032
- Figure 38: North America Cloud Monitoring Industry Volume Share (%), by Country 2024 & 2032
- Figure 39: Europe Cloud Monitoring Industry Revenue (Million), by Model 2024 & 2032
- Figure 40: Europe Cloud Monitoring Industry Volume (K Unit), by Model 2024 & 2032
- Figure 41: Europe Cloud Monitoring Industry Revenue Share (%), by Model 2024 & 2032
- Figure 42: Europe Cloud Monitoring Industry Volume Share (%), by Model 2024 & 2032
- Figure 43: Europe Cloud Monitoring Industry Revenue (Million), by End-User Industry 2024 & 2032
- Figure 44: Europe Cloud Monitoring Industry Volume (K Unit), by End-User Industry 2024 & 2032
- Figure 45: Europe Cloud Monitoring Industry Revenue Share (%), by End-User Industry 2024 & 2032
- Figure 46: Europe Cloud Monitoring Industry Volume Share (%), by End-User Industry 2024 & 2032
- Figure 47: Europe Cloud Monitoring Industry Revenue (Million), by Country 2024 & 2032
- Figure 48: Europe Cloud Monitoring Industry Volume (K Unit), by Country 2024 & 2032
- Figure 49: Europe Cloud Monitoring Industry Revenue Share (%), by Country 2024 & 2032
- Figure 50: Europe Cloud Monitoring Industry Volume Share (%), by Country 2024 & 2032
- Figure 51: Asia Cloud Monitoring Industry Revenue (Million), by Model 2024 & 2032
- Figure 52: Asia Cloud Monitoring Industry Volume (K Unit), by Model 2024 & 2032
- Figure 53: Asia Cloud Monitoring Industry Revenue Share (%), by Model 2024 & 2032
- Figure 54: Asia Cloud Monitoring Industry Volume Share (%), by Model 2024 & 2032
- Figure 55: Asia Cloud Monitoring Industry Revenue (Million), by End-User Industry 2024 & 2032
- Figure 56: Asia Cloud Monitoring Industry Volume (K Unit), by End-User Industry 2024 & 2032
- Figure 57: Asia Cloud Monitoring Industry Revenue Share (%), by End-User Industry 2024 & 2032
- Figure 58: Asia Cloud Monitoring Industry Volume Share (%), by End-User Industry 2024 & 2032
- Figure 59: Asia Cloud Monitoring Industry Revenue (Million), by Country 2024 & 2032
- Figure 60: Asia Cloud Monitoring Industry Volume (K Unit), by Country 2024 & 2032
- Figure 61: Asia Cloud Monitoring Industry Revenue Share (%), by Country 2024 & 2032
- Figure 62: Asia Cloud Monitoring Industry Volume Share (%), by Country 2024 & 2032
- Figure 63: Latin America Cloud Monitoring Industry Revenue (Million), by Model 2024 & 2032
- Figure 64: Latin America Cloud Monitoring Industry Volume (K Unit), by Model 2024 & 2032
- Figure 65: Latin America Cloud Monitoring Industry Revenue Share (%), by Model 2024 & 2032
- Figure 66: Latin America Cloud Monitoring Industry Volume Share (%), by Model 2024 & 2032
- Figure 67: Latin America Cloud Monitoring Industry Revenue (Million), by End-User Industry 2024 & 2032
- Figure 68: Latin America Cloud Monitoring Industry Volume (K Unit), by End-User Industry 2024 & 2032
- Figure 69: Latin America Cloud Monitoring Industry Revenue Share (%), by End-User Industry 2024 & 2032
- Figure 70: Latin America Cloud Monitoring Industry Volume Share (%), by End-User Industry 2024 & 2032
- Figure 71: Latin America Cloud Monitoring Industry Revenue (Million), by Country 2024 & 2032
- Figure 72: Latin America Cloud Monitoring Industry Volume (K Unit), by Country 2024 & 2032
- Figure 73: Latin America Cloud Monitoring Industry Revenue Share (%), by Country 2024 & 2032
- Figure 74: Latin America Cloud Monitoring Industry Volume Share (%), by Country 2024 & 2032
- Figure 75: Middle East and Africa Cloud Monitoring Industry Revenue (Million), by Model 2024 & 2032
- Figure 76: Middle East and Africa Cloud Monitoring Industry Volume (K Unit), by Model 2024 & 2032
- Figure 77: Middle East and Africa Cloud Monitoring Industry Revenue Share (%), by Model 2024 & 2032
- Figure 78: Middle East and Africa Cloud Monitoring Industry Volume Share (%), by Model 2024 & 2032
- Figure 79: Middle East and Africa Cloud Monitoring Industry Revenue (Million), by End-User Industry 2024 & 2032
- Figure 80: Middle East and Africa Cloud Monitoring Industry Volume (K Unit), by End-User Industry 2024 & 2032
- Figure 81: Middle East and Africa Cloud Monitoring Industry Revenue Share (%), by End-User Industry 2024 & 2032
- Figure 82: Middle East and Africa Cloud Monitoring Industry Volume Share (%), by End-User Industry 2024 & 2032
- Figure 83: Middle East and Africa Cloud Monitoring Industry Revenue (Million), by Country 2024 & 2032
- Figure 84: Middle East and Africa Cloud Monitoring Industry Volume (K Unit), by Country 2024 & 2032
- Figure 85: Middle East and Africa Cloud Monitoring Industry Revenue Share (%), by Country 2024 & 2032
- Figure 86: Middle East and Africa Cloud Monitoring Industry Volume Share (%), by Country 2024 & 2032
List of Tables
- Table 1: Global Cloud Monitoring Industry Revenue Million Forecast, by Region 2019 & 2032
- Table 2: Global Cloud Monitoring Industry Volume K Unit Forecast, by Region 2019 & 2032
- Table 3: Global Cloud Monitoring Industry Revenue Million Forecast, by Model 2019 & 2032
- Table 4: Global Cloud Monitoring Industry Volume K Unit Forecast, by Model 2019 & 2032
- Table 5: Global Cloud Monitoring Industry Revenue Million Forecast, by End-User Industry 2019 & 2032
- Table 6: Global Cloud Monitoring Industry Volume K Unit Forecast, by End-User Industry 2019 & 2032
- Table 7: Global Cloud Monitoring Industry Revenue Million Forecast, by Region 2019 & 2032
- Table 8: Global Cloud Monitoring Industry Volume K Unit Forecast, by Region 2019 & 2032
- Table 9: Global Cloud Monitoring Industry Revenue Million Forecast, by Country 2019 & 2032
- Table 10: Global Cloud Monitoring Industry Volume K Unit Forecast, by Country 2019 & 2032
- Table 11: United States Cloud Monitoring Industry Revenue (Million) Forecast, by Application 2019 & 2032
- Table 12: United States Cloud Monitoring Industry Volume (K Unit) Forecast, by Application 2019 & 2032
- Table 13: Canada Cloud Monitoring Industry Revenue (Million) Forecast, by Application 2019 & 2032
- Table 14: Canada Cloud Monitoring Industry Volume (K Unit) Forecast, by Application 2019 & 2032
- Table 15: Mexico Cloud Monitoring Industry Revenue (Million) Forecast, by Application 2019 & 2032
- Table 16: Mexico Cloud Monitoring Industry Volume (K Unit) Forecast, by Application 2019 & 2032
- Table 17: Global Cloud Monitoring Industry Revenue Million Forecast, by Country 2019 & 2032
- Table 18: Global Cloud Monitoring Industry Volume K Unit Forecast, by Country 2019 & 2032
- Table 19: Germany Cloud Monitoring Industry Revenue (Million) Forecast, by Application 2019 & 2032
- Table 20: Germany Cloud Monitoring Industry Volume (K Unit) Forecast, by Application 2019 & 2032
- Table 21: United Kingdom Cloud Monitoring Industry Revenue (Million) Forecast, by Application 2019 & 2032
- Table 22: United Kingdom Cloud Monitoring Industry Volume (K Unit) Forecast, by Application 2019 & 2032
- Table 23: France Cloud Monitoring Industry Revenue (Million) Forecast, by Application 2019 & 2032
- Table 24: France Cloud Monitoring Industry Volume (K Unit) Forecast, by Application 2019 & 2032
- Table 25: Spain Cloud Monitoring Industry Revenue (Million) Forecast, by Application 2019 & 2032
- Table 26: Spain Cloud Monitoring Industry Volume (K Unit) Forecast, by Application 2019 & 2032
- Table 27: Italy Cloud Monitoring Industry Revenue (Million) Forecast, by Application 2019 & 2032
- Table 28: Italy Cloud Monitoring Industry Volume (K Unit) Forecast, by Application 2019 & 2032
- Table 29: Spain Cloud Monitoring Industry Revenue (Million) Forecast, by Application 2019 & 2032
- Table 30: Spain Cloud Monitoring Industry Volume (K Unit) Forecast, by Application 2019 & 2032
- Table 31: Belgium Cloud Monitoring Industry Revenue (Million) Forecast, by Application 2019 & 2032
- Table 32: Belgium Cloud Monitoring Industry Volume (K Unit) Forecast, by Application 2019 & 2032
- Table 33: Netherland Cloud Monitoring Industry Revenue (Million) Forecast, by Application 2019 & 2032
- Table 34: Netherland Cloud Monitoring Industry Volume (K Unit) Forecast, by Application 2019 & 2032
- Table 35: Nordics Cloud Monitoring Industry Revenue (Million) Forecast, by Application 2019 & 2032
- Table 36: Nordics Cloud Monitoring Industry Volume (K Unit) Forecast, by Application 2019 & 2032
- Table 37: Rest of Europe Cloud Monitoring Industry Revenue (Million) Forecast, by Application 2019 & 2032
- Table 38: Rest of Europe Cloud Monitoring Industry Volume (K Unit) Forecast, by Application 2019 & 2032
- Table 39: Global Cloud Monitoring Industry Revenue Million Forecast, by Country 2019 & 2032
- Table 40: Global Cloud Monitoring Industry Volume K Unit Forecast, by Country 2019 & 2032
- Table 41: China Cloud Monitoring Industry Revenue (Million) Forecast, by Application 2019 & 2032
- Table 42: China Cloud Monitoring Industry Volume (K Unit) Forecast, by Application 2019 & 2032
- Table 43: Japan Cloud Monitoring Industry Revenue (Million) Forecast, by Application 2019 & 2032
- Table 44: Japan Cloud Monitoring Industry Volume (K Unit) Forecast, by Application 2019 & 2032
- Table 45: India Cloud Monitoring Industry Revenue (Million) Forecast, by Application 2019 & 2032
- Table 46: India Cloud Monitoring Industry Volume (K Unit) Forecast, by Application 2019 & 2032
- Table 47: South Korea Cloud Monitoring Industry Revenue (Million) Forecast, by Application 2019 & 2032
- Table 48: South Korea Cloud Monitoring Industry Volume (K Unit) Forecast, by Application 2019 & 2032
- Table 49: Southeast Asia Cloud Monitoring Industry Revenue (Million) Forecast, by Application 2019 & 2032
- Table 50: Southeast Asia Cloud Monitoring Industry Volume (K Unit) Forecast, by Application 2019 & 2032
- Table 51: Australia Cloud Monitoring Industry Revenue (Million) Forecast, by Application 2019 & 2032
- Table 52: Australia Cloud Monitoring Industry Volume (K Unit) Forecast, by Application 2019 & 2032
- Table 53: Indonesia Cloud Monitoring Industry Revenue (Million) Forecast, by Application 2019 & 2032
- Table 54: Indonesia Cloud Monitoring Industry Volume (K Unit) Forecast, by Application 2019 & 2032
- Table 55: Phillipes Cloud Monitoring Industry Revenue (Million) Forecast, by Application 2019 & 2032
- Table 56: Phillipes Cloud Monitoring Industry Volume (K Unit) Forecast, by Application 2019 & 2032
- Table 57: Singapore Cloud Monitoring Industry Revenue (Million) Forecast, by Application 2019 & 2032
- Table 58: Singapore Cloud Monitoring Industry Volume (K Unit) Forecast, by Application 2019 & 2032
- Table 59: Thailandc Cloud Monitoring Industry Revenue (Million) Forecast, by Application 2019 & 2032
- Table 60: Thailandc Cloud Monitoring Industry Volume (K Unit) Forecast, by Application 2019 & 2032
- Table 61: Rest of Asia Pacific Cloud Monitoring Industry Revenue (Million) Forecast, by Application 2019 & 2032
- Table 62: Rest of Asia Pacific Cloud Monitoring Industry Volume (K Unit) Forecast, by Application 2019 & 2032
- Table 63: Global Cloud Monitoring Industry Revenue Million Forecast, by Country 2019 & 2032
- Table 64: Global Cloud Monitoring Industry Volume K Unit Forecast, by Country 2019 & 2032
- Table 65: Brazil Cloud Monitoring Industry Revenue (Million) Forecast, by Application 2019 & 2032
- Table 66: Brazil Cloud Monitoring Industry Volume (K Unit) Forecast, by Application 2019 & 2032
- Table 67: Argentina Cloud Monitoring Industry Revenue (Million) Forecast, by Application 2019 & 2032
- Table 68: Argentina Cloud Monitoring Industry Volume (K Unit) Forecast, by Application 2019 & 2032
- Table 69: Peru Cloud Monitoring Industry Revenue (Million) Forecast, by Application 2019 & 2032
- Table 70: Peru Cloud Monitoring Industry Volume (K Unit) Forecast, by Application 2019 & 2032
- Table 71: Chile Cloud Monitoring Industry Revenue (Million) Forecast, by Application 2019 & 2032
- Table 72: Chile Cloud Monitoring Industry Volume (K Unit) Forecast, by Application 2019 & 2032
- Table 73: Colombia Cloud Monitoring Industry Revenue (Million) Forecast, by Application 2019 & 2032
- Table 74: Colombia Cloud Monitoring Industry Volume (K Unit) Forecast, by Application 2019 & 2032
- Table 75: Ecuador Cloud Monitoring Industry Revenue (Million) Forecast, by Application 2019 & 2032
- Table 76: Ecuador Cloud Monitoring Industry Volume (K Unit) Forecast, by Application 2019 & 2032
- Table 77: Venezuela Cloud Monitoring Industry Revenue (Million) Forecast, by Application 2019 & 2032
- Table 78: Venezuela Cloud Monitoring Industry Volume (K Unit) Forecast, by Application 2019 & 2032
- Table 79: Rest of South America Cloud Monitoring Industry Revenue (Million) Forecast, by Application 2019 & 2032
- Table 80: Rest of South America Cloud Monitoring Industry Volume (K Unit) Forecast, by Application 2019 & 2032
- Table 81: Global Cloud Monitoring Industry Revenue Million Forecast, by Country 2019 & 2032
- Table 82: Global Cloud Monitoring Industry Volume K Unit Forecast, by Country 2019 & 2032
- Table 83: United States Cloud Monitoring Industry Revenue (Million) Forecast, by Application 2019 & 2032
- Table 84: United States Cloud Monitoring Industry Volume (K Unit) Forecast, by Application 2019 & 2032
- Table 85: Canada Cloud Monitoring Industry Revenue (Million) Forecast, by Application 2019 & 2032
- Table 86: Canada Cloud Monitoring Industry Volume (K Unit) Forecast, by Application 2019 & 2032
- Table 87: Mexico Cloud Monitoring Industry Revenue (Million) Forecast, by Application 2019 & 2032
- Table 88: Mexico Cloud Monitoring Industry Volume (K Unit) Forecast, by Application 2019 & 2032
- Table 89: Global Cloud Monitoring Industry Revenue Million Forecast, by Country 2019 & 2032
- Table 90: Global Cloud Monitoring Industry Volume K Unit Forecast, by Country 2019 & 2032
- Table 91: United Arab Emirates Cloud Monitoring Industry Revenue (Million) Forecast, by Application 2019 & 2032
- Table 92: United Arab Emirates Cloud Monitoring Industry Volume (K Unit) Forecast, by Application 2019 & 2032
- Table 93: Saudi Arabia Cloud Monitoring Industry Revenue (Million) Forecast, by Application 2019 & 2032
- Table 94: Saudi Arabia Cloud Monitoring Industry Volume (K Unit) Forecast, by Application 2019 & 2032
- Table 95: South Africa Cloud Monitoring Industry Revenue (Million) Forecast, by Application 2019 & 2032
- Table 96: South Africa Cloud Monitoring Industry Volume (K Unit) Forecast, by Application 2019 & 2032
- Table 97: Rest of Middle East and Africa Cloud Monitoring Industry Revenue (Million) Forecast, by Application 2019 & 2032
- Table 98: Rest of Middle East and Africa Cloud Monitoring Industry Volume (K Unit) Forecast, by Application 2019 & 2032
- Table 99: Global Cloud Monitoring Industry Revenue Million Forecast, by Model 2019 & 2032
- Table 100: Global Cloud Monitoring Industry Volume K Unit Forecast, by Model 2019 & 2032
- Table 101: Global Cloud Monitoring Industry Revenue Million Forecast, by End-User Industry 2019 & 2032
- Table 102: Global Cloud Monitoring Industry Volume K Unit Forecast, by End-User Industry 2019 & 2032
- Table 103: Global Cloud Monitoring Industry Revenue Million Forecast, by Country 2019 & 2032
- Table 104: Global Cloud Monitoring Industry Volume K Unit Forecast, by Country 2019 & 2032
- Table 105: United States Cloud Monitoring Industry Revenue (Million) Forecast, by Application 2019 & 2032
- Table 106: United States Cloud Monitoring Industry Volume (K Unit) Forecast, by Application 2019 & 2032
- Table 107: Canada Cloud Monitoring Industry Revenue (Million) Forecast, by Application 2019 & 2032
- Table 108: Canada Cloud Monitoring Industry Volume (K Unit) Forecast, by Application 2019 & 2032
- Table 109: Global Cloud Monitoring Industry Revenue Million Forecast, by Model 2019 & 2032
- Table 110: Global Cloud Monitoring Industry Volume K Unit Forecast, by Model 2019 & 2032
- Table 111: Global Cloud Monitoring Industry Revenue Million Forecast, by End-User Industry 2019 & 2032
- Table 112: Global Cloud Monitoring Industry Volume K Unit Forecast, by End-User Industry 2019 & 2032
- Table 113: Global Cloud Monitoring Industry Revenue Million Forecast, by Country 2019 & 2032
- Table 114: Global Cloud Monitoring Industry Volume K Unit Forecast, by Country 2019 & 2032
- Table 115: United Kingdom Cloud Monitoring Industry Revenue (Million) Forecast, by Application 2019 & 2032
- Table 116: United Kingdom Cloud Monitoring Industry Volume (K Unit) Forecast, by Application 2019 & 2032
- Table 117: Germany Cloud Monitoring Industry Revenue (Million) Forecast, by Application 2019 & 2032
- Table 118: Germany Cloud Monitoring Industry Volume (K Unit) Forecast, by Application 2019 & 2032
- Table 119: France Cloud Monitoring Industry Revenue (Million) Forecast, by Application 2019 & 2032
- Table 120: France Cloud Monitoring Industry Volume (K Unit) Forecast, by Application 2019 & 2032
- Table 121: Spain Cloud Monitoring Industry Revenue (Million) Forecast, by Application 2019 & 2032
- Table 122: Spain Cloud Monitoring Industry Volume (K Unit) Forecast, by Application 2019 & 2032
- Table 123: Global Cloud Monitoring Industry Revenue Million Forecast, by Model 2019 & 2032
- Table 124: Global Cloud Monitoring Industry Volume K Unit Forecast, by Model 2019 & 2032
- Table 125: Global Cloud Monitoring Industry Revenue Million Forecast, by End-User Industry 2019 & 2032
- Table 126: Global Cloud Monitoring Industry Volume K Unit Forecast, by End-User Industry 2019 & 2032
- Table 127: Global Cloud Monitoring Industry Revenue Million Forecast, by Country 2019 & 2032
- Table 128: Global Cloud Monitoring Industry Volume K Unit Forecast, by Country 2019 & 2032
- Table 129: China Cloud Monitoring Industry Revenue (Million) Forecast, by Application 2019 & 2032
- Table 130: China Cloud Monitoring Industry Volume (K Unit) Forecast, by Application 2019 & 2032
- Table 131: Japan Cloud Monitoring Industry Revenue (Million) Forecast, by Application 2019 & 2032
- Table 132: Japan Cloud Monitoring Industry Volume (K Unit) Forecast, by Application 2019 & 2032
- Table 133: Singapore Cloud Monitoring Industry Revenue (Million) Forecast, by Application 2019 & 2032
- Table 134: Singapore Cloud Monitoring Industry Volume (K Unit) Forecast, by Application 2019 & 2032
- Table 135: Australia and New Zealand Cloud Monitoring Industry Revenue (Million) Forecast, by Application 2019 & 2032
- Table 136: Australia and New Zealand Cloud Monitoring Industry Volume (K Unit) Forecast, by Application 2019 & 2032
- Table 137: Global Cloud Monitoring Industry Revenue Million Forecast, by Model 2019 & 2032
- Table 138: Global Cloud Monitoring Industry Volume K Unit Forecast, by Model 2019 & 2032
- Table 139: Global Cloud Monitoring Industry Revenue Million Forecast, by End-User Industry 2019 & 2032
- Table 140: Global Cloud Monitoring Industry Volume K Unit Forecast, by End-User Industry 2019 & 2032
- Table 141: Global Cloud Monitoring Industry Revenue Million Forecast, by Country 2019 & 2032
- Table 142: Global Cloud Monitoring Industry Volume K Unit Forecast, by Country 2019 & 2032
- Table 143: Mexico Cloud Monitoring Industry Revenue (Million) Forecast, by Application 2019 & 2032
- Table 144: Mexico Cloud Monitoring Industry Volume (K Unit) Forecast, by Application 2019 & 2032
- Table 145: Brazil Cloud Monitoring Industry Revenue (Million) Forecast, by Application 2019 & 2032
- Table 146: Brazil Cloud Monitoring Industry Volume (K Unit) Forecast, by Application 2019 & 2032
- Table 147: Global Cloud Monitoring Industry Revenue Million Forecast, by Model 2019 & 2032
- Table 148: Global Cloud Monitoring Industry Volume K Unit Forecast, by Model 2019 & 2032
- Table 149: Global Cloud Monitoring Industry Revenue Million Forecast, by End-User Industry 2019 & 2032
- Table 150: Global Cloud Monitoring Industry Volume K Unit Forecast, by End-User Industry 2019 & 2032
- Table 151: Global Cloud Monitoring Industry Revenue Million Forecast, by Country 2019 & 2032
- Table 152: Global Cloud Monitoring Industry Volume K Unit Forecast, by Country 2019 & 2032
- Table 153: United Arab Emirates Cloud Monitoring Industry Revenue (Million) Forecast, by Application 2019 & 2032
- Table 154: United Arab Emirates Cloud Monitoring Industry Volume (K Unit) Forecast, by Application 2019 & 2032
- Table 155: Saudi Arabia Cloud Monitoring Industry Revenue (Million) Forecast, by Application 2019 & 2032
- Table 156: Saudi Arabia Cloud Monitoring Industry Volume (K Unit) Forecast, by Application 2019 & 2032
Frequently Asked Questions
1. What is the projected Compound Annual Growth Rate (CAGR) of the Cloud Monitoring Industry?
The projected CAGR is approximately 19.91%.
2. Which companies are prominent players in the Cloud Monitoring Industry?
Key companies in the market include IDERA Inc, IBM Corporation, Zenoss Inc , Broadcom Inc (CA Technologies), Datadog Inc, Microsoft Corporation, Oracle Corporation, AWS, LogicMonitor Inc.
3. What are the main segments of the Cloud Monitoring Industry?
The market segments include Model, End-User Industry.
4. Can you provide details about the market size?
The market size is estimated to be USD 3.13 Million as of 2022.
5. What are some drivers contributing to market growth?
Growth in Cloud Adoption Across End Users; Rising Need for Efficiently Managing the Performance and Security of Cloud Platforms.
6. What are the notable trends driving market growth?
Growth in Cloud Adoption Across End Users is Expected to Drive the Market Growth.
7. Are there any restraints impacting market growth?
Diminishing Profit Margins and Ongoing Changes in Macro-environment.
8. Can you provide examples of recent developments in the market?
April 2023: Sumo Logic, a software-as-a-service (SaaS) analytics platform enabling dependable and secure cloud-native applications, announced that it had earned the Amazon Web Services (AWS) cloud operations competency in monitoring and observability. Sumo Logic has proven competence in assisting customers in establishing a robust and scalable foundation for end-to-end cloud operations as an AWS cloud operations competency partner.
9. What pricing options are available for accessing the report?
Pricing options include single-user, multi-user, and enterprise licenses priced at USD 4750, USD 5250, and USD 8750 respectively.
10. Is the market size provided in terms of value or volume?
The market size is provided in terms of value, measured in Million and volume, measured in K Unit.
11. Are there any specific market keywords associated with the report?
Yes, the market keyword associated with the report is "Cloud Monitoring Industry," which aids in identifying and referencing the specific market segment covered.
12. How do I determine which pricing option suits my needs best?
The pricing options vary based on user requirements and access needs. Individual users may opt for single-user licenses, while businesses requiring broader access may choose multi-user or enterprise licenses for cost-effective access to the report.
13. Are there any additional resources or data provided in the Cloud Monitoring Industry report?
While the report offers comprehensive insights, it's advisable to review the specific contents or supplementary materials provided to ascertain if additional resources or data are available.
14. How can I stay updated on further developments or reports in the Cloud Monitoring Industry?
To stay informed about further developments, trends, and reports in the Cloud Monitoring Industry, consider subscribing to industry newsletters, following relevant companies and organizations, or regularly checking reputable industry news sources and publications.
Methodology
Step 1 - Identification of Relevant Samples Size from Population Database


Step 2 - Approaches for Defining Global Market Size (Value, Volume* & Price*)

Note*: In applicable scenarios
Step 3 - Data Sources
Primary Research
- Web Analytics
- Survey Reports
- Research Institute
- Latest Research Reports
- Opinion Leaders
Secondary Research
- Annual Reports
- White Paper
- Latest Press Release
- Industry Association
- Paid Database
- Investor Presentations

Step 4 - Data Triangulation
Involves using different sources of information in order to increase the validity of a study
These sources are likely to be stakeholders in a program - participants, other researchers, program staff, other community members, and so on.
Then we put all data in single framework & apply various statistical tools to find out the dynamic on the market.
During the analysis stage, feedback from the stakeholder groups would be compared to determine areas of agreement as well as areas of divergence
