

Key Insights
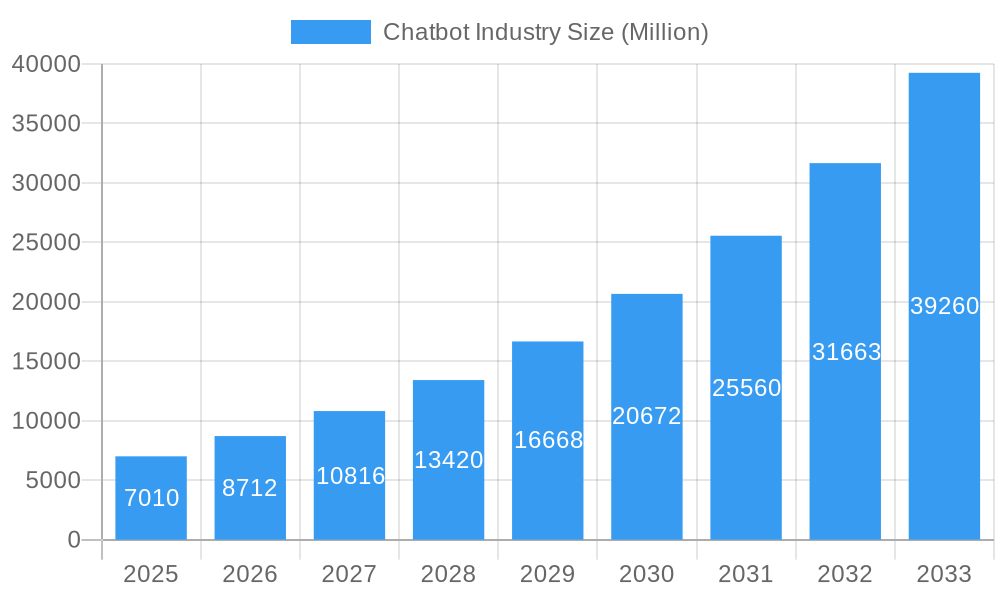
The global chatbot market is experiencing robust growth, projected to reach a value of $7.01 billion in 2025 and exhibiting a remarkable Compound Annual Growth Rate (CAGR) of 24.32% from 2025 to 2033. This expansion is fueled by several key drivers. Increasing customer demand for 24/7 support and instant service resolution is a major factor, alongside the growing adoption of omnichannel strategies by businesses to improve customer engagement and streamline operations. Automation of routine tasks, resulting in reduced operational costs and increased efficiency, further incentivizes chatbot implementation across various industries. Advancements in Natural Language Processing (NLP) and Artificial Intelligence (AI) are enhancing chatbot capabilities, enabling them to handle complex queries and provide more personalized interactions, further driving market growth. The BFSI (Banking, Financial Services, and Insurance), healthcare, and IT & telecommunication sectors are currently leading adopters, leveraging chatbots for customer service, lead generation, and internal process automation. However, the market faces challenges such as concerns about data security and privacy, and the need for continuous improvement in chatbot accuracy and understanding of nuanced human language. Despite these limitations, the overall trend suggests significant market expansion across all major regions, particularly North America and Asia Pacific, reflecting the increasing digitalization and technological adoption globally.
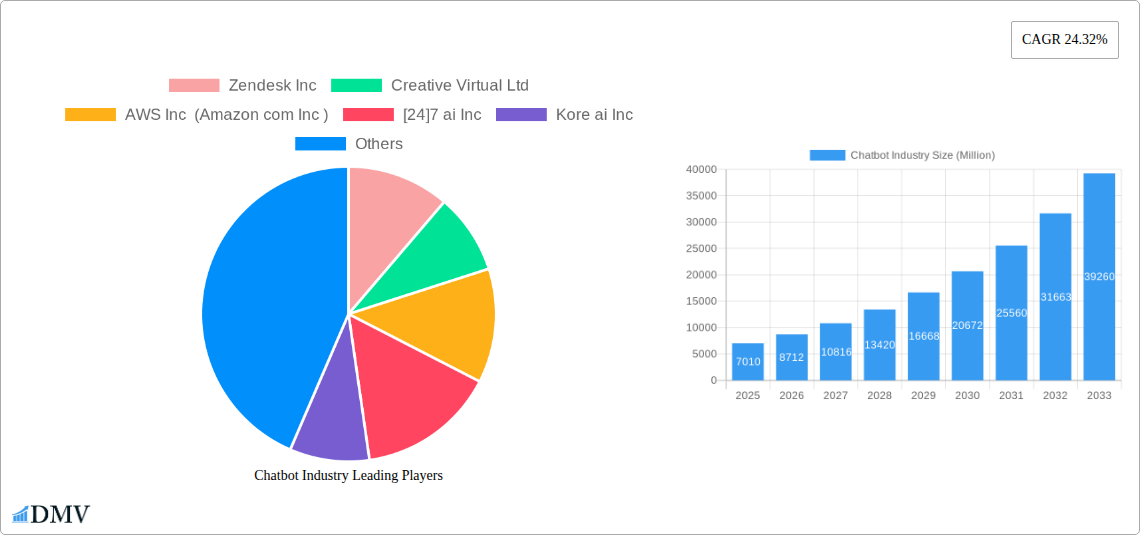
Chatbot Industry Market Size (In Billion)
The competitive landscape is dynamic, with a mix of established technology giants like Amazon (AWS), Microsoft (Nuance), Google (Dialogflow), and IBM, alongside specialized chatbot providers such as Zendesk, Creative Virtual, and Kore.ai. These companies are constantly innovating to offer advanced features such as sentiment analysis, proactive engagement, and seamless integration with existing CRM and business applications. The market's future growth trajectory will likely depend on ongoing advancements in AI and NLP, increased emphasis on robust security measures, and the successful addressing of customer concerns about privacy and data protection. Furthermore, the successful integration of chatbots into broader business strategies and the development of more sophisticated, human-like conversational interfaces will significantly influence market penetration and expansion across diverse industry verticals. The continuous evolution of chatbot technology, driven by competition and technological advancements, positions this market for sustained and substantial growth in the coming years.
Chatbot Industry Company Market Share
Chatbot Industry Market Report: 2019-2033 Forecast
This comprehensive report provides an in-depth analysis of the Chatbot Industry, projecting a market value exceeding $XX Million by 2033. The study period covers 2019-2033, with 2025 as the base and estimated year. This report is invaluable for stakeholders seeking to understand market dynamics, technological advancements, and future growth potential in this rapidly evolving sector.
Chatbot Industry Market Composition & Trends
The global chatbot market, valued at $XX Million in 2025, is characterized by a moderately concentrated landscape with several key players vying for market share. Innovation is driven by advancements in Natural Language Processing (NLP), Machine Learning (ML), and Artificial Intelligence (AI), leading to more sophisticated and human-like chatbot interactions. The regulatory environment varies across geographies, impacting data privacy and security compliance. Substitute products, such as traditional customer service models, face increasing pressure from the efficiency and cost-effectiveness of chatbots. Mergers and Acquisitions (M&A) activity is significant, with deal values exceeding $XX Million in recent years, reflecting the industry's consolidation trend.
- Market Share Distribution (2025): Zendesk Inc. (XX%), AWS Inc. (XX%), [24]7 ai Inc. (XX%), Other players (XX%). (Note: Exact percentages unavailable, approximations provided)
- M&A Activity (2019-2024): Total deal value exceeding $XX Million, with a noticeable increase in activity during the past two years.
- End-User Profiles: Diverse range including enterprises, small and medium businesses (SMBs), and consumers across various sectors.
- Innovation Catalysts: NLP advancements, improved AI models, integration with CRM systems, increasing data availability.
Chatbot Industry Industry Evolution
The chatbot industry has experienced remarkable growth from 2019 to 2024, driven by technological progress and a changing consumer landscape. Adoption rates have accelerated significantly, particularly in industries like BFSI and healthcare, where automation is improving operational efficiency and reducing costs. Growth rates (CAGR) are estimated to be XX% during the forecast period (2025-2033), reflecting the increasing demand for automated customer service and personalized interactions. Market penetration is still relatively low, suggesting considerable untapped potential for future growth. Advancements in conversational AI, such as the incorporation of GPT-powered functionalities, are pushing the boundaries of chatbot capabilities, enhancing contextual understanding and generating more human-like responses. Consumers are demanding faster, more convenient, and personalized service, making chatbots an increasingly attractive solution for businesses. The trend toward omnichannel integration, allowing seamless communication across various platforms, is also driving adoption.
Leading Regions, Countries, or Segments in Chatbot Industry
The North American market currently holds a dominant position in the chatbot industry, driven by high technology adoption rates, substantial investments in AI, and a robust regulatory framework. However, the Asia-Pacific region is experiencing rapid growth due to increasing smartphone penetration, a large and expanding digital population, and favorable government policies.
- Key Drivers in North America: High levels of venture capital investments, advanced AI infrastructure, early adoption by large enterprises.
- Key Drivers in Asia-Pacific: Rapidly expanding digital economy, substantial government investment in technology development, high mobile penetration rates.
- Dominant End-User Vertical: The BFSI (Banking, Financial Services, and Insurance) sector is currently the dominant end-user vertical, owing to its high reliance on customer service and operational efficiency. However, strong growth is anticipated in healthcare and retail sectors. The IT and telecommunication sector is also a significant adopter of chatbot technology for automation of various tasks and providing 24/7 support to consumers.
Chatbot Industry Product Innovations
Recent product innovations include the integration of advanced NLP models, enabling more natural and nuanced conversations. Enhanced sentiment analysis and emotion recognition capabilities are improving chatbot understanding of user intent and emotional state. The incorporation of GPT-powered functionalities, as demonstrated by Nuance's Mix Answers, is significantly expanding the capabilities of chatbot solutions. These advancements enable chatbots to handle more complex tasks, personalize interactions, and provide more efficient and effective customer service.
Propelling Factors for Chatbot Industry Growth
Several factors are driving the growth of the chatbot industry. Technological advancements in AI and NLP are enabling chatbots to become more sophisticated and capable. The rising demand for cost-effective and efficient customer service solutions is further fueling market growth. Favorable regulatory frameworks in certain regions are promoting the adoption of chatbot technology, and the increasing digitalization of businesses is creating new opportunities for chatbot deployment.
Obstacles in the Chatbot Industry Market
Despite its rapid growth, the chatbot industry faces several challenges. Regulatory hurdles around data privacy and security can impede wider adoption. Supply chain disruptions can impact the availability of essential components, slowing down innovation and market expansion. Intense competition among numerous vendors, both large and small, puts pressure on pricing and profitability. These factors can affect market growth and overall revenue.
Future Opportunities in Chatbot Industry
Significant opportunities exist for the chatbot industry in emerging markets with high mobile penetration and increasing internet usage. Advancements in AI and machine learning will unlock new applications, particularly in personalized education, healthcare, and other sectors requiring nuanced human-like interaction. The convergence of chatbots with other technologies, such as IoT and metaverse, will create entirely new market spaces and opportunities.
Major Players in the Chatbot Industry Ecosystem
- Zendesk Inc
- Creative Virtual Ltd
- AWS Inc (Amazon com Inc)
- [24]7 ai Inc
- Kore ai Inc
- LiveChat Inc
- IBM Corporation
- Nuance Communications Inc (Microsoft Corp)
- Artificial Solutions International AB
- Inbenta Holdings Inc
- Avaamo Inc
- Amelia US LLC (Ipsoft Inc)
- Egain Corporation
- Serviceaide Inc
- Dialogflow (Google)
- EdgeVerve Systems Limited
Key Developments in Chatbot Industry Industry
- March 2023: Nuance launched Nuance Mix Answers with GPT-powered functionality for its call center AI solutions, enhancing Microsoft's Power Virtual Agents.
- April 2023: Kore.ai integrated its conversational AgentAssist with automated intelligent virtual assistant (IVA) support for Zendesk Inc., enhancing Zendesk Support across digital channels.
Strategic Chatbot Industry Market Forecast
The chatbot industry is poised for continued strong growth, driven by ongoing technological advancements and increasing demand for efficient and personalized customer service. Emerging applications and expansion into new markets will further fuel market expansion, leading to significant revenue growth in the coming years, with a projected market size of $XX Million by 2033. The focus on enhanced AI capabilities, seamless omnichannel integration, and robust security features will be critical for companies to succeed in this dynamic and competitive market.
Chatbot Industry Segmentation
-
1. End-user Vertical
- 1.1. BFSI
- 1.2. Healthcare
- 1.3. IT and Telecommunication
- 1.4. Retail
- 1.5. Travel and Hospitality
- 1.6. Other End-user Verticals
Chatbot Industry Segmentation By Geography
- 1. North America
- 2. Europe
- 3. Asia
- 4. Australia and New Zealand
- 5. Latin America
- 6. Middle East and Africa
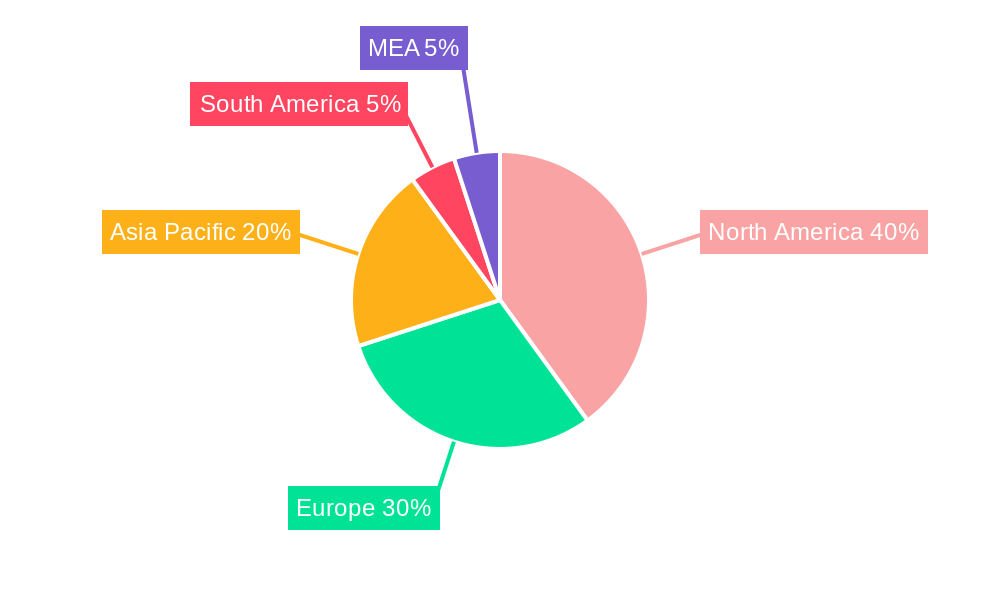
Chatbot Industry Regional Market Share
Geographic Coverage of Chatbot Industry
Chatbot Industry REPORT HIGHLIGHTS
| Aspects | Details |
|---|---|
| Study Period | 2020-2034 |
| Base Year | 2025 |
| Estimated Year | 2026 |
| Forecast Period | 2026-2034 |
| Historical Period | 2020-2025 |
| Growth Rate | CAGR of 24.32% from 2020-2034 |
| Segmentation |
|
Table of Contents
- 1. Introduction
- 1.1. Research Scope
- 1.2. Market Segmentation
- 1.3. Research Methodology
- 1.4. Definitions and Assumptions
- 2. Executive Summary
- 2.1. Introduction
- 3. Market Dynamics
- 3.1. Introduction
- 3.2. Market Drivers
- 3.2.1. Rising Domination of Messenger Applications; Increasing Demand for Consumer Analytics
- 3.3. Market Restrains
- 3.3.1. Integration Complexities and Data Concerns
- 3.4. Market Trends
- 3.4.1. Retail to Have Significant Growth
- 4. Market Factor Analysis
- 4.1. Porters Five Forces
- 4.2. Supply/Value Chain
- 4.3. PESTEL analysis
- 4.4. Market Entropy
- 4.5. Patent/Trademark Analysis
- 5. Global Chatbot Industry Analysis, Insights and Forecast, 2020-2032
- 5.1. Market Analysis, Insights and Forecast - by End-user Vertical
- 5.1.1. BFSI
- 5.1.2. Healthcare
- 5.1.3. IT and Telecommunication
- 5.1.4. Retail
- 5.1.5. Travel and Hospitality
- 5.1.6. Other End-user Verticals
- 5.2. Market Analysis, Insights and Forecast - by Region
- 5.2.1. North America
- 5.2.2. Europe
- 5.2.3. Asia
- 5.2.4. Australia and New Zealand
- 5.2.5. Latin America
- 5.2.6. Middle East and Africa
- 5.1. Market Analysis, Insights and Forecast - by End-user Vertical
- 6. North America Chatbot Industry Analysis, Insights and Forecast, 2020-2032
- 6.1. Market Analysis, Insights and Forecast - by End-user Vertical
- 6.1.1. BFSI
- 6.1.2. Healthcare
- 6.1.3. IT and Telecommunication
- 6.1.4. Retail
- 6.1.5. Travel and Hospitality
- 6.1.6. Other End-user Verticals
- 6.1. Market Analysis, Insights and Forecast - by End-user Vertical
- 7. Europe Chatbot Industry Analysis, Insights and Forecast, 2020-2032
- 7.1. Market Analysis, Insights and Forecast - by End-user Vertical
- 7.1.1. BFSI
- 7.1.2. Healthcare
- 7.1.3. IT and Telecommunication
- 7.1.4. Retail
- 7.1.5. Travel and Hospitality
- 7.1.6. Other End-user Verticals
- 7.1. Market Analysis, Insights and Forecast - by End-user Vertical
- 8. Asia Chatbot Industry Analysis, Insights and Forecast, 2020-2032
- 8.1. Market Analysis, Insights and Forecast - by End-user Vertical
- 8.1.1. BFSI
- 8.1.2. Healthcare
- 8.1.3. IT and Telecommunication
- 8.1.4. Retail
- 8.1.5. Travel and Hospitality
- 8.1.6. Other End-user Verticals
- 8.1. Market Analysis, Insights and Forecast - by End-user Vertical
- 9. Australia and New Zealand Chatbot Industry Analysis, Insights and Forecast, 2020-2032
- 9.1. Market Analysis, Insights and Forecast - by End-user Vertical
- 9.1.1. BFSI
- 9.1.2. Healthcare
- 9.1.3. IT and Telecommunication
- 9.1.4. Retail
- 9.1.5. Travel and Hospitality
- 9.1.6. Other End-user Verticals
- 9.1. Market Analysis, Insights and Forecast - by End-user Vertical
- 10. Latin America Chatbot Industry Analysis, Insights and Forecast, 2020-2032
- 10.1. Market Analysis, Insights and Forecast - by End-user Vertical
- 10.1.1. BFSI
- 10.1.2. Healthcare
- 10.1.3. IT and Telecommunication
- 10.1.4. Retail
- 10.1.5. Travel and Hospitality
- 10.1.6. Other End-user Verticals
- 10.1. Market Analysis, Insights and Forecast - by End-user Vertical
- 11. Middle East and Africa Chatbot Industry Analysis, Insights and Forecast, 2020-2032
- 11.1. Market Analysis, Insights and Forecast - by End-user Vertical
- 11.1.1. BFSI
- 11.1.2. Healthcare
- 11.1.3. IT and Telecommunication
- 11.1.4. Retail
- 11.1.5. Travel and Hospitality
- 11.1.6. Other End-user Verticals
- 11.1. Market Analysis, Insights and Forecast - by End-user Vertical
- 12. Competitive Analysis
- 12.1. Global Market Share Analysis 2025
- 12.2. Company Profiles
- 12.2.1 Zendesk Inc
- 12.2.1.1. Overview
- 12.2.1.2. Products
- 12.2.1.3. SWOT Analysis
- 12.2.1.4. Recent Developments
- 12.2.1.5. Financials (Based on Availability)
- 12.2.2 Creative Virtual Ltd
- 12.2.2.1. Overview
- 12.2.2.2. Products
- 12.2.2.3. SWOT Analysis
- 12.2.2.4. Recent Developments
- 12.2.2.5. Financials (Based on Availability)
- 12.2.3 AWS Inc (Amazon com Inc )
- 12.2.3.1. Overview
- 12.2.3.2. Products
- 12.2.3.3. SWOT Analysis
- 12.2.3.4. Recent Developments
- 12.2.3.5. Financials (Based on Availability)
- 12.2.4 [24]7 ai Inc
- 12.2.4.1. Overview
- 12.2.4.2. Products
- 12.2.4.3. SWOT Analysis
- 12.2.4.4. Recent Developments
- 12.2.4.5. Financials (Based on Availability)
- 12.2.5 Kore ai Inc
- 12.2.5.1. Overview
- 12.2.5.2. Products
- 12.2.5.3. SWOT Analysis
- 12.2.5.4. Recent Developments
- 12.2.5.5. Financials (Based on Availability)
- 12.2.6 LiveChat Inc *List Not Exhaustive
- 12.2.6.1. Overview
- 12.2.6.2. Products
- 12.2.6.3. SWOT Analysis
- 12.2.6.4. Recent Developments
- 12.2.6.5. Financials (Based on Availability)
- 12.2.7 IBM Corporation
- 12.2.7.1. Overview
- 12.2.7.2. Products
- 12.2.7.3. SWOT Analysis
- 12.2.7.4. Recent Developments
- 12.2.7.5. Financials (Based on Availability)
- 12.2.8 Nuance Communications Inc (Microsoft Corp )
- 12.2.8.1. Overview
- 12.2.8.2. Products
- 12.2.8.3. SWOT Analysis
- 12.2.8.4. Recent Developments
- 12.2.8.5. Financials (Based on Availability)
- 12.2.9 Artificial Solutions International AB
- 12.2.9.1. Overview
- 12.2.9.2. Products
- 12.2.9.3. SWOT Analysis
- 12.2.9.4. Recent Developments
- 12.2.9.5. Financials (Based on Availability)
- 12.2.10 Inbenta Holdings Inc
- 12.2.10.1. Overview
- 12.2.10.2. Products
- 12.2.10.3. SWOT Analysis
- 12.2.10.4. Recent Developments
- 12.2.10.5. Financials (Based on Availability)
- 12.2.11 Avaamo Inc
- 12.2.11.1. Overview
- 12.2.11.2. Products
- 12.2.11.3. SWOT Analysis
- 12.2.11.4. Recent Developments
- 12.2.11.5. Financials (Based on Availability)
- 12.2.12 Amelia US LLC (Ipsoft Inc )
- 12.2.12.1. Overview
- 12.2.12.2. Products
- 12.2.12.3. SWOT Analysis
- 12.2.12.4. Recent Developments
- 12.2.12.5. Financials (Based on Availability)
- 12.2.13 Egain Corporation
- 12.2.13.1. Overview
- 12.2.13.2. Products
- 12.2.13.3. SWOT Analysis
- 12.2.13.4. Recent Developments
- 12.2.13.5. Financials (Based on Availability)
- 12.2.14 Serviceaide Inc
- 12.2.14.1. Overview
- 12.2.14.2. Products
- 12.2.14.3. SWOT Analysis
- 12.2.14.4. Recent Developments
- 12.2.14.5. Financials (Based on Availability)
- 12.2.15 Dialogflow (Google)
- 12.2.15.1. Overview
- 12.2.15.2. Products
- 12.2.15.3. SWOT Analysis
- 12.2.15.4. Recent Developments
- 12.2.15.5. Financials (Based on Availability)
- 12.2.16 EdgeVerve Systems Limited
- 12.2.16.1. Overview
- 12.2.16.2. Products
- 12.2.16.3. SWOT Analysis
- 12.2.16.4. Recent Developments
- 12.2.16.5. Financials (Based on Availability)
- 12.2.1 Zendesk Inc
List of Figures
- Figure 1: Global Chatbot Industry Revenue Breakdown (Million, %) by Region 2025 & 2033
- Figure 2: North America Chatbot Industry Revenue (Million), by End-user Vertical 2025 & 2033
- Figure 3: North America Chatbot Industry Revenue Share (%), by End-user Vertical 2025 & 2033
- Figure 4: North America Chatbot Industry Revenue (Million), by Country 2025 & 2033
- Figure 5: North America Chatbot Industry Revenue Share (%), by Country 2025 & 2033
- Figure 6: Europe Chatbot Industry Revenue (Million), by End-user Vertical 2025 & 2033
- Figure 7: Europe Chatbot Industry Revenue Share (%), by End-user Vertical 2025 & 2033
- Figure 8: Europe Chatbot Industry Revenue (Million), by Country 2025 & 2033
- Figure 9: Europe Chatbot Industry Revenue Share (%), by Country 2025 & 2033
- Figure 10: Asia Chatbot Industry Revenue (Million), by End-user Vertical 2025 & 2033
- Figure 11: Asia Chatbot Industry Revenue Share (%), by End-user Vertical 2025 & 2033
- Figure 12: Asia Chatbot Industry Revenue (Million), by Country 2025 & 2033
- Figure 13: Asia Chatbot Industry Revenue Share (%), by Country 2025 & 2033
- Figure 14: Australia and New Zealand Chatbot Industry Revenue (Million), by End-user Vertical 2025 & 2033
- Figure 15: Australia and New Zealand Chatbot Industry Revenue Share (%), by End-user Vertical 2025 & 2033
- Figure 16: Australia and New Zealand Chatbot Industry Revenue (Million), by Country 2025 & 2033
- Figure 17: Australia and New Zealand Chatbot Industry Revenue Share (%), by Country 2025 & 2033
- Figure 18: Latin America Chatbot Industry Revenue (Million), by End-user Vertical 2025 & 2033
- Figure 19: Latin America Chatbot Industry Revenue Share (%), by End-user Vertical 2025 & 2033
- Figure 20: Latin America Chatbot Industry Revenue (Million), by Country 2025 & 2033
- Figure 21: Latin America Chatbot Industry Revenue Share (%), by Country 2025 & 2033
- Figure 22: Middle East and Africa Chatbot Industry Revenue (Million), by End-user Vertical 2025 & 2033
- Figure 23: Middle East and Africa Chatbot Industry Revenue Share (%), by End-user Vertical 2025 & 2033
- Figure 24: Middle East and Africa Chatbot Industry Revenue (Million), by Country 2025 & 2033
- Figure 25: Middle East and Africa Chatbot Industry Revenue Share (%), by Country 2025 & 2033
List of Tables
- Table 1: Global Chatbot Industry Revenue Million Forecast, by End-user Vertical 2020 & 2033
- Table 2: Global Chatbot Industry Revenue Million Forecast, by Region 2020 & 2033
- Table 3: Global Chatbot Industry Revenue Million Forecast, by End-user Vertical 2020 & 2033
- Table 4: Global Chatbot Industry Revenue Million Forecast, by Country 2020 & 2033
- Table 5: Global Chatbot Industry Revenue Million Forecast, by End-user Vertical 2020 & 2033
- Table 6: Global Chatbot Industry Revenue Million Forecast, by Country 2020 & 2033
- Table 7: Global Chatbot Industry Revenue Million Forecast, by End-user Vertical 2020 & 2033
- Table 8: Global Chatbot Industry Revenue Million Forecast, by Country 2020 & 2033
- Table 9: Global Chatbot Industry Revenue Million Forecast, by End-user Vertical 2020 & 2033
- Table 10: Global Chatbot Industry Revenue Million Forecast, by Country 2020 & 2033
- Table 11: Global Chatbot Industry Revenue Million Forecast, by End-user Vertical 2020 & 2033
- Table 12: Global Chatbot Industry Revenue Million Forecast, by Country 2020 & 2033
- Table 13: Global Chatbot Industry Revenue Million Forecast, by End-user Vertical 2020 & 2033
- Table 14: Global Chatbot Industry Revenue Million Forecast, by Country 2020 & 2033
Frequently Asked Questions
1. What is the projected Compound Annual Growth Rate (CAGR) of the Chatbot Industry?
The projected CAGR is approximately 24.32%.
2. Which companies are prominent players in the Chatbot Industry?
Key companies in the market include Zendesk Inc, Creative Virtual Ltd, AWS Inc (Amazon com Inc ), [24]7 ai Inc, Kore ai Inc, LiveChat Inc *List Not Exhaustive, IBM Corporation, Nuance Communications Inc (Microsoft Corp ), Artificial Solutions International AB, Inbenta Holdings Inc, Avaamo Inc, Amelia US LLC (Ipsoft Inc ), Egain Corporation, Serviceaide Inc, Dialogflow (Google), EdgeVerve Systems Limited.
3. What are the main segments of the Chatbot Industry?
The market segments include End-user Vertical.
4. Can you provide details about the market size?
The market size is estimated to be USD 7.01 Million as of 2022.
5. What are some drivers contributing to market growth?
Rising Domination of Messenger Applications; Increasing Demand for Consumer Analytics.
6. What are the notable trends driving market growth?
Retail to Have Significant Growth.
7. Are there any restraints impacting market growth?
Integration Complexities and Data Concerns.
8. Can you provide examples of recent developments in the market?
April 2023 - Kore.ai disclosed that the firm had integrated its conversational AgentAssist with automated intelligent virtual assistant (IVA) support for Zendesk Inc. Through an everyday user experience, this AI virtual assistant for contact center employees manages the generation and sales processes, extending the capabilities of Zendesk Support across digital channels.
9. What pricing options are available for accessing the report?
Pricing options include single-user, multi-user, and enterprise licenses priced at USD 4750, USD 5250, and USD 8750 respectively.
10. Is the market size provided in terms of value or volume?
The market size is provided in terms of value, measured in Million.
11. Are there any specific market keywords associated with the report?
Yes, the market keyword associated with the report is "Chatbot Industry," which aids in identifying and referencing the specific market segment covered.
12. How do I determine which pricing option suits my needs best?
The pricing options vary based on user requirements and access needs. Individual users may opt for single-user licenses, while businesses requiring broader access may choose multi-user or enterprise licenses for cost-effective access to the report.
13. Are there any additional resources or data provided in the Chatbot Industry report?
While the report offers comprehensive insights, it's advisable to review the specific contents or supplementary materials provided to ascertain if additional resources or data are available.
14. How can I stay updated on further developments or reports in the Chatbot Industry?
To stay informed about further developments, trends, and reports in the Chatbot Industry, consider subscribing to industry newsletters, following relevant companies and organizations, or regularly checking reputable industry news sources and publications.
Methodology
Step 1 - Identification of Relevant Samples Size from Population Database


Step 2 - Approaches for Defining Global Market Size (Value, Volume* & Price*)

Note*: In applicable scenarios
Step 3 - Data Sources
Primary Research
- Web Analytics
- Survey Reports
- Research Institute
- Latest Research Reports
- Opinion Leaders
Secondary Research
- Annual Reports
- White Paper
- Latest Press Release
- Industry Association
- Paid Database
- Investor Presentations

Step 4 - Data Triangulation
Involves using different sources of information in order to increase the validity of a study
These sources are likely to be stakeholders in a program - participants, other researchers, program staff, other community members, and so on.
Then we put all data in single framework & apply various statistical tools to find out the dynamic on the market.
During the analysis stage, feedback from the stakeholder groups would be compared to determine areas of agreement as well as areas of divergence