

Key Insights
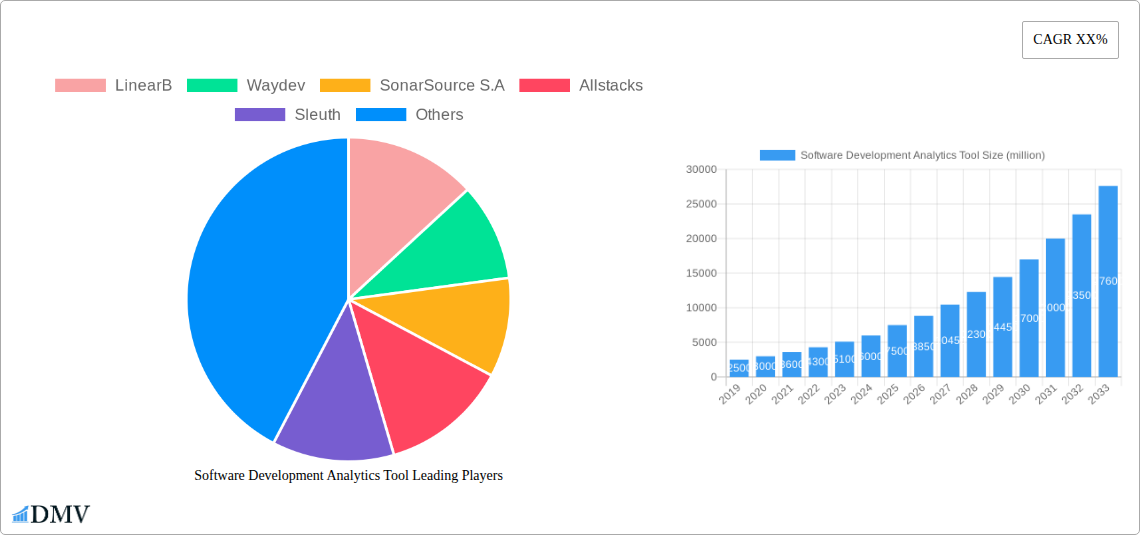
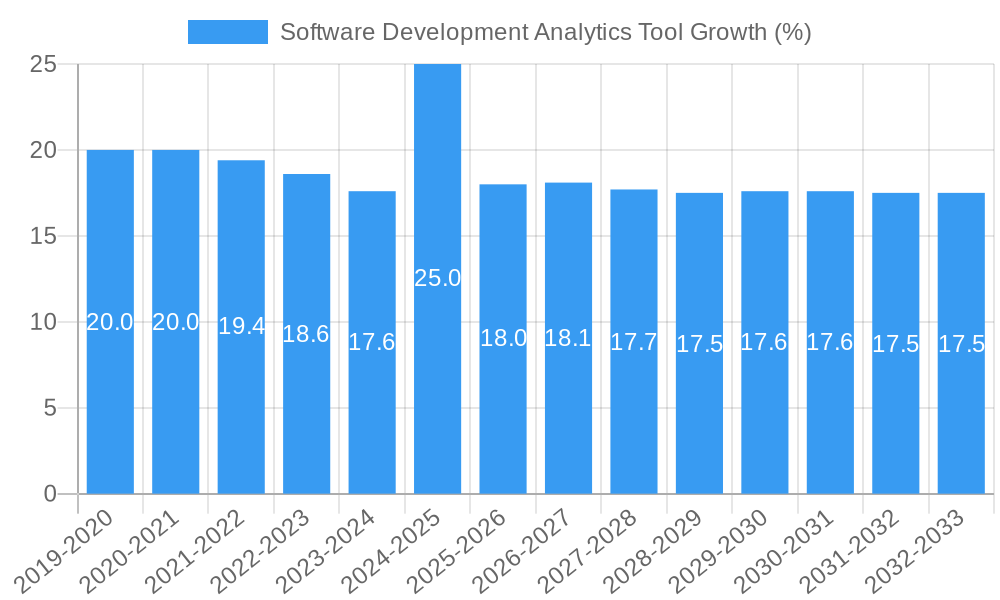
The Software Development Analytics Tool market is poised for significant expansion, projected to reach a substantial market size of approximately $7,500 million by 2025, with a robust Compound Annual Growth Rate (CAGR) of 18.0% through 2033. This dynamic growth is primarily fueled by the increasing need for enhanced productivity, improved code quality, and optimized development workflows within organizations of all sizes. As software complexity escalates and development cycles accelerate, businesses are actively seeking sophisticated tools to gain actionable insights into their development processes. Key drivers include the growing adoption of agile and DevOps methodologies, the imperative to reduce development costs, and the continuous pursuit of faster time-to-market for software products. Furthermore, the proliferation of cloud-based solutions is democratizing access to these powerful analytics, making them attainable for Small and Medium-sized Enterprises (SMEs) alongside large enterprises.
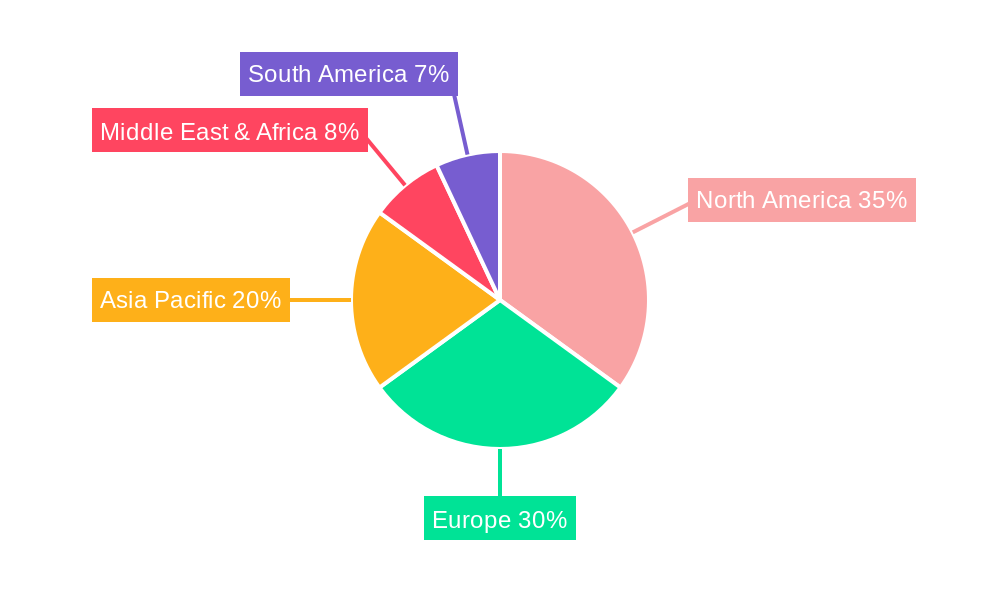
However, the market faces certain restraints that could temper its growth trajectory. The primary challenges include the initial investment costs associated with implementing comprehensive analytics platforms, potential data security and privacy concerns, and the need for skilled personnel to effectively interpret and act upon the data generated. Overcoming these hurdles will be crucial for sustained market penetration. The market is segmented by application, with both Large Enterprises and SMEs representing significant adoption segments, and by type, with Cloud-Based solutions expected to dominate due to their scalability and flexibility, while On-Premises solutions will cater to organizations with stringent data control requirements. Geographically, North America and Europe are anticipated to lead the market due to their mature technology ecosystems and high concentration of software development activities, while the Asia Pacific region is projected to exhibit the fastest growth, driven by rapid digitalization and increasing R&D investments.
Software Development Analytics Tool Market Composition & Trends
The Software Development Analytics Tool market is characterized by a dynamic interplay of innovation, strategic consolidation, and evolving regulatory landscapes. This report delves into the intricate market composition, analyzing the concentration of key players such as LinearB, Waydev, SonarSource S.A., Allstacks, Sleuth, Quality Clouds, Pluralsight, Code Climate, Embold Technologies, Haystack Analytics, Codacy, Jellyfish, Screenful, Micro Focus, ivelum, AWS, AnalyticsVerse, Awesome Graphs for Bitbucket, Bitergia, Botany.io, Duecode, DX Heroes, Gitalytics, GitClear, Gradle, LOGILICA, Propelo, Sedai, ServiceNow, Software.com, RBG Applications, Numerify, sourced, SourceLevel, Stackin Technology, Swarmia, Upside. Market share distribution reveals a mix of established giants and agile innovators, with significant investments flowing into cutting-edge solutions. Innovation catalysts are primarily driven by the increasing demand for enhanced developer productivity, code quality, and efficient project management. Regulatory shifts, while less prominent, are gradually influencing data privacy and security standards within the software development lifecycle. Substitute products, including manual analysis methods and less comprehensive project management tools, are being steadily displaced by the advanced capabilities of dedicated analytics platforms. End-user profiles span across Large Enterprises and SMEs, each with distinct needs for scalability, integration, and cost-effectiveness. Mergers and acquisitions (M&A) activities are a key trend, with estimated M&A deal values reaching into the millions, as companies seek to expand their feature sets, customer bases, and market reach. For instance, recent M&A activity is projected to be in the range of $500 million to $1.2 billion in deal value over the forecast period, reflecting a robust appetite for market consolidation and strategic growth.
Software Development Analytics Tool Industry Evolution
The Software Development Analytics Tool industry has undergone a remarkable transformation, evolving from rudimentary tracking mechanisms to sophisticated platforms that provide deep insights into the entire software development lifecycle. The study period, spanning from 2019 to 2033, with a base year of 2025, reveals a trajectory of exponential growth. During the historical period (2019-2024), the market was characterized by a nascent understanding of the value of data-driven development, with adoption rates for dedicated analytics tools gradually increasing. Early solutions focused on basic metrics like code commits and bug counts. However, the estimated year of 2025 marks a pivotal point where the industry has matured significantly, with advanced AI and machine learning capabilities becoming integral. The forecast period (2025-2033) anticipates sustained high growth, driven by the increasing complexity of software projects, the rise of agile and DevOps methodologies, and the imperative for organizations to optimize their development processes for speed, quality, and cost-efficiency.
Technological advancements have been a primary engine of this evolution. Initially, tools relied on simple integrations with version control systems. Today, leading platforms like LinearB, Waydev, and SonarSource S.A. leverage sophisticated algorithms to analyze code quality, identify performance bottlenecks, predict potential delays, and offer actionable recommendations for improving developer workflow. The integration of AI and machine learning has enabled predictive analytics, allowing teams to forecast project timelines with greater accuracy and proactively address risks. Furthermore, the rise of cloud-based solutions has democratized access to powerful analytics, making them available to businesses of all sizes, from SMEs to Large Enterprises.
Shifting consumer demands have also played a crucial role. Developers and project managers are no longer satisfied with simply knowing what happened; they demand insights into why it happened and how to improve. This has led to a focus on actionable metrics and qualitative data, moving beyond vanity metrics to understand team dynamics, code review efficiency, and the overall developer experience. The demand for tools that can integrate seamlessly with existing development pipelines, including CI/CD tools, issue trackers, and communication platforms, has also surged. Companies like Allstacks, Sleuth, and Quality Clouds are at the forefront of providing these integrated solutions. The increasing emphasis on developer experience (DevEx) is further fueling the demand for analytics tools that can identify friction points and suggest improvements, ultimately leading to higher developer satisfaction and retention. The adoption of metrics like cycle time, lead time, and deployment frequency has become standard practice, with analytics tools providing the backbone for measuring and optimizing these critical indicators. Growth rates are projected to be in the range of 25-35% annually during the forecast period, with adoption metrics for comprehensive software development analytics tools expected to exceed 70% among large enterprises and 50% among SMEs by 2033.
Leading Regions, Countries, or Segments in Software Development Analytics Tool
The Software Development Analytics Tool market is experiencing significant growth across various regions and segments, with North America currently leading the charge, closely followed by Europe. This dominance is driven by a confluence of factors including a mature technology ecosystem, substantial investment in R&D, and the early adoption of agile and DevOps practices by a large number of businesses.
Application: Large Enterprises vs. SMEs
Large Enterprises represent a dominant segment due to their complex software development needs, larger teams, and substantial budgets allocated for optimizing development processes. Key drivers for their adoption include:
- Scalability and Integration: Large enterprises require solutions that can handle massive codebases, numerous development teams, and integrate seamlessly with a wide array of existing tools (e.g., Jira, GitHub, Jenkins). Companies like ServiceNow, Micro Focus, and Jellyfish cater extensively to these enterprise-level requirements.
- Risk Management and Compliance: The need for robust security, compliance, and audit trails makes sophisticated analytics tools essential for identifying vulnerabilities and ensuring adherence to regulatory standards. SonarSource S.A. and Quality Clouds are prominent in this aspect.
- Cost Optimization: While initial investment may be higher, the long-term benefits of improved efficiency, reduced bug rates, and faster time-to-market translate into significant cost savings, estimated to be in the millions of dollars annually for large organizations.
- Data-Driven Decision Making: Large enterprises leverage analytics to gain deep insights into team performance, project progress, and resource allocation, enabling data-backed strategic decisions that impact millions in revenue.
Small and Medium-sized Enterprises (SMEs), while a growing segment, are increasingly adopting these tools as their development processes mature and the need for efficiency becomes paramount. Key drivers for SMEs include:
- Affordability and Ease of Use: Cloud-based solutions offered by providers like LinearB, Waydev, and Screenful are becoming more accessible and user-friendly, fitting within SME budgets.
- Competitive Advantage: SMEs use these tools to punch above their weight, enabling them to compete with larger players by delivering high-quality software faster.
- Productivity Boost: Even with smaller teams, the ability to identify bottlenecks and improve workflows can lead to substantial productivity gains, measured in hundreds of hours saved per developer per year.
- Foundation for Growth: Investing in analytics early helps SMEs build robust development practices that can scale as the company grows.
Types: Cloud Based vs. On Premises
Cloud Based solutions are rapidly becoming the preferred choice across both Large Enterprises and SMEs, accounting for an estimated 70-80% of the market share in 2025. The dominance of cloud-based offerings is attributed to:
- Accessibility and Flexibility: Cloud platforms allow for easy access from anywhere, enabling remote and distributed teams to collaborate effectively. Providers like AWS facilitate the infrastructure for many of these tools.
- Reduced IT Overhead: Eliminates the need for significant on-premises hardware and maintenance, leading to substantial cost savings, estimated in the hundreds of thousands of dollars for infrastructure.
- Scalability and Agility: Cloud solutions can scale up or down based on demand, offering greater flexibility than fixed on-premises deployments.
- Faster Deployment and Updates: New features and security patches are typically rolled out more quickly, ensuring users are always on the latest, most effective version.
- Cost-Effectiveness: Subscription-based models make powerful analytics tools accessible with predictable monthly or annual costs, often in the tens of thousands to millions of dollars for enterprise-level subscriptions.
On Premises solutions, while still present, are seeing a decline in market share, primarily due to the higher upfront investment, ongoing maintenance costs, and the complexities associated with updates and scalability. However, they remain relevant for organizations with stringent data residency requirements or those with a strong preference for complete control over their infrastructure.
In summary, the dominance of Large Enterprises and the rapid rise of Cloud Based solutions, particularly in North America and Europe, are the defining characteristics of the current Software Development Analytics Tool market.
Software Development Analytics Tool Product Innovations
Software Development Analytics Tool product innovations are rapidly enhancing developer productivity and code quality through advanced AI, machine learning, and seamless integrations. Key advancements include predictive analytics for identifying potential project delays and code risks, real-time feedback loops for code reviews, and automated performance optimization recommendations. For example, solutions from LinearB and Waydev now offer insights into developer flow metrics, enabling teams to pinpoint and resolve bottlenecks in their workflows, thereby saving millions of development hours annually. The introduction of sophisticated dashboards by companies like Jellyfish and Allstacks provides comprehensive visibility into engineering metrics, allowing for better strategic decision-making and resource allocation. Furthermore, enhanced security scanning capabilities by SonarSource S.A. and Quality Clouds are proactively identifying vulnerabilities early in the development cycle, mitigating risks and potential breaches valued in the millions.
Propelling Factors for Software Development Analytics Tool Growth
The growth of the Software Development Analytics Tool market is propelled by several key factors. Technological advancements, particularly in AI and machine learning, are enabling more sophisticated insights into developer workflows and code quality, driving efficiency and reducing bugs. The widespread adoption of Agile and DevOps methodologies necessitates robust analytics to monitor and optimize continuous integration and continuous delivery (CI/CD) pipelines, leading to faster release cycles valued in the millions of dollars per year in saved development time. Increasing complexity of software projects requires better management and oversight, which analytics tools provide. Furthermore, the growing emphasis on developer productivity and experience (DevEx) is pushing organizations to invest in tools that can identify friction points and foster a more efficient and satisfying work environment, ultimately impacting talent retention and reducing recruitment costs estimated in the hundreds of thousands.
Obstacles in the Software Development Analytics Tool Market
Despite robust growth, the Software Development Analytics Tool market faces several obstacles. Data privacy and security concerns remain a significant barrier, as organizations handle sensitive code and project data, requiring stringent compliance with regulations, which can add millions in compliance costs. Integration challenges with legacy systems and diverse toolchains can hinder widespread adoption, demanding considerable IT resources and potentially leading to project delays valued in the tens of thousands of dollars. Resistance to change and adoption hurdles within development teams, particularly concerns about perceived micro-management or surveillance, can slow down the effective utilization of these tools. The high cost of implementation and subscription fees for advanced enterprise-grade solutions can also be a deterrent for smaller organizations, limiting their access to the full spectrum of benefits, though competitive pricing is increasingly making these tools accessible.
Future Opportunities in Software Development Analytics Tool
Future opportunities in the Software Development Analytics Tool market are abundant, driven by emerging trends and evolving industry needs. The integration of AI-powered predictive analytics will become more sophisticated, offering even deeper insights into project risks, resource allocation, and future development needs, potentially saving billions in development costs globally. The expansion of DevOps and platform engineering will create a demand for analytics tools that can provide holistic insights across the entire software delivery lifecycle, from ideation to production monitoring. Increased focus on developer experience (DevEx) will drive demand for tools that not only measure performance but also actively contribute to improving team well-being and job satisfaction, thereby reducing churn and associated recruitment costs. The growth of specialized analytics for niche development areas, such as embedded systems, AI/ML model development, and blockchain, presents further avenues for innovation and market penetration, potentially unlocking new revenue streams in the millions.
Major Players in the Software Development Analytics Tool Ecosystem
- LinearB
- Waydev
- SonarSource S.A.
- Allstacks
- Sleuth
- Quality Clouds
- Pluralsight
- Code Climate
- Embold Technologies
- Haystack Analytics
- Codacy
- Jellyfish
- Screenful
- Micro Focus
- ivelum
- AWS
- AnalyticsVerse
- Awesome Graphs for Bitbucket
- Bitergia
- Botany.io
- Duecode
- DX Heroes
- Gitalytics
- GitClear
- Gradle
- LOGILICA
- Propelo
- Sedai
- ServiceNow
- Software.com
- RBG Applications
- Numerify
- sourced
- SourceLevel
- Stackin Technology
- Swarmia
- Upside
Key Developments in Software Development Analytics Tool Industry
- 2023/Q4: Launch of AI-powered predictive analytics features by LinearB, enabling more accurate project timeline forecasting and risk identification, impacting millions in project budget management.
- 2024/Q1: SonarSource S.A. enhances its code quality and security platform with advanced SAST and DAST capabilities, bolstering enterprise security and compliance efforts, potentially preventing breaches valued in the millions.
- 2024/Q2: Jellyfish secures significant funding to expand its engineering management platform, focusing on better integration with CI/CD tools and developer experience metrics, reflecting a market appetite for comprehensive solutions.
- 2024/Q3: Waydev introduces new features for team collaboration and bottleneck identification, aimed at improving developer flow and productivity, expected to save thousands of development hours per team annually.
- 2025/Q1: Release of advanced analytics for serverless architectures by AWS, catering to the growing demand for insights in cloud-native development, highlighting the platform's expanding ecosystem.
- 2025/Q2: Allstacks announces strategic partnerships to integrate with a broader range of development tools, aiming to provide a more unified view of the software development lifecycle for large enterprises.
Strategic Software Development Analytics Tool Market Forecast
The strategic Software Development Analytics Tool market forecast indicates continued robust expansion, driven by an insatiable demand for optimizing software delivery. Key growth catalysts include the escalating adoption of AI and machine learning for predictive insights, the pervasive integration of DevOps and Agile practices, and a heightened organizational focus on enhancing developer productivity and experience. Emerging opportunities in specialized analytics for evolving technologies and the ongoing trend of cloud-based solutions will further fuel market penetration. The market potential is immense, with organizations across all sectors increasingly recognizing these tools not just as performance enhancers but as critical enablers of business agility and competitive advantage, contributing to billions in operational efficiency gains and innovation acceleration.
Software Development Analytics Tool Segmentation
-
1. Application
- 1.1. Large Enterprises
- 1.2. SMEs
-
2. Types
- 2.1. Cloud Based
- 2.2. On Premises
Software Development Analytics Tool Segmentation By Geography
-
1. North America
- 1.1. United States
- 1.2. Canada
- 1.3. Mexico
-
2. South America
- 2.1. Brazil
- 2.2. Argentina
- 2.3. Rest of South America
-
3. Europe
- 3.1. United Kingdom
- 3.2. Germany
- 3.3. France
- 3.4. Italy
- 3.5. Spain
- 3.6. Russia
- 3.7. Benelux
- 3.8. Nordics
- 3.9. Rest of Europe
-
4. Middle East & Africa
- 4.1. Turkey
- 4.2. Israel
- 4.3. GCC
- 4.4. North Africa
- 4.5. South Africa
- 4.6. Rest of Middle East & Africa
-
5. Asia Pacific
- 5.1. China
- 5.2. India
- 5.3. Japan
- 5.4. South Korea
- 5.5. ASEAN
- 5.6. Oceania
- 5.7. Rest of Asia Pacific
Software Development Analytics Tool REPORT HIGHLIGHTS
| Aspects | Details |
|---|---|
| Study Period | 2019-2033 |
| Base Year | 2024 |
| Estimated Year | 2025 |
| Forecast Period | 2025-2033 |
| Historical Period | 2019-2024 |
| Growth Rate | CAGR of XX% from 2019-2033 |
| Segmentation |
|
Table of Contents
- 1. Introduction
- 1.1. Research Scope
- 1.2. Market Segmentation
- 1.3. Research Methodology
- 1.4. Definitions and Assumptions
- 2. Executive Summary
- 2.1. Introduction
- 3. Market Dynamics
- 3.1. Introduction
- 3.2. Market Drivers
- 3.3. Market Restrains
- 3.4. Market Trends
- 4. Market Factor Analysis
- 4.1. Porters Five Forces
- 4.2. Supply/Value Chain
- 4.3. PESTEL analysis
- 4.4. Market Entropy
- 4.5. Patent/Trademark Analysis
- 5. Global Software Development Analytics Tool Analysis, Insights and Forecast, 2019-2031
- 5.1. Market Analysis, Insights and Forecast - by Application
- 5.1.1. Large Enterprises
- 5.1.2. SMEs
- 5.2. Market Analysis, Insights and Forecast - by Types
- 5.2.1. Cloud Based
- 5.2.2. On Premises
- 5.3. Market Analysis, Insights and Forecast - by Region
- 5.3.1. North America
- 5.3.2. South America
- 5.3.3. Europe
- 5.3.4. Middle East & Africa
- 5.3.5. Asia Pacific
- 5.1. Market Analysis, Insights and Forecast - by Application
- 6. North America Software Development Analytics Tool Analysis, Insights and Forecast, 2019-2031
- 6.1. Market Analysis, Insights and Forecast - by Application
- 6.1.1. Large Enterprises
- 6.1.2. SMEs
- 6.2. Market Analysis, Insights and Forecast - by Types
- 6.2.1. Cloud Based
- 6.2.2. On Premises
- 6.1. Market Analysis, Insights and Forecast - by Application
- 7. South America Software Development Analytics Tool Analysis, Insights and Forecast, 2019-2031
- 7.1. Market Analysis, Insights and Forecast - by Application
- 7.1.1. Large Enterprises
- 7.1.2. SMEs
- 7.2. Market Analysis, Insights and Forecast - by Types
- 7.2.1. Cloud Based
- 7.2.2. On Premises
- 7.1. Market Analysis, Insights and Forecast - by Application
- 8. Europe Software Development Analytics Tool Analysis, Insights and Forecast, 2019-2031
- 8.1. Market Analysis, Insights and Forecast - by Application
- 8.1.1. Large Enterprises
- 8.1.2. SMEs
- 8.2. Market Analysis, Insights and Forecast - by Types
- 8.2.1. Cloud Based
- 8.2.2. On Premises
- 8.1. Market Analysis, Insights and Forecast - by Application
- 9. Middle East & Africa Software Development Analytics Tool Analysis, Insights and Forecast, 2019-2031
- 9.1. Market Analysis, Insights and Forecast - by Application
- 9.1.1. Large Enterprises
- 9.1.2. SMEs
- 9.2. Market Analysis, Insights and Forecast - by Types
- 9.2.1. Cloud Based
- 9.2.2. On Premises
- 9.1. Market Analysis, Insights and Forecast - by Application
- 10. Asia Pacific Software Development Analytics Tool Analysis, Insights and Forecast, 2019-2031
- 10.1. Market Analysis, Insights and Forecast - by Application
- 10.1.1. Large Enterprises
- 10.1.2. SMEs
- 10.2. Market Analysis, Insights and Forecast - by Types
- 10.2.1. Cloud Based
- 10.2.2. On Premises
- 10.1. Market Analysis, Insights and Forecast - by Application
- 11. Competitive Analysis
- 11.1. Global Market Share Analysis 2024
- 11.2. Company Profiles
- 11.2.1 LinearB
- 11.2.1.1. Overview
- 11.2.1.2. Products
- 11.2.1.3. SWOT Analysis
- 11.2.1.4. Recent Developments
- 11.2.1.5. Financials (Based on Availability)
- 11.2.2 Waydev
- 11.2.2.1. Overview
- 11.2.2.2. Products
- 11.2.2.3. SWOT Analysis
- 11.2.2.4. Recent Developments
- 11.2.2.5. Financials (Based on Availability)
- 11.2.3 SonarSource S.A
- 11.2.3.1. Overview
- 11.2.3.2. Products
- 11.2.3.3. SWOT Analysis
- 11.2.3.4. Recent Developments
- 11.2.3.5. Financials (Based on Availability)
- 11.2.4 Allstacks
- 11.2.4.1. Overview
- 11.2.4.2. Products
- 11.2.4.3. SWOT Analysis
- 11.2.4.4. Recent Developments
- 11.2.4.5. Financials (Based on Availability)
- 11.2.5 Sleuth
- 11.2.5.1. Overview
- 11.2.5.2. Products
- 11.2.5.3. SWOT Analysis
- 11.2.5.4. Recent Developments
- 11.2.5.5. Financials (Based on Availability)
- 11.2.6 Quality Clouds
- 11.2.6.1. Overview
- 11.2.6.2. Products
- 11.2.6.3. SWOT Analysis
- 11.2.6.4. Recent Developments
- 11.2.6.5. Financials (Based on Availability)
- 11.2.7 Pluralsight
- 11.2.7.1. Overview
- 11.2.7.2. Products
- 11.2.7.3. SWOT Analysis
- 11.2.7.4. Recent Developments
- 11.2.7.5. Financials (Based on Availability)
- 11.2.8 Code Climate
- 11.2.8.1. Overview
- 11.2.8.2. Products
- 11.2.8.3. SWOT Analysis
- 11.2.8.4. Recent Developments
- 11.2.8.5. Financials (Based on Availability)
- 11.2.9 Embold Technologies
- 11.2.9.1. Overview
- 11.2.9.2. Products
- 11.2.9.3. SWOT Analysis
- 11.2.9.4. Recent Developments
- 11.2.9.5. Financials (Based on Availability)
- 11.2.10 Haystack Analytics
- 11.2.10.1. Overview
- 11.2.10.2. Products
- 11.2.10.3. SWOT Analysis
- 11.2.10.4. Recent Developments
- 11.2.10.5. Financials (Based on Availability)
- 11.2.11 Codacy
- 11.2.11.1. Overview
- 11.2.11.2. Products
- 11.2.11.3. SWOT Analysis
- 11.2.11.4. Recent Developments
- 11.2.11.5. Financials (Based on Availability)
- 11.2.12 Jellyfish
- 11.2.12.1. Overview
- 11.2.12.2. Products
- 11.2.12.3. SWOT Analysis
- 11.2.12.4. Recent Developments
- 11.2.12.5. Financials (Based on Availability)
- 11.2.13 Screenful
- 11.2.13.1. Overview
- 11.2.13.2. Products
- 11.2.13.3. SWOT Analysis
- 11.2.13.4. Recent Developments
- 11.2.13.5. Financials (Based on Availability)
- 11.2.14 Micro Focus
- 11.2.14.1. Overview
- 11.2.14.2. Products
- 11.2.14.3. SWOT Analysis
- 11.2.14.4. Recent Developments
- 11.2.14.5. Financials (Based on Availability)
- 11.2.15 ivelum
- 11.2.15.1. Overview
- 11.2.15.2. Products
- 11.2.15.3. SWOT Analysis
- 11.2.15.4. Recent Developments
- 11.2.15.5. Financials (Based on Availability)
- 11.2.16 AWS
- 11.2.16.1. Overview
- 11.2.16.2. Products
- 11.2.16.3. SWOT Analysis
- 11.2.16.4. Recent Developments
- 11.2.16.5. Financials (Based on Availability)
- 11.2.17 AnalyticsVerse
- 11.2.17.1. Overview
- 11.2.17.2. Products
- 11.2.17.3. SWOT Analysis
- 11.2.17.4. Recent Developments
- 11.2.17.5. Financials (Based on Availability)
- 11.2.18 Awesome Graphs for Bitbucket
- 11.2.18.1. Overview
- 11.2.18.2. Products
- 11.2.18.3. SWOT Analysis
- 11.2.18.4. Recent Developments
- 11.2.18.5. Financials (Based on Availability)
- 11.2.19 Bitergia
- 11.2.19.1. Overview
- 11.2.19.2. Products
- 11.2.19.3. SWOT Analysis
- 11.2.19.4. Recent Developments
- 11.2.19.5. Financials (Based on Availability)
- 11.2.20 Botany.io
- 11.2.20.1. Overview
- 11.2.20.2. Products
- 11.2.20.3. SWOT Analysis
- 11.2.20.4. Recent Developments
- 11.2.20.5. Financials (Based on Availability)
- 11.2.21 Duecode
- 11.2.21.1. Overview
- 11.2.21.2. Products
- 11.2.21.3. SWOT Analysis
- 11.2.21.4. Recent Developments
- 11.2.21.5. Financials (Based on Availability)
- 11.2.22 DX Heroes
- 11.2.22.1. Overview
- 11.2.22.2. Products
- 11.2.22.3. SWOT Analysis
- 11.2.22.4. Recent Developments
- 11.2.22.5. Financials (Based on Availability)
- 11.2.23 Gitalytics
- 11.2.23.1. Overview
- 11.2.23.2. Products
- 11.2.23.3. SWOT Analysis
- 11.2.23.4. Recent Developments
- 11.2.23.5. Financials (Based on Availability)
- 11.2.24 GitClear
- 11.2.24.1. Overview
- 11.2.24.2. Products
- 11.2.24.3. SWOT Analysis
- 11.2.24.4. Recent Developments
- 11.2.24.5. Financials (Based on Availability)
- 11.2.25 Gradle
- 11.2.25.1. Overview
- 11.2.25.2. Products
- 11.2.25.3. SWOT Analysis
- 11.2.25.4. Recent Developments
- 11.2.25.5. Financials (Based on Availability)
- 11.2.26 LOGILICA
- 11.2.26.1. Overview
- 11.2.26.2. Products
- 11.2.26.3. SWOT Analysis
- 11.2.26.4. Recent Developments
- 11.2.26.5. Financials (Based on Availability)
- 11.2.27 Propelo
- 11.2.27.1. Overview
- 11.2.27.2. Products
- 11.2.27.3. SWOT Analysis
- 11.2.27.4. Recent Developments
- 11.2.27.5. Financials (Based on Availability)
- 11.2.28 Sedai
- 11.2.28.1. Overview
- 11.2.28.2. Products
- 11.2.28.3. SWOT Analysis
- 11.2.28.4. Recent Developments
- 11.2.28.5. Financials (Based on Availability)
- 11.2.29 ServiceNow
- 11.2.29.1. Overview
- 11.2.29.2. Products
- 11.2.29.3. SWOT Analysis
- 11.2.29.4. Recent Developments
- 11.2.29.5. Financials (Based on Availability)
- 11.2.30 Software.com
- 11.2.30.1. Overview
- 11.2.30.2. Products
- 11.2.30.3. SWOT Analysis
- 11.2.30.4. Recent Developments
- 11.2.30.5. Financials (Based on Availability)
- 11.2.31 RBG Applications
- 11.2.31.1. Overview
- 11.2.31.2. Products
- 11.2.31.3. SWOT Analysis
- 11.2.31.4. Recent Developments
- 11.2.31.5. Financials (Based on Availability)
- 11.2.32 Numerify
- 11.2.32.1. Overview
- 11.2.32.2. Products
- 11.2.32.3. SWOT Analysis
- 11.2.32.4. Recent Developments
- 11.2.32.5. Financials (Based on Availability)
- 11.2.33 sourced
- 11.2.33.1. Overview
- 11.2.33.2. Products
- 11.2.33.3. SWOT Analysis
- 11.2.33.4. Recent Developments
- 11.2.33.5. Financials (Based on Availability)
- 11.2.34 SourceLevel
- 11.2.34.1. Overview
- 11.2.34.2. Products
- 11.2.34.3. SWOT Analysis
- 11.2.34.4. Recent Developments
- 11.2.34.5. Financials (Based on Availability)
- 11.2.35 Stackin Technology
- 11.2.35.1. Overview
- 11.2.35.2. Products
- 11.2.35.3. SWOT Analysis
- 11.2.35.4. Recent Developments
- 11.2.35.5. Financials (Based on Availability)
- 11.2.36 Swarmia
- 11.2.36.1. Overview
- 11.2.36.2. Products
- 11.2.36.3. SWOT Analysis
- 11.2.36.4. Recent Developments
- 11.2.36.5. Financials (Based on Availability)
- 11.2.37 Upside
- 11.2.37.1. Overview
- 11.2.37.2. Products
- 11.2.37.3. SWOT Analysis
- 11.2.37.4. Recent Developments
- 11.2.37.5. Financials (Based on Availability)
- 11.2.1 LinearB
List of Figures
- Figure 1: Global Software Development Analytics Tool Revenue Breakdown (million, %) by Region 2024 & 2032
- Figure 2: North America Software Development Analytics Tool Revenue (million), by Application 2024 & 2032
- Figure 3: North America Software Development Analytics Tool Revenue Share (%), by Application 2024 & 2032
- Figure 4: North America Software Development Analytics Tool Revenue (million), by Types 2024 & 2032
- Figure 5: North America Software Development Analytics Tool Revenue Share (%), by Types 2024 & 2032
- Figure 6: North America Software Development Analytics Tool Revenue (million), by Country 2024 & 2032
- Figure 7: North America Software Development Analytics Tool Revenue Share (%), by Country 2024 & 2032
- Figure 8: South America Software Development Analytics Tool Revenue (million), by Application 2024 & 2032
- Figure 9: South America Software Development Analytics Tool Revenue Share (%), by Application 2024 & 2032
- Figure 10: South America Software Development Analytics Tool Revenue (million), by Types 2024 & 2032
- Figure 11: South America Software Development Analytics Tool Revenue Share (%), by Types 2024 & 2032
- Figure 12: South America Software Development Analytics Tool Revenue (million), by Country 2024 & 2032
- Figure 13: South America Software Development Analytics Tool Revenue Share (%), by Country 2024 & 2032
- Figure 14: Europe Software Development Analytics Tool Revenue (million), by Application 2024 & 2032
- Figure 15: Europe Software Development Analytics Tool Revenue Share (%), by Application 2024 & 2032
- Figure 16: Europe Software Development Analytics Tool Revenue (million), by Types 2024 & 2032
- Figure 17: Europe Software Development Analytics Tool Revenue Share (%), by Types 2024 & 2032
- Figure 18: Europe Software Development Analytics Tool Revenue (million), by Country 2024 & 2032
- Figure 19: Europe Software Development Analytics Tool Revenue Share (%), by Country 2024 & 2032
- Figure 20: Middle East & Africa Software Development Analytics Tool Revenue (million), by Application 2024 & 2032
- Figure 21: Middle East & Africa Software Development Analytics Tool Revenue Share (%), by Application 2024 & 2032
- Figure 22: Middle East & Africa Software Development Analytics Tool Revenue (million), by Types 2024 & 2032
- Figure 23: Middle East & Africa Software Development Analytics Tool Revenue Share (%), by Types 2024 & 2032
- Figure 24: Middle East & Africa Software Development Analytics Tool Revenue (million), by Country 2024 & 2032
- Figure 25: Middle East & Africa Software Development Analytics Tool Revenue Share (%), by Country 2024 & 2032
- Figure 26: Asia Pacific Software Development Analytics Tool Revenue (million), by Application 2024 & 2032
- Figure 27: Asia Pacific Software Development Analytics Tool Revenue Share (%), by Application 2024 & 2032
- Figure 28: Asia Pacific Software Development Analytics Tool Revenue (million), by Types 2024 & 2032
- Figure 29: Asia Pacific Software Development Analytics Tool Revenue Share (%), by Types 2024 & 2032
- Figure 30: Asia Pacific Software Development Analytics Tool Revenue (million), by Country 2024 & 2032
- Figure 31: Asia Pacific Software Development Analytics Tool Revenue Share (%), by Country 2024 & 2032
List of Tables
- Table 1: Global Software Development Analytics Tool Revenue million Forecast, by Region 2019 & 2032
- Table 2: Global Software Development Analytics Tool Revenue million Forecast, by Application 2019 & 2032
- Table 3: Global Software Development Analytics Tool Revenue million Forecast, by Types 2019 & 2032
- Table 4: Global Software Development Analytics Tool Revenue million Forecast, by Region 2019 & 2032
- Table 5: Global Software Development Analytics Tool Revenue million Forecast, by Application 2019 & 2032
- Table 6: Global Software Development Analytics Tool Revenue million Forecast, by Types 2019 & 2032
- Table 7: Global Software Development Analytics Tool Revenue million Forecast, by Country 2019 & 2032
- Table 8: United States Software Development Analytics Tool Revenue (million) Forecast, by Application 2019 & 2032
- Table 9: Canada Software Development Analytics Tool Revenue (million) Forecast, by Application 2019 & 2032
- Table 10: Mexico Software Development Analytics Tool Revenue (million) Forecast, by Application 2019 & 2032
- Table 11: Global Software Development Analytics Tool Revenue million Forecast, by Application 2019 & 2032
- Table 12: Global Software Development Analytics Tool Revenue million Forecast, by Types 2019 & 2032
- Table 13: Global Software Development Analytics Tool Revenue million Forecast, by Country 2019 & 2032
- Table 14: Brazil Software Development Analytics Tool Revenue (million) Forecast, by Application 2019 & 2032
- Table 15: Argentina Software Development Analytics Tool Revenue (million) Forecast, by Application 2019 & 2032
- Table 16: Rest of South America Software Development Analytics Tool Revenue (million) Forecast, by Application 2019 & 2032
- Table 17: Global Software Development Analytics Tool Revenue million Forecast, by Application 2019 & 2032
- Table 18: Global Software Development Analytics Tool Revenue million Forecast, by Types 2019 & 2032
- Table 19: Global Software Development Analytics Tool Revenue million Forecast, by Country 2019 & 2032
- Table 20: United Kingdom Software Development Analytics Tool Revenue (million) Forecast, by Application 2019 & 2032
- Table 21: Germany Software Development Analytics Tool Revenue (million) Forecast, by Application 2019 & 2032
- Table 22: France Software Development Analytics Tool Revenue (million) Forecast, by Application 2019 & 2032
- Table 23: Italy Software Development Analytics Tool Revenue (million) Forecast, by Application 2019 & 2032
- Table 24: Spain Software Development Analytics Tool Revenue (million) Forecast, by Application 2019 & 2032
- Table 25: Russia Software Development Analytics Tool Revenue (million) Forecast, by Application 2019 & 2032
- Table 26: Benelux Software Development Analytics Tool Revenue (million) Forecast, by Application 2019 & 2032
- Table 27: Nordics Software Development Analytics Tool Revenue (million) Forecast, by Application 2019 & 2032
- Table 28: Rest of Europe Software Development Analytics Tool Revenue (million) Forecast, by Application 2019 & 2032
- Table 29: Global Software Development Analytics Tool Revenue million Forecast, by Application 2019 & 2032
- Table 30: Global Software Development Analytics Tool Revenue million Forecast, by Types 2019 & 2032
- Table 31: Global Software Development Analytics Tool Revenue million Forecast, by Country 2019 & 2032
- Table 32: Turkey Software Development Analytics Tool Revenue (million) Forecast, by Application 2019 & 2032
- Table 33: Israel Software Development Analytics Tool Revenue (million) Forecast, by Application 2019 & 2032
- Table 34: GCC Software Development Analytics Tool Revenue (million) Forecast, by Application 2019 & 2032
- Table 35: North Africa Software Development Analytics Tool Revenue (million) Forecast, by Application 2019 & 2032
- Table 36: South Africa Software Development Analytics Tool Revenue (million) Forecast, by Application 2019 & 2032
- Table 37: Rest of Middle East & Africa Software Development Analytics Tool Revenue (million) Forecast, by Application 2019 & 2032
- Table 38: Global Software Development Analytics Tool Revenue million Forecast, by Application 2019 & 2032
- Table 39: Global Software Development Analytics Tool Revenue million Forecast, by Types 2019 & 2032
- Table 40: Global Software Development Analytics Tool Revenue million Forecast, by Country 2019 & 2032
- Table 41: China Software Development Analytics Tool Revenue (million) Forecast, by Application 2019 & 2032
- Table 42: India Software Development Analytics Tool Revenue (million) Forecast, by Application 2019 & 2032
- Table 43: Japan Software Development Analytics Tool Revenue (million) Forecast, by Application 2019 & 2032
- Table 44: South Korea Software Development Analytics Tool Revenue (million) Forecast, by Application 2019 & 2032
- Table 45: ASEAN Software Development Analytics Tool Revenue (million) Forecast, by Application 2019 & 2032
- Table 46: Oceania Software Development Analytics Tool Revenue (million) Forecast, by Application 2019 & 2032
- Table 47: Rest of Asia Pacific Software Development Analytics Tool Revenue (million) Forecast, by Application 2019 & 2032
Frequently Asked Questions
1. What is the projected Compound Annual Growth Rate (CAGR) of the Software Development Analytics Tool?
The projected CAGR is approximately XX%.
2. Which companies are prominent players in the Software Development Analytics Tool?
Key companies in the market include LinearB, Waydev, SonarSource S.A, Allstacks, Sleuth, Quality Clouds, Pluralsight, Code Climate, Embold Technologies, Haystack Analytics, Codacy, Jellyfish, Screenful, Micro Focus, ivelum, AWS, AnalyticsVerse, Awesome Graphs for Bitbucket, Bitergia, Botany.io, Duecode, DX Heroes, Gitalytics, GitClear, Gradle, LOGILICA, Propelo, Sedai, ServiceNow, Software.com, RBG Applications, Numerify, sourced, SourceLevel, Stackin Technology, Swarmia, Upside.
3. What are the main segments of the Software Development Analytics Tool?
The market segments include Application, Types.
4. Can you provide details about the market size?
The market size is estimated to be USD XXX million as of 2022.
5. What are some drivers contributing to market growth?
N/A
6. What are the notable trends driving market growth?
N/A
7. Are there any restraints impacting market growth?
N/A
8. Can you provide examples of recent developments in the market?
N/A
9. What pricing options are available for accessing the report?
Pricing options include single-user, multi-user, and enterprise licenses priced at USD 3950.00, USD 5925.00, and USD 7900.00 respectively.
10. Is the market size provided in terms of value or volume?
The market size is provided in terms of value, measured in million.
11. Are there any specific market keywords associated with the report?
Yes, the market keyword associated with the report is "Software Development Analytics Tool," which aids in identifying and referencing the specific market segment covered.
12. How do I determine which pricing option suits my needs best?
The pricing options vary based on user requirements and access needs. Individual users may opt for single-user licenses, while businesses requiring broader access may choose multi-user or enterprise licenses for cost-effective access to the report.
13. Are there any additional resources or data provided in the Software Development Analytics Tool report?
While the report offers comprehensive insights, it's advisable to review the specific contents or supplementary materials provided to ascertain if additional resources or data are available.
14. How can I stay updated on further developments or reports in the Software Development Analytics Tool?
To stay informed about further developments, trends, and reports in the Software Development Analytics Tool, consider subscribing to industry newsletters, following relevant companies and organizations, or regularly checking reputable industry news sources and publications.
Methodology
Step 1 - Identification of Relevant Samples Size from Population Database


Step 2 - Approaches for Defining Global Market Size (Value, Volume* & Price*)

Note*: In applicable scenarios
Step 3 - Data Sources
Primary Research
- Web Analytics
- Survey Reports
- Research Institute
- Latest Research Reports
- Opinion Leaders
Secondary Research
- Annual Reports
- White Paper
- Latest Press Release
- Industry Association
- Paid Database
- Investor Presentations

Step 4 - Data Triangulation
Involves using different sources of information in order to increase the validity of a study
These sources are likely to be stakeholders in a program - participants, other researchers, program staff, other community members, and so on.
Then we put all data in single framework & apply various statistical tools to find out the dynamic on the market.
During the analysis stage, feedback from the stakeholder groups would be compared to determine areas of agreement as well as areas of divergence
