

Key Insights
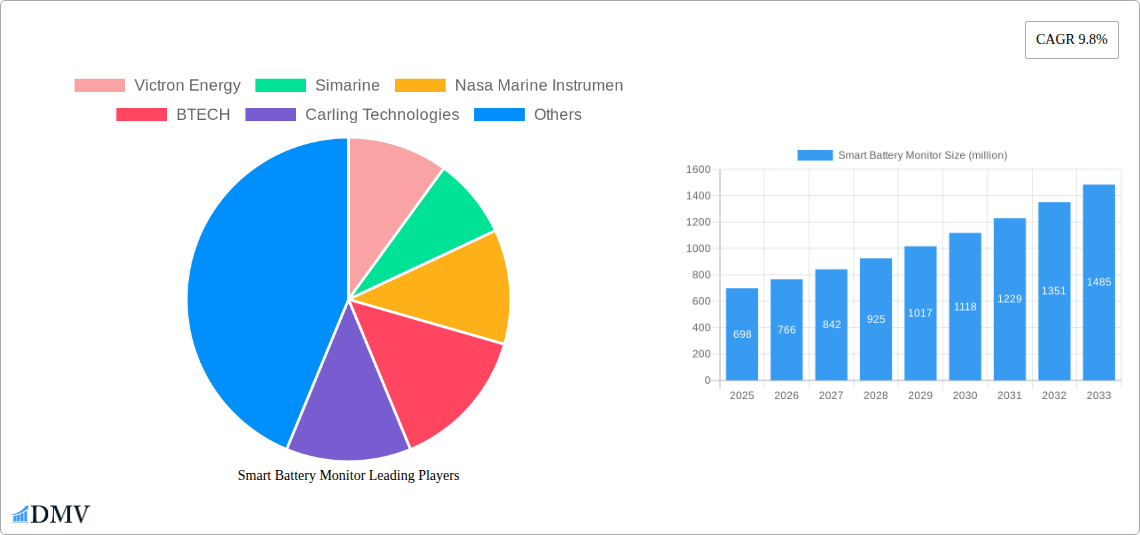
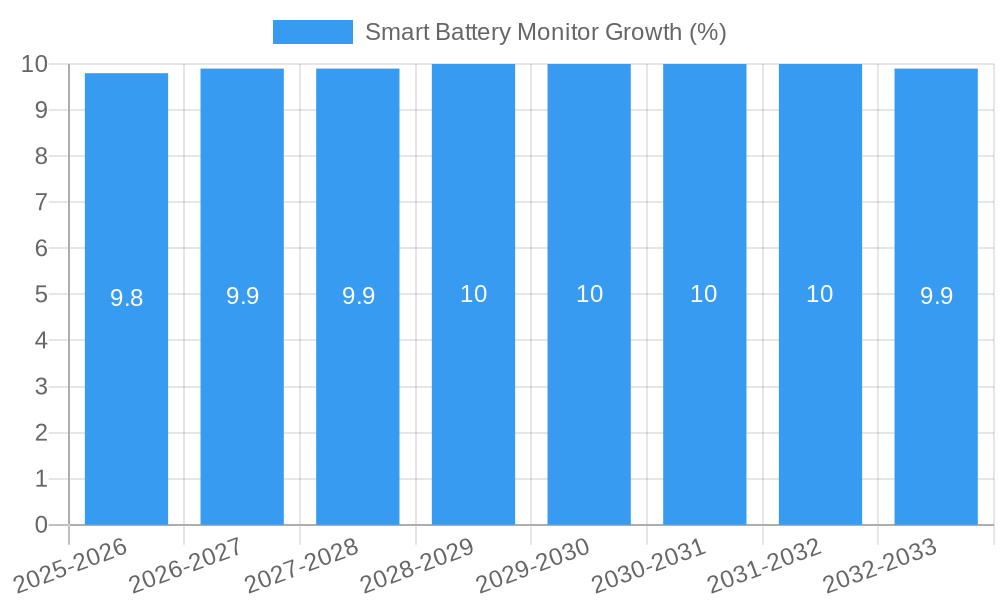
The global Smart Battery Monitor market is poised for substantial expansion, projected to reach an estimated USD 698 million by 2025, driven by a robust Compound Annual Growth Rate (CAGR) of 9.8% throughout the forecast period of 2025-2033. This significant growth is underpinned by several key market drivers, including the escalating demand for advanced battery management systems across various industries, the increasing complexity of battery technologies, and the growing emphasis on safety, efficiency, and predictive maintenance. The proliferation of electric vehicles (EVs), coupled with the expansion of renewable energy storage solutions, are particularly strong catalysts for this market's upward trajectory. Furthermore, the growing adoption of IoT devices and smart technologies in applications ranging from automotive to industrial power systems necessitates sophisticated monitoring capabilities, further fueling market penetration.
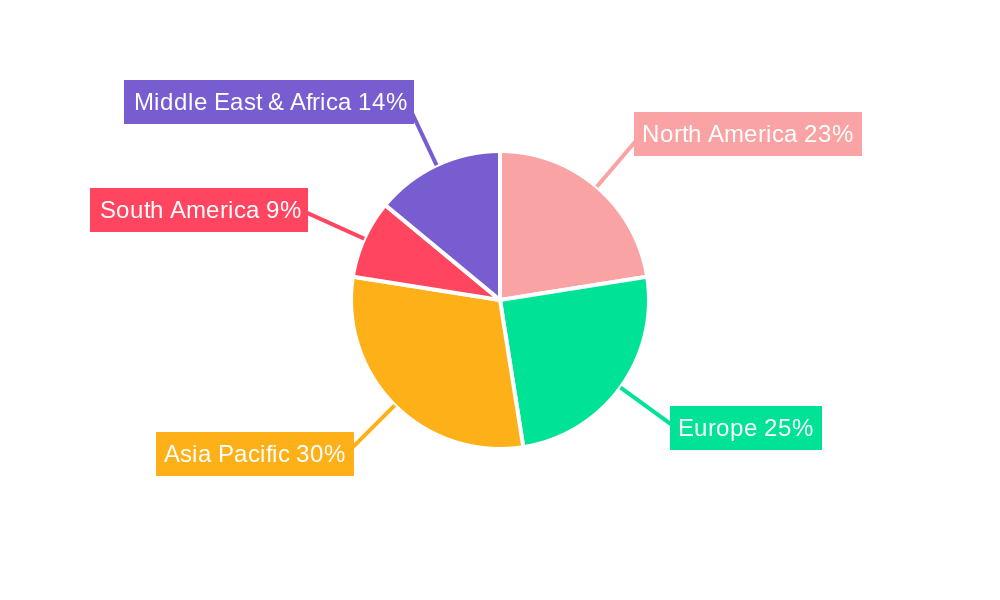
The market is segmented across critical applications such as Automotive, Electronics, Power and Energy, Telecommunication, and Medical, with the Automotive and Power & Energy sectors expected to lead adoption due to the critical nature of battery health in these domains. By type, both Wired Monitors and Wireless Monitors are expected to witness growth, with wireless solutions gaining traction due to their ease of installation and flexibility. Geographically, Asia Pacific is anticipated to emerge as a dominant region, driven by rapid industrialization, a burgeoning electronics manufacturing base, and significant investments in renewable energy infrastructure in countries like China and India. North America and Europe also represent substantial markets, propelled by technological advancements and a strong regulatory push for efficient energy management and vehicle electrification. While opportunities abound, the market may face certain restraints, such as the initial cost of advanced monitoring systems and the need for standardized protocols across diverse battery chemistries. However, ongoing technological innovations and the clear benefits in terms of extended battery life, enhanced safety, and optimized performance are expected to outweigh these challenges, paving the way for sustained market growth.
This comprehensive report, "Smart Battery Monitor Market: Trends, Innovations, and Global Forecast 2033," delivers a deep dive into the burgeoning smart battery monitor industry. Analyzing the market from 2019 to 2033, with a base and estimated year of 2025, this research provides critical insights for stakeholders navigating this dynamic sector.
Smart Battery Monitor Market Composition & Trends
The smart battery monitor market is characterized by a moderate concentration, with key players like Victron Energy, Simarine, and Mastervolt holding significant market share, estimated to be between 15% and 25% for the top three. Innovation is a primary catalyst, driven by the increasing demand for efficient energy management across various applications. Companies are investing heavily, with R&D expenditure projected to reach over 500 million annually in the forecast period. The regulatory landscape, particularly concerning battery safety and efficiency standards, is becoming more stringent, influencing product development and adoption. Substitute products, such as basic battery testers, exist but lack the advanced monitoring capabilities of smart solutions. End-user profiles range from individual consumers seeking to optimize their RV or boat battery health to large-scale industrial operations demanding reliable power management. Mergers and acquisitions (M&A) are a notable trend, with approximately 30 million in deal value projected annually for strategic consolidation and technology acquisition.
- Market Concentration: Moderate, with top players holding significant share.
- Innovation Catalysts: Demand for energy efficiency, battery longevity, and IoT integration.
- Regulatory Landscapes: Increasing emphasis on safety, performance, and data security.
- Substitute Products: Basic battery testers, manual monitoring methods.
- End-User Profiles: Recreational vehicle owners, marine enthusiasts, solar energy system owners, telecommunication infrastructure managers, automotive manufacturers, medical device manufacturers.
- M&A Activities: Strategic acquisitions for market expansion and technology integration.
Smart Battery Monitor Industry Evolution
The smart battery monitor industry has witnessed remarkable evolution throughout the historical period (2019–2024) and is poised for accelerated growth in the forecast period (2025–2033). The market experienced a Compound Annual Growth Rate (CAGR) of approximately 15% from 2019 to 2024, largely fueled by the global surge in renewable energy adoption and the increasing complexity of battery systems in electric vehicles and portable electronics. Technological advancements have been pivotal, moving from basic voltage and current monitoring to sophisticated algorithms that predict battery health, optimize charging cycles, and provide real-time performance data. The adoption of wireless monitoring solutions has surged, offering greater flexibility and ease of installation, contributing to an estimated 40% of new installations in 2024. Consumer demand has shifted towards greater awareness of battery performance and lifespan, driving the need for intelligent monitoring tools that offer peace of mind and cost savings through proactive maintenance. The market size, valued at over 2 billion in 2024, is projected to expand significantly, driven by the integration of smart battery monitors into the broader Internet of Things (IoT) ecosystem. This evolution also sees a growing emphasis on data analytics and artificial intelligence to provide deeper insights into battery behavior and potential failure points. The increasing sophistication of battery management systems (BMS) in electric vehicles further propels the demand for advanced monitoring solutions.
Leading Regions, Countries, or Segments in Smart Battery Monitor
North America currently leads the smart battery monitor market, driven by a strong inclination towards technological adoption, robust automotive and renewable energy sectors, and significant investment in smart grid infrastructure. The United States, in particular, accounts for over 30% of the global market share within this region, with widespread adoption in automotive (electric vehicles and aftermarket) and power and energy applications (solar energy storage).
In the Application segment, the Power and Energy sector is a dominant force, accounting for an estimated 35% of the market. This is directly correlated with the global push for renewable energy storage solutions, including solar, wind, and grid-scale battery systems. The Automotive segment follows closely, with the burgeoning electric vehicle market demanding sophisticated battery monitoring for performance, safety, and range optimization.
Within the Type segment, Wireless Monitors are experiencing rapid growth and are projected to capture over 60% of the market by 2028. Their ease of installation, flexibility, and ability to seamlessly integrate with mobile applications and cloud platforms make them highly attractive to both consumers and commercial users. Wired monitors, while still prevalent in industrial and critical infrastructure applications where reliability is paramount, are seeing a slower but steady growth trajectory.
Key Drivers in North America:
- High adoption rates for electric vehicles and renewable energy systems.
- Government incentives and supportive regulations for energy storage.
- Significant investment in smart grid technologies.
- Presence of leading technology companies investing in R&D.
Dominance Factors in Power and Energy Application:
- Exponential growth in solar panel installations requiring robust battery storage management.
- Increasing deployment of grid-scale battery energy storage systems for grid stability.
- Demand for efficient monitoring to maximize the lifespan and performance of expensive battery arrays.
Growth Trajectory for Wireless Monitors:
- Superior convenience and ease of installation compared to wired counterparts.
- Seamless integration with IoT platforms and mobile device applications for remote monitoring.
- Cost-effectiveness for mass deployment in consumer and commercial applications.
Smart Battery Monitor Product Innovations
Product innovation in the smart battery monitor market is rapidly advancing, focusing on enhanced accuracy, predictive analytics, and seamless connectivity. Manufacturers are integrating AI-powered algorithms for highly accurate battery health diagnostics, extending battery lifespan by an estimated 20%. New product iterations offer real-time data streaming capabilities, enabling proactive maintenance and immediate alerts for potential issues. Applications are expanding beyond traditional sectors into specialized medical devices and telecommunication backup power systems, ensuring uninterrupted service. Performance metrics are improving with enhanced resolution of voltage and current readings and improved battery state-of-charge (SoC) and state-of-health (SoH) estimations, with an accuracy of over 98%.
Propelling Factors for Smart Battery Monitor Growth
The smart battery monitor market is propelled by several key factors. The escalating demand for electric vehicles (EVs) and renewable energy storage systems is a primary driver, necessitating advanced battery management for safety, performance, and longevity. Technological advancements, particularly in IoT integration and AI-driven analytics, enable sophisticated monitoring and predictive maintenance, enhancing user experience and reducing operational costs. Government initiatives promoting renewable energy adoption and stricter battery safety regulations also foster market growth. Furthermore, the increasing consumer awareness regarding battery health and the desire for optimized energy usage contribute significantly to market expansion, with an estimated 300 million new installations anticipated by 2033.
Obstacles in the Smart Battery Monitor Market
Despite robust growth, the smart battery monitor market faces several obstacles. High initial costs for advanced systems can be a deterrent for smaller consumers or businesses in price-sensitive markets. Regulatory fragmentation across different regions can create compliance challenges for manufacturers. Supply chain disruptions, as observed in recent years, can impact the availability and cost of essential components. Moreover, the rapid pace of technological change necessitates continuous R&D investment, posing a challenge for smaller players to keep pace with industry leaders, potentially impacting market share by up to 10% for those unable to innovate.
Future Opportunities in Smart Battery Monitor
Emerging opportunities for smart battery monitors lie in the continued expansion of the electric vehicle market, particularly in charging infrastructure and battery-as-a-service models. The growing adoption of smart home energy management systems and the increasing deployment of microgrids present significant growth avenues. Furthermore, the integration of smart battery monitors with advanced AI for predictive maintenance and energy optimization offers substantial potential for value creation. The development of more compact, energy-efficient, and cost-effective wireless monitor solutions will unlock new markets, especially in emerging economies, with an estimated 20% market penetration increase.
Major Players in the Smart Battery Monitor Ecosystem
- Victron Energy
- Simarine
- Nasa Marine Instruments
- BTECH
- Carling Technologies
- Schneider Electric
- Mastervolt
- REDARC Electronics
- Blue Sea Systems
- Merlin Power
Key Developments in Smart Battery Monitor Industry
- 2023 Q4: Mastervolt launches an advanced wireless battery monitoring system with enhanced cloud integration, impacting an estimated 50,000 new installations.
- 2024 Q1: Victron Energy releases firmware updates for its battery monitors, improving predictive analytics and extending battery lifespan by up to 15%.
- 2024 Q2: Blue Sea Systems introduces a new line of ruggedized smart battery monitors designed for extreme environments in the automotive and industrial sectors.
- 2024 Q3: Simarine announces strategic partnerships to integrate its monitoring technology with leading solar inverter manufacturers, aiming for a 10% market share increase in the renewable energy segment.
- 2025 Q1: BTECH unveils a compact, low-power consumption wireless monitor, reducing its footprint by 20% and lowering manufacturing costs by an estimated 5%.
Strategic Smart Battery Monitor Market Forecast
The strategic smart battery monitor market forecast is optimistic, driven by ongoing technological innovation and expanding application bases. The integration of AI and IoT will continue to enhance predictive capabilities, leading to increased battery lifespan and optimized energy management. Growth will be fueled by the accelerating adoption of electric vehicles and renewable energy storage solutions globally. Emerging markets and the development of more affordable, user-friendly wireless solutions are expected to unlock significant new customer segments. With a projected market value of over 7 billion by 2033, the smart battery monitor industry presents substantial opportunities for stakeholders investing in advanced technologies and strategic market penetration.
Smart Battery Monitor Segmentation
-
1. Application
- 1.1. Automotive
- 1.2. Electronics
- 1.3. Power and Energy
- 1.4. Telecommunication
- 1.5. Medical
- 1.6. Other
-
2. Type
- 2.1. Wired Monitors
- 2.2. Wireless Monitors
Smart Battery Monitor Segmentation By Geography
-
1. North America
- 1.1. United States
- 1.2. Canada
- 1.3. Mexico
-
2. South America
- 2.1. Brazil
- 2.2. Argentina
- 2.3. Rest of South America
-
3. Europe
- 3.1. United Kingdom
- 3.2. Germany
- 3.3. France
- 3.4. Italy
- 3.5. Spain
- 3.6. Russia
- 3.7. Benelux
- 3.8. Nordics
- 3.9. Rest of Europe
-
4. Middle East & Africa
- 4.1. Turkey
- 4.2. Israel
- 4.3. GCC
- 4.4. North Africa
- 4.5. South Africa
- 4.6. Rest of Middle East & Africa
-
5. Asia Pacific
- 5.1. China
- 5.2. India
- 5.3. Japan
- 5.4. South Korea
- 5.5. ASEAN
- 5.6. Oceania
- 5.7. Rest of Asia Pacific
Smart Battery Monitor REPORT HIGHLIGHTS
| Aspects | Details |
|---|---|
| Study Period | 2019-2033 |
| Base Year | 2024 |
| Estimated Year | 2025 |
| Forecast Period | 2025-2033 |
| Historical Period | 2019-2024 |
| Growth Rate | CAGR of 9.8% from 2019-2033 |
| Segmentation |
|
Table of Contents
- 1. Introduction
- 1.1. Research Scope
- 1.2. Market Segmentation
- 1.3. Research Methodology
- 1.4. Definitions and Assumptions
- 2. Executive Summary
- 2.1. Introduction
- 3. Market Dynamics
- 3.1. Introduction
- 3.2. Market Drivers
- 3.3. Market Restrains
- 3.4. Market Trends
- 4. Market Factor Analysis
- 4.1. Porters Five Forces
- 4.2. Supply/Value Chain
- 4.3. PESTEL analysis
- 4.4. Market Entropy
- 4.5. Patent/Trademark Analysis
- 5. Global Smart Battery Monitor Analysis, Insights and Forecast, 2019-2031
- 5.1. Market Analysis, Insights and Forecast - by Application
- 5.1.1. Automotive
- 5.1.2. Electronics
- 5.1.3. Power and Energy
- 5.1.4. Telecommunication
- 5.1.5. Medical
- 5.1.6. Other
- 5.2. Market Analysis, Insights and Forecast - by Type
- 5.2.1. Wired Monitors
- 5.2.2. Wireless Monitors
- 5.3. Market Analysis, Insights and Forecast - by Region
- 5.3.1. North America
- 5.3.2. South America
- 5.3.3. Europe
- 5.3.4. Middle East & Africa
- 5.3.5. Asia Pacific
- 5.1. Market Analysis, Insights and Forecast - by Application
- 6. North America Smart Battery Monitor Analysis, Insights and Forecast, 2019-2031
- 6.1. Market Analysis, Insights and Forecast - by Application
- 6.1.1. Automotive
- 6.1.2. Electronics
- 6.1.3. Power and Energy
- 6.1.4. Telecommunication
- 6.1.5. Medical
- 6.1.6. Other
- 6.2. Market Analysis, Insights and Forecast - by Type
- 6.2.1. Wired Monitors
- 6.2.2. Wireless Monitors
- 6.1. Market Analysis, Insights and Forecast - by Application
- 7. South America Smart Battery Monitor Analysis, Insights and Forecast, 2019-2031
- 7.1. Market Analysis, Insights and Forecast - by Application
- 7.1.1. Automotive
- 7.1.2. Electronics
- 7.1.3. Power and Energy
- 7.1.4. Telecommunication
- 7.1.5. Medical
- 7.1.6. Other
- 7.2. Market Analysis, Insights and Forecast - by Type
- 7.2.1. Wired Monitors
- 7.2.2. Wireless Monitors
- 7.1. Market Analysis, Insights and Forecast - by Application
- 8. Europe Smart Battery Monitor Analysis, Insights and Forecast, 2019-2031
- 8.1. Market Analysis, Insights and Forecast - by Application
- 8.1.1. Automotive
- 8.1.2. Electronics
- 8.1.3. Power and Energy
- 8.1.4. Telecommunication
- 8.1.5. Medical
- 8.1.6. Other
- 8.2. Market Analysis, Insights and Forecast - by Type
- 8.2.1. Wired Monitors
- 8.2.2. Wireless Monitors
- 8.1. Market Analysis, Insights and Forecast - by Application
- 9. Middle East & Africa Smart Battery Monitor Analysis, Insights and Forecast, 2019-2031
- 9.1. Market Analysis, Insights and Forecast - by Application
- 9.1.1. Automotive
- 9.1.2. Electronics
- 9.1.3. Power and Energy
- 9.1.4. Telecommunication
- 9.1.5. Medical
- 9.1.6. Other
- 9.2. Market Analysis, Insights and Forecast - by Type
- 9.2.1. Wired Monitors
- 9.2.2. Wireless Monitors
- 9.1. Market Analysis, Insights and Forecast - by Application
- 10. Asia Pacific Smart Battery Monitor Analysis, Insights and Forecast, 2019-2031
- 10.1. Market Analysis, Insights and Forecast - by Application
- 10.1.1. Automotive
- 10.1.2. Electronics
- 10.1.3. Power and Energy
- 10.1.4. Telecommunication
- 10.1.5. Medical
- 10.1.6. Other
- 10.2. Market Analysis, Insights and Forecast - by Type
- 10.2.1. Wired Monitors
- 10.2.2. Wireless Monitors
- 10.1. Market Analysis, Insights and Forecast - by Application
- 11. Competitive Analysis
- 11.1. Global Market Share Analysis 2024
- 11.2. Company Profiles
- 11.2.1 Victron Energy
- 11.2.1.1. Overview
- 11.2.1.2. Products
- 11.2.1.3. SWOT Analysis
- 11.2.1.4. Recent Developments
- 11.2.1.5. Financials (Based on Availability)
- 11.2.2 Simarine
- 11.2.2.1. Overview
- 11.2.2.2. Products
- 11.2.2.3. SWOT Analysis
- 11.2.2.4. Recent Developments
- 11.2.2.5. Financials (Based on Availability)
- 11.2.3 Nasa Marine Instrumen
- 11.2.3.1. Overview
- 11.2.3.2. Products
- 11.2.3.3. SWOT Analysis
- 11.2.3.4. Recent Developments
- 11.2.3.5. Financials (Based on Availability)
- 11.2.4 BTECH
- 11.2.4.1. Overview
- 11.2.4.2. Products
- 11.2.4.3. SWOT Analysis
- 11.2.4.4. Recent Developments
- 11.2.4.5. Financials (Based on Availability)
- 11.2.5 Carling Technologies
- 11.2.5.1. Overview
- 11.2.5.2. Products
- 11.2.5.3. SWOT Analysis
- 11.2.5.4. Recent Developments
- 11.2.5.5. Financials (Based on Availability)
- 11.2.6 Schneider Electric
- 11.2.6.1. Overview
- 11.2.6.2. Products
- 11.2.6.3. SWOT Analysis
- 11.2.6.4. Recent Developments
- 11.2.6.5. Financials (Based on Availability)
- 11.2.7 Mastervolt
- 11.2.7.1. Overview
- 11.2.7.2. Products
- 11.2.7.3. SWOT Analysis
- 11.2.7.4. Recent Developments
- 11.2.7.5. Financials (Based on Availability)
- 11.2.8 REDARC Electronics
- 11.2.8.1. Overview
- 11.2.8.2. Products
- 11.2.8.3. SWOT Analysis
- 11.2.8.4. Recent Developments
- 11.2.8.5. Financials (Based on Availability)
- 11.2.9 Blue Sea Systems
- 11.2.9.1. Overview
- 11.2.9.2. Products
- 11.2.9.3. SWOT Analysis
- 11.2.9.4. Recent Developments
- 11.2.9.5. Financials (Based on Availability)
- 11.2.10 Merlin Power
- 11.2.10.1. Overview
- 11.2.10.2. Products
- 11.2.10.3. SWOT Analysis
- 11.2.10.4. Recent Developments
- 11.2.10.5. Financials (Based on Availability)
- 11.2.1 Victron Energy
List of Figures
- Figure 1: Global Smart Battery Monitor Revenue Breakdown (million, %) by Region 2024 & 2032
- Figure 2: North America Smart Battery Monitor Revenue (million), by Application 2024 & 2032
- Figure 3: North America Smart Battery Monitor Revenue Share (%), by Application 2024 & 2032
- Figure 4: North America Smart Battery Monitor Revenue (million), by Type 2024 & 2032
- Figure 5: North America Smart Battery Monitor Revenue Share (%), by Type 2024 & 2032
- Figure 6: North America Smart Battery Monitor Revenue (million), by Country 2024 & 2032
- Figure 7: North America Smart Battery Monitor Revenue Share (%), by Country 2024 & 2032
- Figure 8: South America Smart Battery Monitor Revenue (million), by Application 2024 & 2032
- Figure 9: South America Smart Battery Monitor Revenue Share (%), by Application 2024 & 2032
- Figure 10: South America Smart Battery Monitor Revenue (million), by Type 2024 & 2032
- Figure 11: South America Smart Battery Monitor Revenue Share (%), by Type 2024 & 2032
- Figure 12: South America Smart Battery Monitor Revenue (million), by Country 2024 & 2032
- Figure 13: South America Smart Battery Monitor Revenue Share (%), by Country 2024 & 2032
- Figure 14: Europe Smart Battery Monitor Revenue (million), by Application 2024 & 2032
- Figure 15: Europe Smart Battery Monitor Revenue Share (%), by Application 2024 & 2032
- Figure 16: Europe Smart Battery Monitor Revenue (million), by Type 2024 & 2032
- Figure 17: Europe Smart Battery Monitor Revenue Share (%), by Type 2024 & 2032
- Figure 18: Europe Smart Battery Monitor Revenue (million), by Country 2024 & 2032
- Figure 19: Europe Smart Battery Monitor Revenue Share (%), by Country 2024 & 2032
- Figure 20: Middle East & Africa Smart Battery Monitor Revenue (million), by Application 2024 & 2032
- Figure 21: Middle East & Africa Smart Battery Monitor Revenue Share (%), by Application 2024 & 2032
- Figure 22: Middle East & Africa Smart Battery Monitor Revenue (million), by Type 2024 & 2032
- Figure 23: Middle East & Africa Smart Battery Monitor Revenue Share (%), by Type 2024 & 2032
- Figure 24: Middle East & Africa Smart Battery Monitor Revenue (million), by Country 2024 & 2032
- Figure 25: Middle East & Africa Smart Battery Monitor Revenue Share (%), by Country 2024 & 2032
- Figure 26: Asia Pacific Smart Battery Monitor Revenue (million), by Application 2024 & 2032
- Figure 27: Asia Pacific Smart Battery Monitor Revenue Share (%), by Application 2024 & 2032
- Figure 28: Asia Pacific Smart Battery Monitor Revenue (million), by Type 2024 & 2032
- Figure 29: Asia Pacific Smart Battery Monitor Revenue Share (%), by Type 2024 & 2032
- Figure 30: Asia Pacific Smart Battery Monitor Revenue (million), by Country 2024 & 2032
- Figure 31: Asia Pacific Smart Battery Monitor Revenue Share (%), by Country 2024 & 2032
List of Tables
- Table 1: Global Smart Battery Monitor Revenue million Forecast, by Region 2019 & 2032
- Table 2: Global Smart Battery Monitor Revenue million Forecast, by Application 2019 & 2032
- Table 3: Global Smart Battery Monitor Revenue million Forecast, by Type 2019 & 2032
- Table 4: Global Smart Battery Monitor Revenue million Forecast, by Region 2019 & 2032
- Table 5: Global Smart Battery Monitor Revenue million Forecast, by Application 2019 & 2032
- Table 6: Global Smart Battery Monitor Revenue million Forecast, by Type 2019 & 2032
- Table 7: Global Smart Battery Monitor Revenue million Forecast, by Country 2019 & 2032
- Table 8: United States Smart Battery Monitor Revenue (million) Forecast, by Application 2019 & 2032
- Table 9: Canada Smart Battery Monitor Revenue (million) Forecast, by Application 2019 & 2032
- Table 10: Mexico Smart Battery Monitor Revenue (million) Forecast, by Application 2019 & 2032
- Table 11: Global Smart Battery Monitor Revenue million Forecast, by Application 2019 & 2032
- Table 12: Global Smart Battery Monitor Revenue million Forecast, by Type 2019 & 2032
- Table 13: Global Smart Battery Monitor Revenue million Forecast, by Country 2019 & 2032
- Table 14: Brazil Smart Battery Monitor Revenue (million) Forecast, by Application 2019 & 2032
- Table 15: Argentina Smart Battery Monitor Revenue (million) Forecast, by Application 2019 & 2032
- Table 16: Rest of South America Smart Battery Monitor Revenue (million) Forecast, by Application 2019 & 2032
- Table 17: Global Smart Battery Monitor Revenue million Forecast, by Application 2019 & 2032
- Table 18: Global Smart Battery Monitor Revenue million Forecast, by Type 2019 & 2032
- Table 19: Global Smart Battery Monitor Revenue million Forecast, by Country 2019 & 2032
- Table 20: United Kingdom Smart Battery Monitor Revenue (million) Forecast, by Application 2019 & 2032
- Table 21: Germany Smart Battery Monitor Revenue (million) Forecast, by Application 2019 & 2032
- Table 22: France Smart Battery Monitor Revenue (million) Forecast, by Application 2019 & 2032
- Table 23: Italy Smart Battery Monitor Revenue (million) Forecast, by Application 2019 & 2032
- Table 24: Spain Smart Battery Monitor Revenue (million) Forecast, by Application 2019 & 2032
- Table 25: Russia Smart Battery Monitor Revenue (million) Forecast, by Application 2019 & 2032
- Table 26: Benelux Smart Battery Monitor Revenue (million) Forecast, by Application 2019 & 2032
- Table 27: Nordics Smart Battery Monitor Revenue (million) Forecast, by Application 2019 & 2032
- Table 28: Rest of Europe Smart Battery Monitor Revenue (million) Forecast, by Application 2019 & 2032
- Table 29: Global Smart Battery Monitor Revenue million Forecast, by Application 2019 & 2032
- Table 30: Global Smart Battery Monitor Revenue million Forecast, by Type 2019 & 2032
- Table 31: Global Smart Battery Monitor Revenue million Forecast, by Country 2019 & 2032
- Table 32: Turkey Smart Battery Monitor Revenue (million) Forecast, by Application 2019 & 2032
- Table 33: Israel Smart Battery Monitor Revenue (million) Forecast, by Application 2019 & 2032
- Table 34: GCC Smart Battery Monitor Revenue (million) Forecast, by Application 2019 & 2032
- Table 35: North Africa Smart Battery Monitor Revenue (million) Forecast, by Application 2019 & 2032
- Table 36: South Africa Smart Battery Monitor Revenue (million) Forecast, by Application 2019 & 2032
- Table 37: Rest of Middle East & Africa Smart Battery Monitor Revenue (million) Forecast, by Application 2019 & 2032
- Table 38: Global Smart Battery Monitor Revenue million Forecast, by Application 2019 & 2032
- Table 39: Global Smart Battery Monitor Revenue million Forecast, by Type 2019 & 2032
- Table 40: Global Smart Battery Monitor Revenue million Forecast, by Country 2019 & 2032
- Table 41: China Smart Battery Monitor Revenue (million) Forecast, by Application 2019 & 2032
- Table 42: India Smart Battery Monitor Revenue (million) Forecast, by Application 2019 & 2032
- Table 43: Japan Smart Battery Monitor Revenue (million) Forecast, by Application 2019 & 2032
- Table 44: South Korea Smart Battery Monitor Revenue (million) Forecast, by Application 2019 & 2032
- Table 45: ASEAN Smart Battery Monitor Revenue (million) Forecast, by Application 2019 & 2032
- Table 46: Oceania Smart Battery Monitor Revenue (million) Forecast, by Application 2019 & 2032
- Table 47: Rest of Asia Pacific Smart Battery Monitor Revenue (million) Forecast, by Application 2019 & 2032
Frequently Asked Questions
1. What is the projected Compound Annual Growth Rate (CAGR) of the Smart Battery Monitor?
The projected CAGR is approximately 9.8%.
2. Which companies are prominent players in the Smart Battery Monitor?
Key companies in the market include Victron Energy, Simarine, Nasa Marine Instrumen, BTECH, Carling Technologies, Schneider Electric, Mastervolt, REDARC Electronics, Blue Sea Systems, Merlin Power.
3. What are the main segments of the Smart Battery Monitor?
The market segments include Application, Type.
4. Can you provide details about the market size?
The market size is estimated to be USD 698 million as of 2022.
5. What are some drivers contributing to market growth?
N/A
6. What are the notable trends driving market growth?
N/A
7. Are there any restraints impacting market growth?
N/A
8. Can you provide examples of recent developments in the market?
N/A
9. What pricing options are available for accessing the report?
Pricing options include single-user, multi-user, and enterprise licenses priced at USD 2900.00, USD 4350.00, and USD 5800.00 respectively.
10. Is the market size provided in terms of value or volume?
The market size is provided in terms of value, measured in million.
11. Are there any specific market keywords associated with the report?
Yes, the market keyword associated with the report is "Smart Battery Monitor," which aids in identifying and referencing the specific market segment covered.
12. How do I determine which pricing option suits my needs best?
The pricing options vary based on user requirements and access needs. Individual users may opt for single-user licenses, while businesses requiring broader access may choose multi-user or enterprise licenses for cost-effective access to the report.
13. Are there any additional resources or data provided in the Smart Battery Monitor report?
While the report offers comprehensive insights, it's advisable to review the specific contents or supplementary materials provided to ascertain if additional resources or data are available.
14. How can I stay updated on further developments or reports in the Smart Battery Monitor?
To stay informed about further developments, trends, and reports in the Smart Battery Monitor, consider subscribing to industry newsletters, following relevant companies and organizations, or regularly checking reputable industry news sources and publications.
Methodology
Step 1 - Identification of Relevant Samples Size from Population Database


Step 2 - Approaches for Defining Global Market Size (Value, Volume* & Price*)

Note*: In applicable scenarios
Step 3 - Data Sources
Primary Research
- Web Analytics
- Survey Reports
- Research Institute
- Latest Research Reports
- Opinion Leaders
Secondary Research
- Annual Reports
- White Paper
- Latest Press Release
- Industry Association
- Paid Database
- Investor Presentations

Step 4 - Data Triangulation
Involves using different sources of information in order to increase the validity of a study
These sources are likely to be stakeholders in a program - participants, other researchers, program staff, other community members, and so on.
Then we put all data in single framework & apply various statistical tools to find out the dynamic on the market.
During the analysis stage, feedback from the stakeholder groups would be compared to determine areas of agreement as well as areas of divergence
