

Key Insights
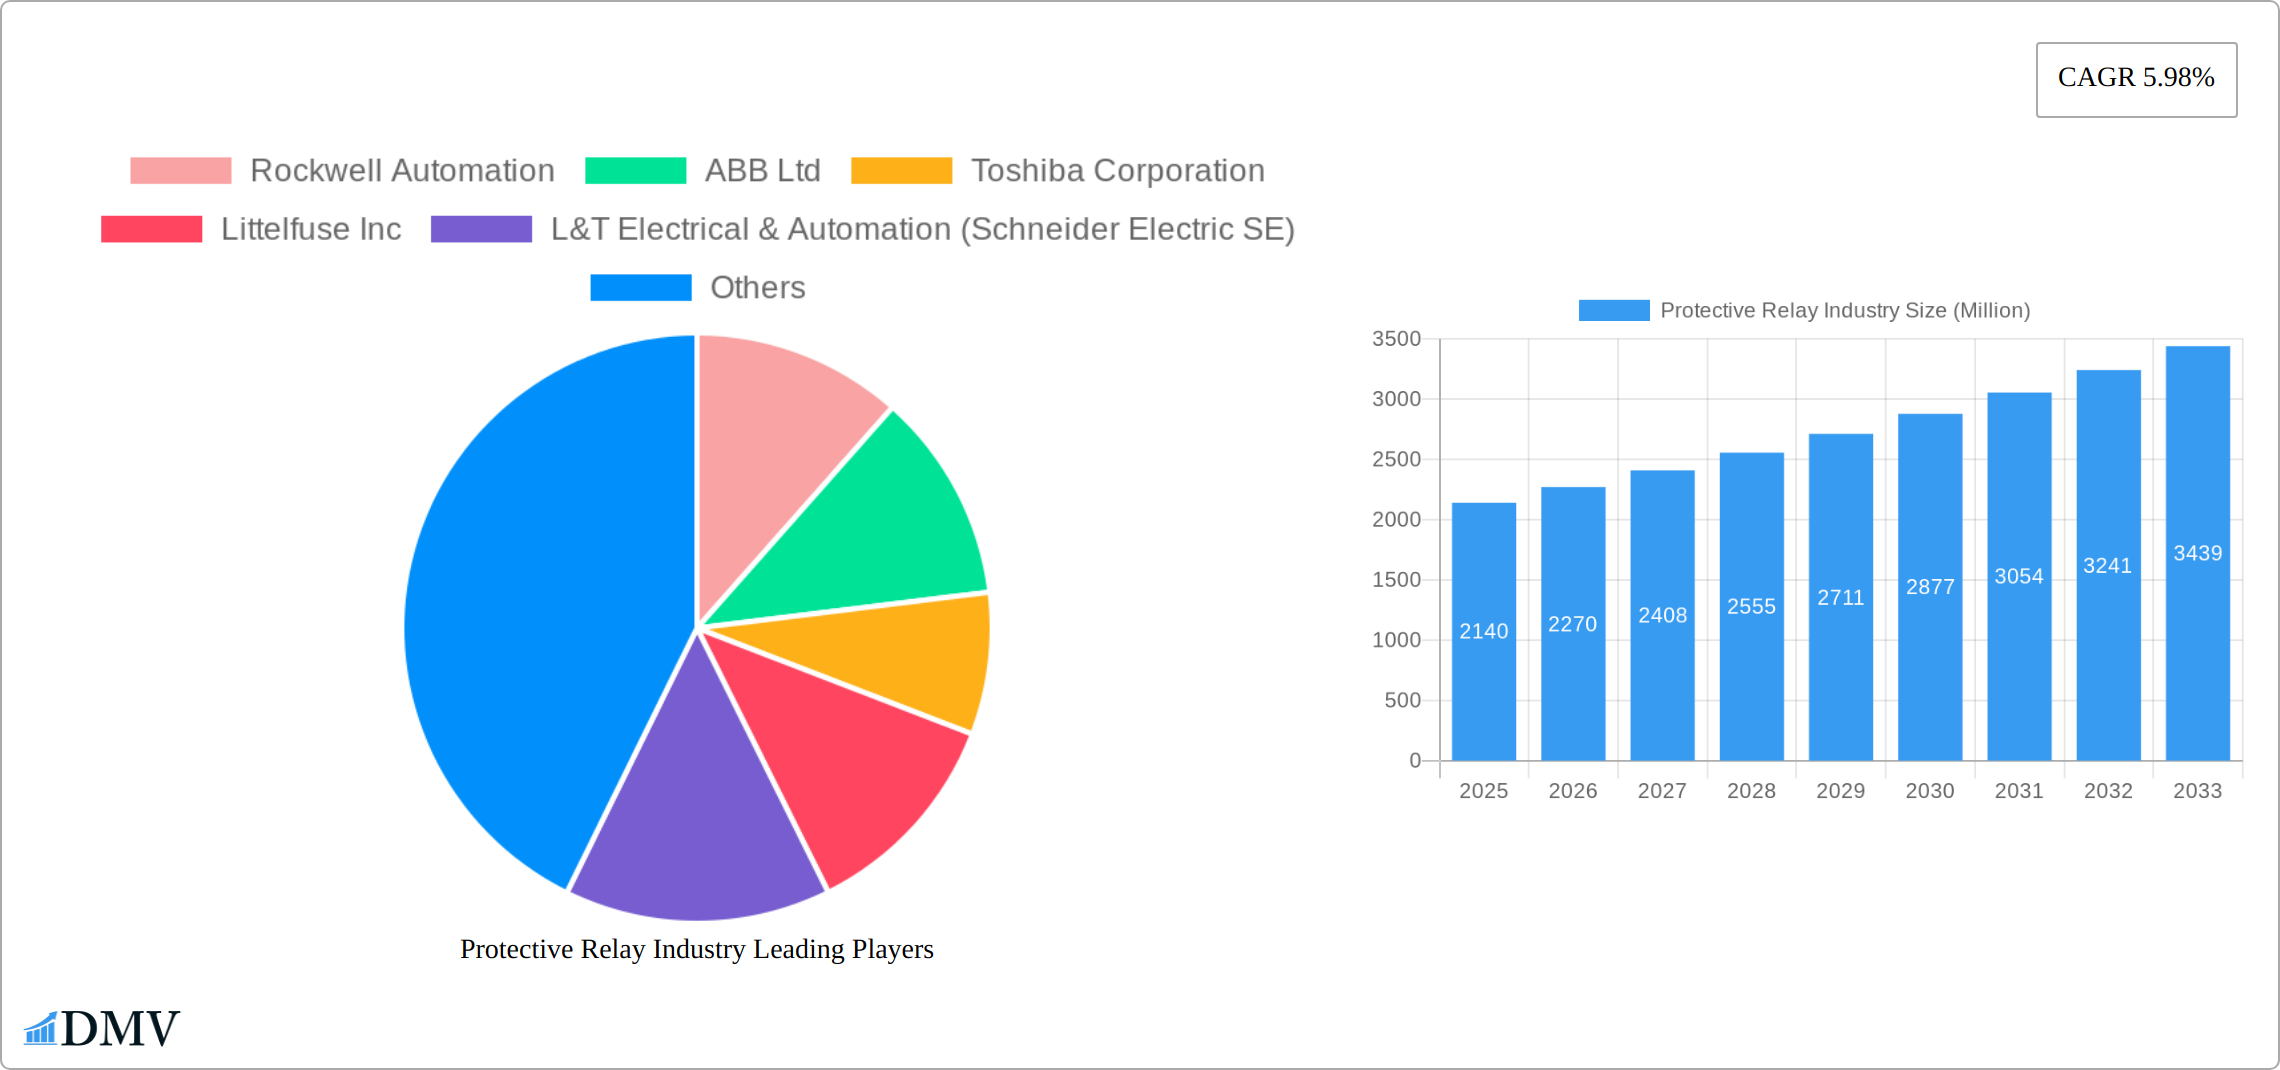
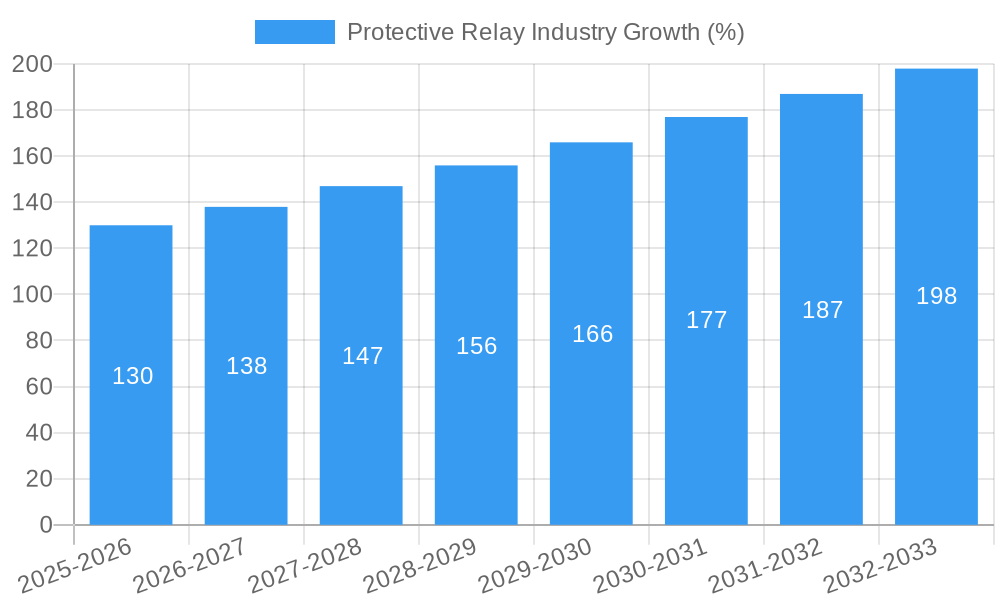
The global protective relay market, valued at $2.14 billion in 2025, is projected to experience robust growth, driven by the increasing demand for reliable and efficient power grids and the expanding industrial automation sector. A compound annual growth rate (CAGR) of 5.98% from 2025 to 2033 indicates significant market expansion. Key drivers include the rising adoption of smart grids, the growing need for enhanced power system protection against cyber threats and natural disasters, and stringent government regulations emphasizing grid modernization and safety. The market is segmented by voltage range (low, medium, and high voltage) and end-user (utilities and industrial). The utilities sector is expected to dominate due to the critical need for protective relays in maintaining the stability and reliability of power distribution networks. Technological advancements, such as the integration of advanced communication protocols and digital protection schemes, are creating new growth opportunities. Furthermore, the increasing penetration of renewable energy sources necessitates sophisticated protective relay systems capable of handling the intermittent nature of these sources. Geographic growth will vary, with regions like Asia-Pacific witnessing faster growth due to rapid industrialization and infrastructure development. North America and Europe will maintain significant market share due to established grids and technological advancements. However, the market faces certain restraints, including high initial investment costs associated with advanced relay technologies and the complexities involved in integration and maintenance. Despite these challenges, the market's long-term outlook remains positive, fuelled by sustained investments in grid modernization and industrial automation.
The competitive landscape is characterized by the presence of both established players like ABB, Siemens, and Schneider Electric, and specialized companies like Schweitzer Engineering Laboratories. These companies are engaged in continuous research and development to enhance the functionality and reliability of their protective relay systems, often incorporating features like artificial intelligence and machine learning for improved performance and predictive maintenance. This competitive intensity drives innovation and ensures the market offers a wide range of solutions catering to diverse customer needs and applications. The strategic partnerships and mergers & acquisitions within the industry further contribute to its consolidation and expansion, reinforcing the market's growth trajectory. Future market growth will be determined by factors such as the pace of grid modernization initiatives globally, the adoption of smart grid technologies, and the continuous development of more resilient and intelligent protection systems.
Protective Relay Industry Market Report: 2019-2033
This comprehensive report provides an in-depth analysis of the global Protective Relay Industry, offering invaluable insights for stakeholders seeking to navigate this dynamic market. With a study period spanning 2019-2033, a base year of 2025, and a forecast period of 2025-2033, this report delivers a robust understanding of past performance, current market conditions, and future growth potential. The market is valued at xx Million in 2025 and is projected to reach xx Million by 2033.
Protective Relay Industry Market Composition & Trends
This section analyzes the competitive landscape, innovation drivers, regulatory frameworks, and market dynamics within the protective relay industry. The market exhibits a moderately concentrated structure, with key players like Rockwell Automation, ABB Ltd, and Siemens AG holding significant market share. However, smaller specialized companies are also gaining traction with niche innovations.
Market Share Distribution (2025): Rockwell Automation (15%), ABB Ltd (12%), Siemens AG (10%), Others (63%). These figures represent estimated market share based on revenue. The remaining 63% is distributed among numerous smaller players.
M&A Activity (2019-2024): A total of xx Million USD in M&A deals were recorded during this period, reflecting a strategy of expansion and technological integration within the industry. Specific deal values are not publicly available for all transactions, impacting precision of calculation.
Innovation Catalysts: Stringent safety regulations, increasing demand for grid modernization, and the adoption of smart grid technologies are driving innovation in areas such as improved cybersecurity, advanced analytics, and predictive maintenance.
Regulatory Landscape: Government mandates for grid reliability and safety standards are shaping product development and market growth. Compliance costs and regulations vary across regions, influencing market growth and investment.
Substitute Products: While no direct substitutes exist, alternative protection schemes (such as fuses) represent a competitive factor, particularly in low-voltage applications and smaller installations.
End-User Profiles: The utilities sector dominates the market, followed by the industrial sector with varying demands based on specific application needs (e.g., oil & gas, manufacturing).
Protective Relay Industry Industry Evolution
The protective relay industry has experienced robust and dynamic growth between 2019 and 2024, a period characterized by significant technological advancements and a growing demand for more sophisticated grid management solutions. The market demonstrated a Compound Annual Growth Rate (CAGR) of xx% during this historical period. Key growth catalysts include the escalating global demand for electricity, substantial investments in renewable energy infrastructure, and the widespread adoption of smart grid technologies. Furthermore, the integration of digital technologies, advanced communication protocols, and the emergence of AI-powered predictive maintenance capabilities have been instrumental in shaping the industry's trajectory. The prevailing market trend indicates a definitive shift towards digitalization, marked by enhanced communication capabilities, and superior monitoring and control features in protective relays, thereby significantly improving grid efficiency, reliability, and overall performance. The persistent demand for elevated safety features and enhanced accuracy in protection mechanisms continues to be a primary driver for market expansion. Future growth projections are intrinsically linked to several critical variables, including global economic conditions, supportive governmental policies, and strategic infrastructure spending. We project the market will grow at a CAGR of xx% between 2025 and 2033.
Leading Regions, Countries, or Segments in Protective Relay Industry
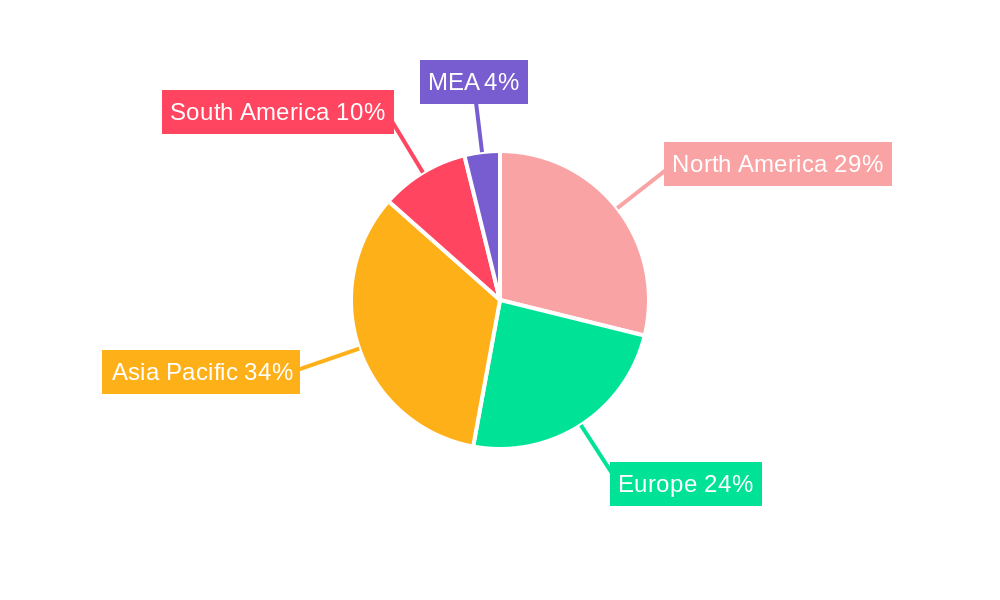
North America currently holds a dominant position in the protective relay market, largely propelled by substantial infrastructure investments, an aging grid requiring modernization, and stringent safety and reliability regulations. Europe and the Asia-Pacific region follow closely, with the Asia-Pacific region anticipated to witness particularly vigorous growth due to rapid industrialization, expanding urbanization, and significant investments in the development and expansion of power grids. This growth is further amplified by the increasing adoption of smart grid technologies and the burgeoning renewable energy sector.
-
Key Drivers by Region:
- North America: Stringent regulatory compliance demands, substantial investments in grid modernization and digitalization, and a strong emphasis on enhancing grid resilience and cybersecurity.
- Europe: Robust environmental regulations, a strong commitment to renewable energy integration, and significant upgrades to aging power infrastructure.
- Asia-Pacific: Rapid industrialization and economic growth, burgeoning urbanization leading to increased electricity demand, and extensive investments in expanding and modernizing power grids to support economic development.
-
Key Drivers by Segment:
- High-voltage: Primarily driven by utility companies, with a critical need for reliable grid stability, advanced protection against faults, and integration of large-scale renewable energy sources.
- Medium-voltage: Experiencing significant demand from diverse industrial sectors, especially in manufacturing, mining, and processing plants, where operational continuity and safety are paramount.
- Low-voltage: Growth propelled by increasing adoption in building automation, smart homes, and commercial applications, focusing on safety, energy efficiency, and remote monitoring.
- Utilities: Representing the largest end-user segment, driven by ongoing infrastructure maintenance, expansion projects, the integration of distributed energy resources, and the need for enhanced grid control.
- Industrial: Demonstrating strong demand across various sectors, fueled by the pursuit of operational efficiency, enhanced safety protocols, cost reduction through predictive maintenance, and compliance with industry-specific regulations.
The sustained dominance of North America is primarily attributed to its proactive approach to infrastructure development, proactive adoption of advanced technologies, and rigorous adherence to regulatory standards for grid safety and protection. Significant investments in the power sector, coupled with a thriving manufacturing and industrial base, further solidify the region's market leadership. The early adoption of sophisticated digital relays and smart grid solutions has also been a key differentiator.
Protective Relay Industry Product Innovations
Recent innovations focus on enhancing safety, reliability, and efficiency. The integration of digital technologies has led to more sophisticated protection schemes, advanced communication protocols, and improved monitoring capabilities. The development of arc flash mitigation technologies, such as Rockwell Automation's ArcShield, exemplifies the focus on enhancing workforce safety. Furthermore, the introduction of smaller, more efficient relays is addressing demands for space optimization and reduced installation costs.
Propelling Factors for Protective Relay Industry Growth
The protective relay market is driven by several factors: increasing electricity demand globally, investments in smart grid technologies, stringent safety regulations, and the rising adoption of renewable energy sources. The need for improved grid reliability and efficiency, coupled with growing concerns regarding cyber threats to critical infrastructure, are further fueling market expansion.
Obstacles in the Protective Relay Industry Market
Challenges include the high cost of advanced technologies, the complexity of integrating new systems into existing infrastructure, and the potential for supply chain disruptions. Furthermore, competition among established players and the emergence of new entrants can exert downward pressure on prices.
Future Opportunities in Protective Relay Industry
Emerging opportunities within the protective relay industry are centered on the development and deployment of highly intelligent, interconnected, and self-optimizing protection systems that can adeptly manage the escalating complexity and dynamic nature of modern power grids. The deep integration of advanced artificial intelligence (AI) and machine learning (ML) algorithms presents a significant potential for revolutionizing predictive maintenance, thereby minimizing downtime and operational costs. These technologies will also enhance situational awareness, enable proactive fault detection and mitigation, and significantly improve overall grid resilience against disturbances and cyber threats. Furthermore, the expansion into rapidly growing emerging markets and the increasing demand for specialized solutions to seamlessly integrate diverse renewable energy sources (such as solar, wind, and battery storage) represent substantial avenues for future growth and innovation.
Major Players in the Protective Relay Industry Ecosystem
- Rockwell Automation
- ABB Ltd
- Toshiba Corporation
- Littelfuse Inc
- L&T Electrical & Automation (Schneider Electric SE)
- Mitsubishi Electric Corporation
- Siemens AG
- Schneider Electric SE
- Eaton Corporation PLC
- Bender GmbH & Co KG
- NR Electric Co Lt
- Schweitzer Engineering Laboratories
- General Electric Company
- Fanox Electronics
Key Developments in Protective Relay Industry Industry
- August 2023: Rockwell Automation launched ArcShield technology for enhanced arc flash safety in motor control centers.
- January 2024: Fanox Electronics introduced the SIR-C Overhead Control and Feeder Protection system, an advanced high-protection relay solution.
Strategic Protective Relay Industry Market Forecast
The protective relay market is strategically positioned for sustained and accelerated growth, propelled by continuous technological innovation, the imperative expansion of global grid infrastructure, and a burgeoning demand for enhanced safety, unwavering reliability, and improved operational efficiency. The pervasive integration of Artificial Intelligence (AI) and the Internet of Things (IoT) will be pivotal in shaping future market dynamics, enabling more intelligent and responsive grid management. The market is anticipated to witness substantial expansion, particularly in developing economies, as investments in modernizing and expanding power infrastructure continue to surge. Furthermore, the increasing global emphasis on sustainability and the widespread integration of renewable energy sources will significantly drive the demand for advanced, adaptable, and highly sophisticated protection solutions designed to ensure grid stability and efficiency in an evolving energy landscape.
Protective Relay Industry Segmentation
-
1. Voltage Range
- 1.1. Low-voltage
- 1.2. Medium-voltage
- 1.3. High-voltage
-
2. End User
- 2.1. Utilities
- 2.2. Industrial
Protective Relay Industry Segmentation By Geography
-
1. North America
- 1.1. United States
- 1.2. Canada
-
2. Europe
- 2.1. United Kingdom
- 2.2. Germany
- 2.3. France
-
3. Asia
- 3.1. China
- 3.2. Japan
- 3.3. India
- 4. Australia and New Zealand
- 5. Latin America
- 6. Middle East and Africa
Protective Relay Industry REPORT HIGHLIGHTS
| Aspects | Details |
|---|---|
| Study Period | 2019-2033 |
| Base Year | 2024 |
| Estimated Year | 2025 |
| Forecast Period | 2025-2033 |
| Historical Period | 2019-2024 |
| Growth Rate | CAGR of 5.98% from 2019-2033 |
| Segmentation |
|
Table of Contents
- 1. Introduction
- 1.1. Research Scope
- 1.2. Market Segmentation
- 1.3. Research Methodology
- 1.4. Definitions and Assumptions
- 2. Executive Summary
- 2.1. Introduction
- 3. Market Dynamics
- 3.1. Introduction
- 3.2. Market Drivers
- 3.2.1. Growth in Electricity Consumption; Increasing Use of Renewable Energy Sources
- 3.3. Market Restrains
- 3.3.1. Higher Cost and Increasing Competition from Unorganized Sector
- 3.4. Market Trends
- 3.4.1. Utilities Segment to Hold Significant Market Share
- 4. Market Factor Analysis
- 4.1. Porters Five Forces
- 4.2. Supply/Value Chain
- 4.3. PESTEL analysis
- 4.4. Market Entropy
- 4.5. Patent/Trademark Analysis
- 5. Global Protective Relay Industry Analysis, Insights and Forecast, 2019-2031
- 5.1. Market Analysis, Insights and Forecast - by Voltage Range
- 5.1.1. Low-voltage
- 5.1.2. Medium-voltage
- 5.1.3. High-voltage
- 5.2. Market Analysis, Insights and Forecast - by End User
- 5.2.1. Utilities
- 5.2.2. Industrial
- 5.3. Market Analysis, Insights and Forecast - by Region
- 5.3.1. North America
- 5.3.2. Europe
- 5.3.3. Asia
- 5.3.4. Australia and New Zealand
- 5.3.5. Latin America
- 5.3.6. Middle East and Africa
- 5.1. Market Analysis, Insights and Forecast - by Voltage Range
- 6. North America Protective Relay Industry Analysis, Insights and Forecast, 2019-2031
- 6.1. Market Analysis, Insights and Forecast - by Voltage Range
- 6.1.1. Low-voltage
- 6.1.2. Medium-voltage
- 6.1.3. High-voltage
- 6.2. Market Analysis, Insights and Forecast - by End User
- 6.2.1. Utilities
- 6.2.2. Industrial
- 6.1. Market Analysis, Insights and Forecast - by Voltage Range
- 7. Europe Protective Relay Industry Analysis, Insights and Forecast, 2019-2031
- 7.1. Market Analysis, Insights and Forecast - by Voltage Range
- 7.1.1. Low-voltage
- 7.1.2. Medium-voltage
- 7.1.3. High-voltage
- 7.2. Market Analysis, Insights and Forecast - by End User
- 7.2.1. Utilities
- 7.2.2. Industrial
- 7.1. Market Analysis, Insights and Forecast - by Voltage Range
- 8. Asia Protective Relay Industry Analysis, Insights and Forecast, 2019-2031
- 8.1. Market Analysis, Insights and Forecast - by Voltage Range
- 8.1.1. Low-voltage
- 8.1.2. Medium-voltage
- 8.1.3. High-voltage
- 8.2. Market Analysis, Insights and Forecast - by End User
- 8.2.1. Utilities
- 8.2.2. Industrial
- 8.1. Market Analysis, Insights and Forecast - by Voltage Range
- 9. Australia and New Zealand Protective Relay Industry Analysis, Insights and Forecast, 2019-2031
- 9.1. Market Analysis, Insights and Forecast - by Voltage Range
- 9.1.1. Low-voltage
- 9.1.2. Medium-voltage
- 9.1.3. High-voltage
- 9.2. Market Analysis, Insights and Forecast - by End User
- 9.2.1. Utilities
- 9.2.2. Industrial
- 9.1. Market Analysis, Insights and Forecast - by Voltage Range
- 10. Latin America Protective Relay Industry Analysis, Insights and Forecast, 2019-2031
- 10.1. Market Analysis, Insights and Forecast - by Voltage Range
- 10.1.1. Low-voltage
- 10.1.2. Medium-voltage
- 10.1.3. High-voltage
- 10.2. Market Analysis, Insights and Forecast - by End User
- 10.2.1. Utilities
- 10.2.2. Industrial
- 10.1. Market Analysis, Insights and Forecast - by Voltage Range
- 11. Middle East and Africa Protective Relay Industry Analysis, Insights and Forecast, 2019-2031
- 11.1. Market Analysis, Insights and Forecast - by Voltage Range
- 11.1.1. Low-voltage
- 11.1.2. Medium-voltage
- 11.1.3. High-voltage
- 11.2. Market Analysis, Insights and Forecast - by End User
- 11.2.1. Utilities
- 11.2.2. Industrial
- 11.1. Market Analysis, Insights and Forecast - by Voltage Range
- 12. North America Protective Relay Industry Analysis, Insights and Forecast, 2019-2031
- 12.1. Market Analysis, Insights and Forecast - By Country/Sub-region
- 12.1.1 United States
- 12.1.2 Canada
- 12.1.3 Mexico
- 13. Europe Protective Relay Industry Analysis, Insights and Forecast, 2019-2031
- 13.1. Market Analysis, Insights and Forecast - By Country/Sub-region
- 13.1.1 Germany
- 13.1.2 United Kingdom
- 13.1.3 France
- 13.1.4 Spain
- 13.1.5 Italy
- 13.1.6 Spain
- 13.1.7 Belgium
- 13.1.8 Netherland
- 13.1.9 Nordics
- 13.1.10 Rest of Europe
- 14. Asia Pacific Protective Relay Industry Analysis, Insights and Forecast, 2019-2031
- 14.1. Market Analysis, Insights and Forecast - By Country/Sub-region
- 14.1.1 China
- 14.1.2 Japan
- 14.1.3 India
- 14.1.4 South Korea
- 14.1.5 Southeast Asia
- 14.1.6 Australia
- 14.1.7 Indonesia
- 14.1.8 Phillipes
- 14.1.9 Singapore
- 14.1.10 Thailandc
- 14.1.11 Rest of Asia Pacific
- 15. South America Protective Relay Industry Analysis, Insights and Forecast, 2019-2031
- 15.1. Market Analysis, Insights and Forecast - By Country/Sub-region
- 15.1.1 Brazil
- 15.1.2 Argentina
- 15.1.3 Peru
- 15.1.4 Chile
- 15.1.5 Colombia
- 15.1.6 Ecuador
- 15.1.7 Venezuela
- 15.1.8 Rest of South America
- 16. North America Protective Relay Industry Analysis, Insights and Forecast, 2019-2031
- 16.1. Market Analysis, Insights and Forecast - By Country/Sub-region
- 16.1.1 United States
- 16.1.2 Canada
- 16.1.3 Mexico
- 17. MEA Protective Relay Industry Analysis, Insights and Forecast, 2019-2031
- 17.1. Market Analysis, Insights and Forecast - By Country/Sub-region
- 17.1.1 United Arab Emirates
- 17.1.2 Saudi Arabia
- 17.1.3 South Africa
- 17.1.4 Rest of Middle East and Africa
- 18. Competitive Analysis
- 18.1. Global Market Share Analysis 2024
- 18.2. Company Profiles
- 18.2.1 Rockwell Automation
- 18.2.1.1. Overview
- 18.2.1.2. Products
- 18.2.1.3. SWOT Analysis
- 18.2.1.4. Recent Developments
- 18.2.1.5. Financials (Based on Availability)
- 18.2.2 ABB Ltd
- 18.2.2.1. Overview
- 18.2.2.2. Products
- 18.2.2.3. SWOT Analysis
- 18.2.2.4. Recent Developments
- 18.2.2.5. Financials (Based on Availability)
- 18.2.3 Toshiba Corporation
- 18.2.3.1. Overview
- 18.2.3.2. Products
- 18.2.3.3. SWOT Analysis
- 18.2.3.4. Recent Developments
- 18.2.3.5. Financials (Based on Availability)
- 18.2.4 Littelfuse Inc
- 18.2.4.1. Overview
- 18.2.4.2. Products
- 18.2.4.3. SWOT Analysis
- 18.2.4.4. Recent Developments
- 18.2.4.5. Financials (Based on Availability)
- 18.2.5 L&T Electrical & Automation (Schneider Electric SE)
- 18.2.5.1. Overview
- 18.2.5.2. Products
- 18.2.5.3. SWOT Analysis
- 18.2.5.4. Recent Developments
- 18.2.5.5. Financials (Based on Availability)
- 18.2.6 Mitsubishi Electric Corporation
- 18.2.6.1. Overview
- 18.2.6.2. Products
- 18.2.6.3. SWOT Analysis
- 18.2.6.4. Recent Developments
- 18.2.6.5. Financials (Based on Availability)
- 18.2.7 Siemens AG
- 18.2.7.1. Overview
- 18.2.7.2. Products
- 18.2.7.3. SWOT Analysis
- 18.2.7.4. Recent Developments
- 18.2.7.5. Financials (Based on Availability)
- 18.2.8 Schneider Electric SE
- 18.2.8.1. Overview
- 18.2.8.2. Products
- 18.2.8.3. SWOT Analysis
- 18.2.8.4. Recent Developments
- 18.2.8.5. Financials (Based on Availability)
- 18.2.9 Eaton Corporation PLC
- 18.2.9.1. Overview
- 18.2.9.2. Products
- 18.2.9.3. SWOT Analysis
- 18.2.9.4. Recent Developments
- 18.2.9.5. Financials (Based on Availability)
- 18.2.10 Bender GmbH & Co KG
- 18.2.10.1. Overview
- 18.2.10.2. Products
- 18.2.10.3. SWOT Analysis
- 18.2.10.4. Recent Developments
- 18.2.10.5. Financials (Based on Availability)
- 18.2.11 NR Electric Co Lt
- 18.2.11.1. Overview
- 18.2.11.2. Products
- 18.2.11.3. SWOT Analysis
- 18.2.11.4. Recent Developments
- 18.2.11.5. Financials (Based on Availability)
- 18.2.12 Schweitzer Engineering Laboratories
- 18.2.12.1. Overview
- 18.2.12.2. Products
- 18.2.12.3. SWOT Analysis
- 18.2.12.4. Recent Developments
- 18.2.12.5. Financials (Based on Availability)
- 18.2.13 General Electric Company
- 18.2.13.1. Overview
- 18.2.13.2. Products
- 18.2.13.3. SWOT Analysis
- 18.2.13.4. Recent Developments
- 18.2.13.5. Financials (Based on Availability)
- 18.2.14 Fanox Electronics
- 18.2.14.1. Overview
- 18.2.14.2. Products
- 18.2.14.3. SWOT Analysis
- 18.2.14.4. Recent Developments
- 18.2.14.5. Financials (Based on Availability)
- 18.2.1 Rockwell Automation
List of Figures
- Figure 1: Global Protective Relay Industry Revenue Breakdown (Million, %) by Region 2024 & 2032
- Figure 2: North America Protective Relay Industry Revenue (Million), by Country 2024 & 2032
- Figure 3: North America Protective Relay Industry Revenue Share (%), by Country 2024 & 2032
- Figure 4: Europe Protective Relay Industry Revenue (Million), by Country 2024 & 2032
- Figure 5: Europe Protective Relay Industry Revenue Share (%), by Country 2024 & 2032
- Figure 6: Asia Pacific Protective Relay Industry Revenue (Million), by Country 2024 & 2032
- Figure 7: Asia Pacific Protective Relay Industry Revenue Share (%), by Country 2024 & 2032
- Figure 8: South America Protective Relay Industry Revenue (Million), by Country 2024 & 2032
- Figure 9: South America Protective Relay Industry Revenue Share (%), by Country 2024 & 2032
- Figure 10: North America Protective Relay Industry Revenue (Million), by Country 2024 & 2032
- Figure 11: North America Protective Relay Industry Revenue Share (%), by Country 2024 & 2032
- Figure 12: MEA Protective Relay Industry Revenue (Million), by Country 2024 & 2032
- Figure 13: MEA Protective Relay Industry Revenue Share (%), by Country 2024 & 2032
- Figure 14: North America Protective Relay Industry Revenue (Million), by Voltage Range 2024 & 2032
- Figure 15: North America Protective Relay Industry Revenue Share (%), by Voltage Range 2024 & 2032
- Figure 16: North America Protective Relay Industry Revenue (Million), by End User 2024 & 2032
- Figure 17: North America Protective Relay Industry Revenue Share (%), by End User 2024 & 2032
- Figure 18: North America Protective Relay Industry Revenue (Million), by Country 2024 & 2032
- Figure 19: North America Protective Relay Industry Revenue Share (%), by Country 2024 & 2032
- Figure 20: Europe Protective Relay Industry Revenue (Million), by Voltage Range 2024 & 2032
- Figure 21: Europe Protective Relay Industry Revenue Share (%), by Voltage Range 2024 & 2032
- Figure 22: Europe Protective Relay Industry Revenue (Million), by End User 2024 & 2032
- Figure 23: Europe Protective Relay Industry Revenue Share (%), by End User 2024 & 2032
- Figure 24: Europe Protective Relay Industry Revenue (Million), by Country 2024 & 2032
- Figure 25: Europe Protective Relay Industry Revenue Share (%), by Country 2024 & 2032
- Figure 26: Asia Protective Relay Industry Revenue (Million), by Voltage Range 2024 & 2032
- Figure 27: Asia Protective Relay Industry Revenue Share (%), by Voltage Range 2024 & 2032
- Figure 28: Asia Protective Relay Industry Revenue (Million), by End User 2024 & 2032
- Figure 29: Asia Protective Relay Industry Revenue Share (%), by End User 2024 & 2032
- Figure 30: Asia Protective Relay Industry Revenue (Million), by Country 2024 & 2032
- Figure 31: Asia Protective Relay Industry Revenue Share (%), by Country 2024 & 2032
- Figure 32: Australia and New Zealand Protective Relay Industry Revenue (Million), by Voltage Range 2024 & 2032
- Figure 33: Australia and New Zealand Protective Relay Industry Revenue Share (%), by Voltage Range 2024 & 2032
- Figure 34: Australia and New Zealand Protective Relay Industry Revenue (Million), by End User 2024 & 2032
- Figure 35: Australia and New Zealand Protective Relay Industry Revenue Share (%), by End User 2024 & 2032
- Figure 36: Australia and New Zealand Protective Relay Industry Revenue (Million), by Country 2024 & 2032
- Figure 37: Australia and New Zealand Protective Relay Industry Revenue Share (%), by Country 2024 & 2032
- Figure 38: Latin America Protective Relay Industry Revenue (Million), by Voltage Range 2024 & 2032
- Figure 39: Latin America Protective Relay Industry Revenue Share (%), by Voltage Range 2024 & 2032
- Figure 40: Latin America Protective Relay Industry Revenue (Million), by End User 2024 & 2032
- Figure 41: Latin America Protective Relay Industry Revenue Share (%), by End User 2024 & 2032
- Figure 42: Latin America Protective Relay Industry Revenue (Million), by Country 2024 & 2032
- Figure 43: Latin America Protective Relay Industry Revenue Share (%), by Country 2024 & 2032
- Figure 44: Middle East and Africa Protective Relay Industry Revenue (Million), by Voltage Range 2024 & 2032
- Figure 45: Middle East and Africa Protective Relay Industry Revenue Share (%), by Voltage Range 2024 & 2032
- Figure 46: Middle East and Africa Protective Relay Industry Revenue (Million), by End User 2024 & 2032
- Figure 47: Middle East and Africa Protective Relay Industry Revenue Share (%), by End User 2024 & 2032
- Figure 48: Middle East and Africa Protective Relay Industry Revenue (Million), by Country 2024 & 2032
- Figure 49: Middle East and Africa Protective Relay Industry Revenue Share (%), by Country 2024 & 2032
List of Tables
- Table 1: Global Protective Relay Industry Revenue Million Forecast, by Region 2019 & 2032
- Table 2: Global Protective Relay Industry Revenue Million Forecast, by Voltage Range 2019 & 2032
- Table 3: Global Protective Relay Industry Revenue Million Forecast, by End User 2019 & 2032
- Table 4: Global Protective Relay Industry Revenue Million Forecast, by Region 2019 & 2032
- Table 5: Global Protective Relay Industry Revenue Million Forecast, by Country 2019 & 2032
- Table 6: United States Protective Relay Industry Revenue (Million) Forecast, by Application 2019 & 2032
- Table 7: Canada Protective Relay Industry Revenue (Million) Forecast, by Application 2019 & 2032
- Table 8: Mexico Protective Relay Industry Revenue (Million) Forecast, by Application 2019 & 2032
- Table 9: Global Protective Relay Industry Revenue Million Forecast, by Country 2019 & 2032
- Table 10: Germany Protective Relay Industry Revenue (Million) Forecast, by Application 2019 & 2032
- Table 11: United Kingdom Protective Relay Industry Revenue (Million) Forecast, by Application 2019 & 2032
- Table 12: France Protective Relay Industry Revenue (Million) Forecast, by Application 2019 & 2032
- Table 13: Spain Protective Relay Industry Revenue (Million) Forecast, by Application 2019 & 2032
- Table 14: Italy Protective Relay Industry Revenue (Million) Forecast, by Application 2019 & 2032
- Table 15: Spain Protective Relay Industry Revenue (Million) Forecast, by Application 2019 & 2032
- Table 16: Belgium Protective Relay Industry Revenue (Million) Forecast, by Application 2019 & 2032
- Table 17: Netherland Protective Relay Industry Revenue (Million) Forecast, by Application 2019 & 2032
- Table 18: Nordics Protective Relay Industry Revenue (Million) Forecast, by Application 2019 & 2032
- Table 19: Rest of Europe Protective Relay Industry Revenue (Million) Forecast, by Application 2019 & 2032
- Table 20: Global Protective Relay Industry Revenue Million Forecast, by Country 2019 & 2032
- Table 21: China Protective Relay Industry Revenue (Million) Forecast, by Application 2019 & 2032
- Table 22: Japan Protective Relay Industry Revenue (Million) Forecast, by Application 2019 & 2032
- Table 23: India Protective Relay Industry Revenue (Million) Forecast, by Application 2019 & 2032
- Table 24: South Korea Protective Relay Industry Revenue (Million) Forecast, by Application 2019 & 2032
- Table 25: Southeast Asia Protective Relay Industry Revenue (Million) Forecast, by Application 2019 & 2032
- Table 26: Australia Protective Relay Industry Revenue (Million) Forecast, by Application 2019 & 2032
- Table 27: Indonesia Protective Relay Industry Revenue (Million) Forecast, by Application 2019 & 2032
- Table 28: Phillipes Protective Relay Industry Revenue (Million) Forecast, by Application 2019 & 2032
- Table 29: Singapore Protective Relay Industry Revenue (Million) Forecast, by Application 2019 & 2032
- Table 30: Thailandc Protective Relay Industry Revenue (Million) Forecast, by Application 2019 & 2032
- Table 31: Rest of Asia Pacific Protective Relay Industry Revenue (Million) Forecast, by Application 2019 & 2032
- Table 32: Global Protective Relay Industry Revenue Million Forecast, by Country 2019 & 2032
- Table 33: Brazil Protective Relay Industry Revenue (Million) Forecast, by Application 2019 & 2032
- Table 34: Argentina Protective Relay Industry Revenue (Million) Forecast, by Application 2019 & 2032
- Table 35: Peru Protective Relay Industry Revenue (Million) Forecast, by Application 2019 & 2032
- Table 36: Chile Protective Relay Industry Revenue (Million) Forecast, by Application 2019 & 2032
- Table 37: Colombia Protective Relay Industry Revenue (Million) Forecast, by Application 2019 & 2032
- Table 38: Ecuador Protective Relay Industry Revenue (Million) Forecast, by Application 2019 & 2032
- Table 39: Venezuela Protective Relay Industry Revenue (Million) Forecast, by Application 2019 & 2032
- Table 40: Rest of South America Protective Relay Industry Revenue (Million) Forecast, by Application 2019 & 2032
- Table 41: Global Protective Relay Industry Revenue Million Forecast, by Country 2019 & 2032
- Table 42: United States Protective Relay Industry Revenue (Million) Forecast, by Application 2019 & 2032
- Table 43: Canada Protective Relay Industry Revenue (Million) Forecast, by Application 2019 & 2032
- Table 44: Mexico Protective Relay Industry Revenue (Million) Forecast, by Application 2019 & 2032
- Table 45: Global Protective Relay Industry Revenue Million Forecast, by Country 2019 & 2032
- Table 46: United Arab Emirates Protective Relay Industry Revenue (Million) Forecast, by Application 2019 & 2032
- Table 47: Saudi Arabia Protective Relay Industry Revenue (Million) Forecast, by Application 2019 & 2032
- Table 48: South Africa Protective Relay Industry Revenue (Million) Forecast, by Application 2019 & 2032
- Table 49: Rest of Middle East and Africa Protective Relay Industry Revenue (Million) Forecast, by Application 2019 & 2032
- Table 50: Global Protective Relay Industry Revenue Million Forecast, by Voltage Range 2019 & 2032
- Table 51: Global Protective Relay Industry Revenue Million Forecast, by End User 2019 & 2032
- Table 52: Global Protective Relay Industry Revenue Million Forecast, by Country 2019 & 2032
- Table 53: United States Protective Relay Industry Revenue (Million) Forecast, by Application 2019 & 2032
- Table 54: Canada Protective Relay Industry Revenue (Million) Forecast, by Application 2019 & 2032
- Table 55: Global Protective Relay Industry Revenue Million Forecast, by Voltage Range 2019 & 2032
- Table 56: Global Protective Relay Industry Revenue Million Forecast, by End User 2019 & 2032
- Table 57: Global Protective Relay Industry Revenue Million Forecast, by Country 2019 & 2032
- Table 58: United Kingdom Protective Relay Industry Revenue (Million) Forecast, by Application 2019 & 2032
- Table 59: Germany Protective Relay Industry Revenue (Million) Forecast, by Application 2019 & 2032
- Table 60: France Protective Relay Industry Revenue (Million) Forecast, by Application 2019 & 2032
- Table 61: Global Protective Relay Industry Revenue Million Forecast, by Voltage Range 2019 & 2032
- Table 62: Global Protective Relay Industry Revenue Million Forecast, by End User 2019 & 2032
- Table 63: Global Protective Relay Industry Revenue Million Forecast, by Country 2019 & 2032
- Table 64: China Protective Relay Industry Revenue (Million) Forecast, by Application 2019 & 2032
- Table 65: Japan Protective Relay Industry Revenue (Million) Forecast, by Application 2019 & 2032
- Table 66: India Protective Relay Industry Revenue (Million) Forecast, by Application 2019 & 2032
- Table 67: Global Protective Relay Industry Revenue Million Forecast, by Voltage Range 2019 & 2032
- Table 68: Global Protective Relay Industry Revenue Million Forecast, by End User 2019 & 2032
- Table 69: Global Protective Relay Industry Revenue Million Forecast, by Country 2019 & 2032
- Table 70: Global Protective Relay Industry Revenue Million Forecast, by Voltage Range 2019 & 2032
- Table 71: Global Protective Relay Industry Revenue Million Forecast, by End User 2019 & 2032
- Table 72: Global Protective Relay Industry Revenue Million Forecast, by Country 2019 & 2032
- Table 73: Global Protective Relay Industry Revenue Million Forecast, by Voltage Range 2019 & 2032
- Table 74: Global Protective Relay Industry Revenue Million Forecast, by End User 2019 & 2032
- Table 75: Global Protective Relay Industry Revenue Million Forecast, by Country 2019 & 2032
Frequently Asked Questions
1. What is the projected Compound Annual Growth Rate (CAGR) of the Protective Relay Industry?
The projected CAGR is approximately 5.98%.
2. Which companies are prominent players in the Protective Relay Industry?
Key companies in the market include Rockwell Automation, ABB Ltd, Toshiba Corporation, Littelfuse Inc, L&T Electrical & Automation (Schneider Electric SE), Mitsubishi Electric Corporation, Siemens AG, Schneider Electric SE, Eaton Corporation PLC, Bender GmbH & Co KG, NR Electric Co Lt, Schweitzer Engineering Laboratories, General Electric Company, Fanox Electronics.
3. What are the main segments of the Protective Relay Industry?
The market segments include Voltage Range, End User.
4. Can you provide details about the market size?
The market size is estimated to be USD 2.14 Million as of 2022.
5. What are some drivers contributing to market growth?
Growth in Electricity Consumption; Increasing Use of Renewable Energy Sources.
6. What are the notable trends driving market growth?
Utilities Segment to Hold Significant Market Share.
7. Are there any restraints impacting market growth?
Higher Cost and Increasing Competition from Unorganized Sector.
8. Can you provide examples of recent developments in the market?
January 2024 - Fanox Electronics succeeded in delivering advanced high-protection relay solutions for diverse applications. Specifically, it presents the SIR-C OverheadControl and FeederProtection system. The SIR-C functions as an overhead control / RTU and feeder protection relay. It incorporates primary and secondary distribution current, voltage, and frequency functions. The relay has an auxiliary power supply of 24 to 230 Vdc/ac, ensuring robust and reliable performance.
9. What pricing options are available for accessing the report?
Pricing options include single-user, multi-user, and enterprise licenses priced at USD 4750, USD 5250, and USD 8750 respectively.
10. Is the market size provided in terms of value or volume?
The market size is provided in terms of value, measured in Million.
11. Are there any specific market keywords associated with the report?
Yes, the market keyword associated with the report is "Protective Relay Industry," which aids in identifying and referencing the specific market segment covered.
12. How do I determine which pricing option suits my needs best?
The pricing options vary based on user requirements and access needs. Individual users may opt for single-user licenses, while businesses requiring broader access may choose multi-user or enterprise licenses for cost-effective access to the report.
13. Are there any additional resources or data provided in the Protective Relay Industry report?
While the report offers comprehensive insights, it's advisable to review the specific contents or supplementary materials provided to ascertain if additional resources or data are available.
14. How can I stay updated on further developments or reports in the Protective Relay Industry?
To stay informed about further developments, trends, and reports in the Protective Relay Industry, consider subscribing to industry newsletters, following relevant companies and organizations, or regularly checking reputable industry news sources and publications.
Methodology
Step 1 - Identification of Relevant Samples Size from Population Database


Step 2 - Approaches for Defining Global Market Size (Value, Volume* & Price*)

Note*: In applicable scenarios
Step 3 - Data Sources
Primary Research
- Web Analytics
- Survey Reports
- Research Institute
- Latest Research Reports
- Opinion Leaders
Secondary Research
- Annual Reports
- White Paper
- Latest Press Release
- Industry Association
- Paid Database
- Investor Presentations

Step 4 - Data Triangulation
Involves using different sources of information in order to increase the validity of a study
These sources are likely to be stakeholders in a program - participants, other researchers, program staff, other community members, and so on.
Then we put all data in single framework & apply various statistical tools to find out the dynamic on the market.
During the analysis stage, feedback from the stakeholder groups would be compared to determine areas of agreement as well as areas of divergence
