

Key Insights
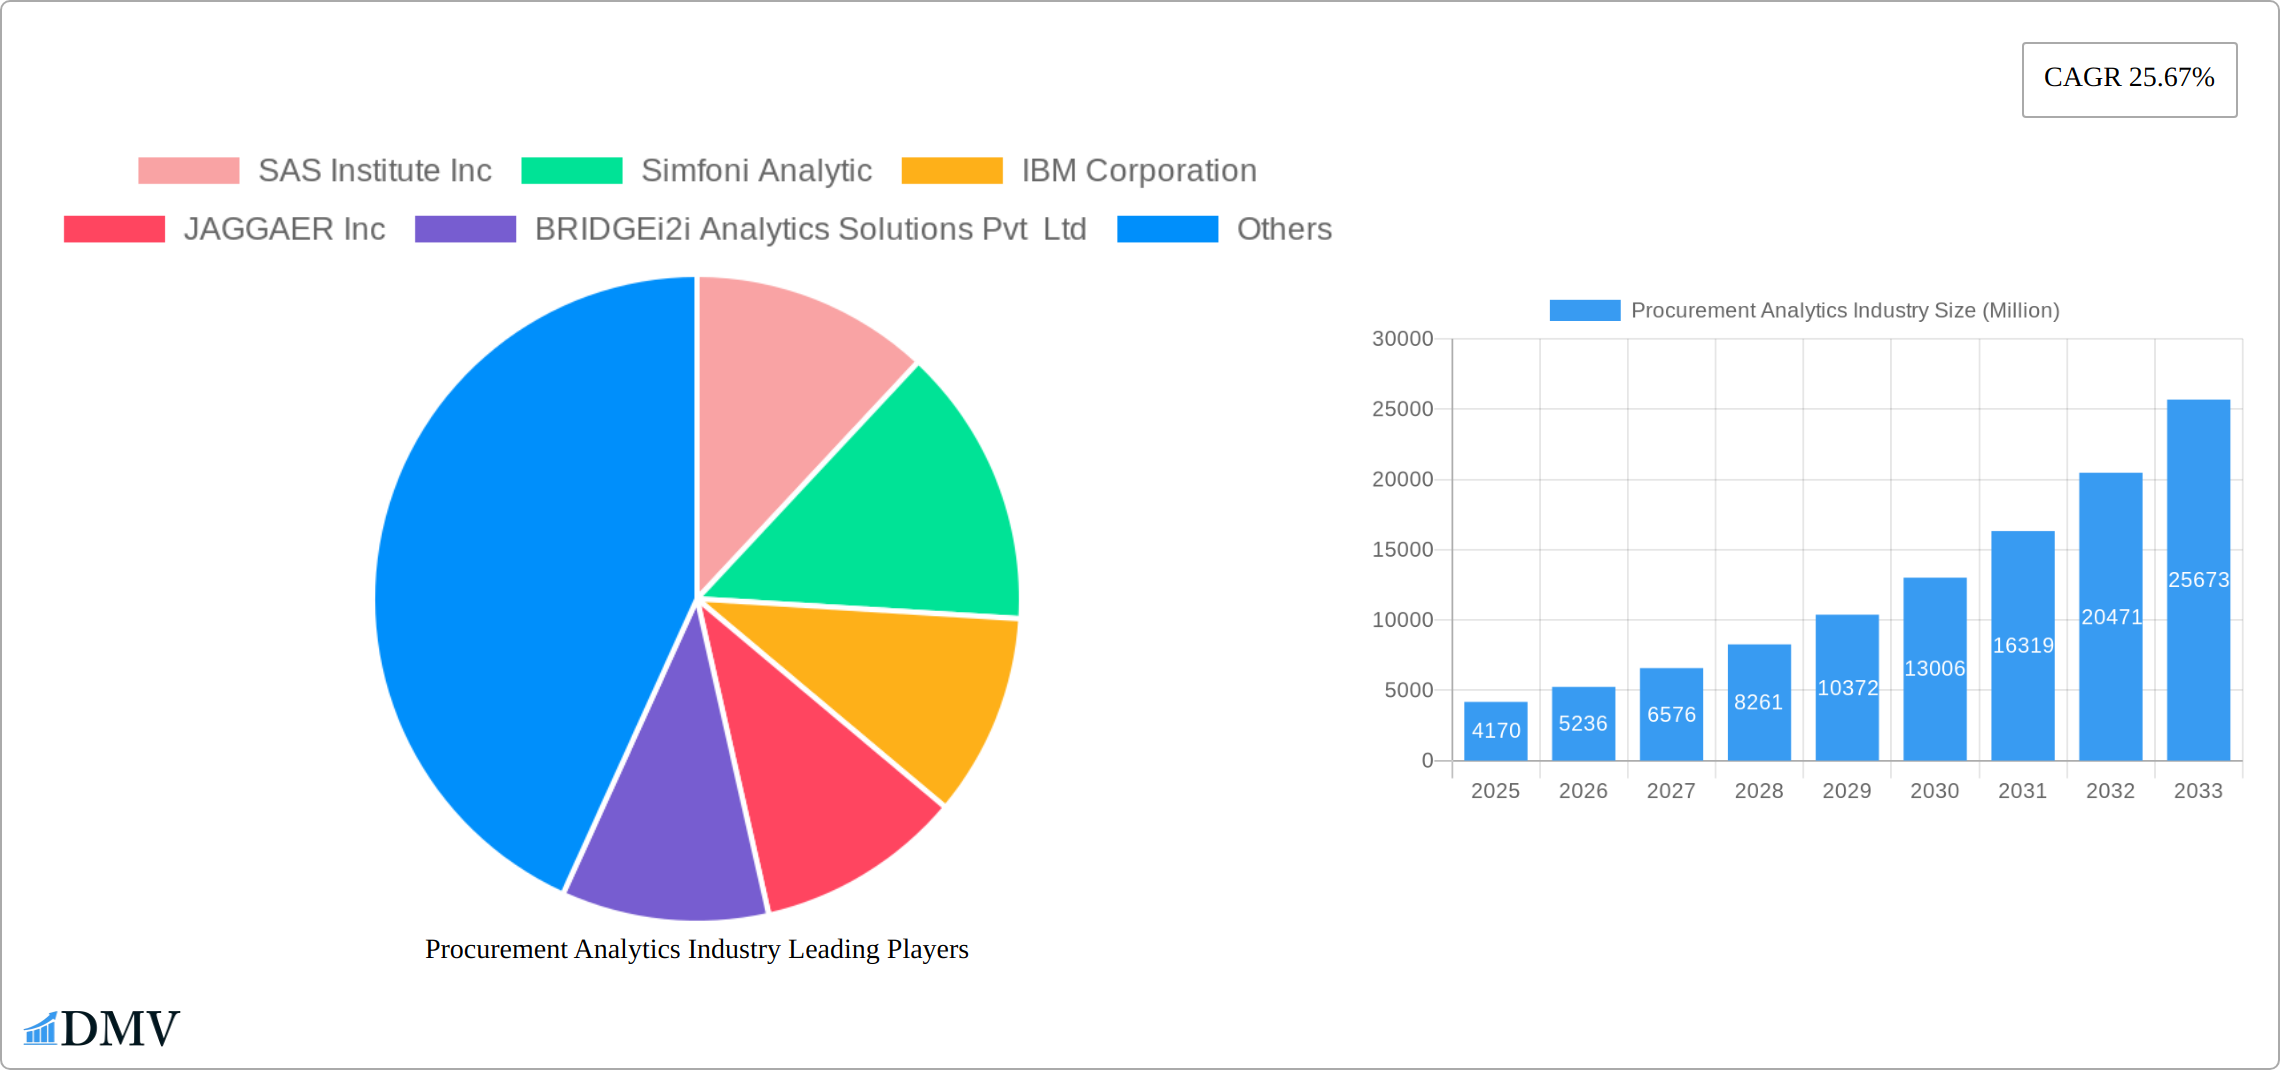
The Procurement Analytics market, valued at $4.17 billion in 2025, is experiencing robust growth, projected to expand at a Compound Annual Growth Rate (CAGR) of 25.67% from 2025 to 2033. This surge is driven by several key factors. The increasing complexity of global supply chains necessitates sophisticated analytics to optimize sourcing, reduce costs, and mitigate risks. Businesses are increasingly adopting cloud-based procurement analytics solutions for enhanced scalability, accessibility, and cost-effectiveness. Furthermore, the rising adoption of advanced technologies like artificial intelligence (AI) and machine learning (ML) within procurement functions is further fueling market growth. Specific application areas like spend analytics and risk analytics are experiencing particularly high demand as organizations seek to improve visibility into their spending patterns and proactively identify and manage potential supply chain disruptions. The manufacturing, transportation & logistics, and retail & e-commerce sectors are significant contributors to market growth, driven by their need for optimized procurement processes and efficient supply chain management.
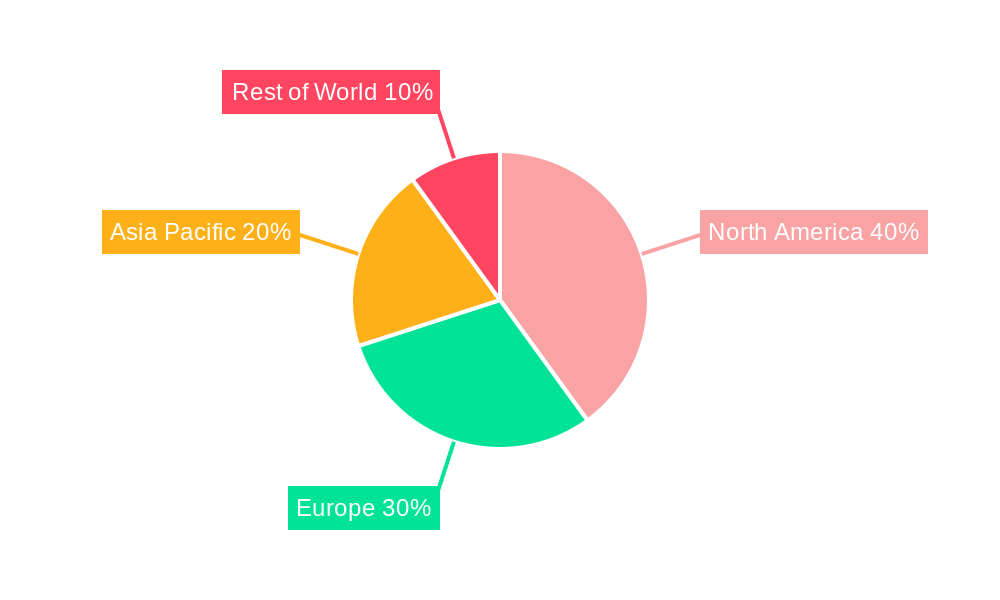
The market segmentation reveals a strong preference for cloud-based deployment models, reflecting the industry's move towards agile and flexible solutions. Software solutions dominate the market, offering a comprehensive suite of tools for data analysis and decision-making. While North America currently holds a significant market share, the Asia-Pacific region is poised for substantial growth driven by increasing digitalization and adoption of advanced technologies across various industries. However, challenges such as data integration complexities, the need for skilled professionals, and concerns around data security remain potential restraints on market expansion. Nevertheless, the overall market outlook for procurement analytics remains overwhelmingly positive, driven by ongoing technological advancements and the growing need for efficiency and cost optimization within procurement operations. Key players like SAS Institute, IBM, and Oracle are actively shaping the market through continuous innovation and strategic partnerships.
Procurement Analytics Industry: A Comprehensive Market Report (2019-2033)
This insightful report provides a detailed analysis of the Procurement Analytics industry, projecting a market value of $XX Million by 2033. The study covers the period from 2019 to 2033, with 2025 serving as both the base and estimated year. We delve into market dynamics, technological advancements, key players, and future growth opportunities, providing stakeholders with actionable intelligence to navigate this rapidly evolving landscape. The report meticulously examines market segmentation by type, deployment, application, and end-user, offering a granular understanding of current trends and future projections.
Procurement Analytics Industry Market Composition & Trends
The Procurement Analytics market presents a dynamic competitive landscape shaped by a moderately concentrated structure and the emergence of innovative players. While established giants like SAS Institute Inc, IBM Corporation, and SAP SE collectively hold a substantial market share (estimated at xx% in 2025), the market's growth is fueled by agile startups specializing in niche solutions and addressing specific industry needs. This competition fosters innovation and drives the evolution of the industry.
Several key factors influence this market composition:
- Market Share Distribution (2025): A detailed breakdown of market share is crucial for understanding the competitive dynamics. While SAS, IBM, and SAP hold significant shares (xx%, xx%, and xx% respectively), the remaining xx% is distributed among a diverse range of competitors, reflecting the market's fragmentation and the opportunities for specialized providers.
- Innovation Catalysts: Advancements in artificial intelligence (AI), machine learning (ML), and big data analytics are fundamental drivers of innovation. These technologies are enabling the development of more sophisticated analytics capabilities, such as predictive spend analysis, risk mitigation strategies, and automated contract management.
- Regulatory Landscape: The evolving regulatory environment surrounding data privacy (e.g., GDPR, CCPA) and security significantly impacts the Procurement Analytics market. Compliance requirements necessitate robust data governance frameworks and secure data handling practices, influencing vendor selection and solution design.
- M&A Activity (2019-2024): The period between 2019 and 2024 witnessed xx merger and acquisition (M&A) deals totaling $xx million. This activity demonstrates a strategic trend of larger companies consolidating their market positions by acquiring smaller, specialized players to broaden their capabilities and expand their reach into new market segments.
- Emerging Trends: The increasing adoption of cloud-based solutions, the growing emphasis on supply chain resilience, and the demand for sustainable procurement practices are reshaping the market. Solutions integrating blockchain technology for enhanced transparency and traceability are gaining traction. Moreover, the focus on improving supplier relationship management (SRM) and fostering collaboration within the supply chain ecosystem is driving the adoption of Procurement Analytics.
Procurement Analytics Industry Industry Evolution
The Procurement Analytics industry has experienced significant growth over the past five years, driven primarily by the increasing adoption of cloud-based solutions and the growing need for enhanced supply chain visibility. From 2019 to 2024, the market registered a Compound Annual Growth Rate (CAGR) of xx%. This growth is projected to continue at a CAGR of xx% from 2025 to 2033, reaching a market size of $XX Million. The increasing complexity of global supply chains and the need for improved cost optimization are key factors fueling this growth. Technological advancements like AI-powered predictive analytics, blockchain integration for enhanced transparency and automation, and cloud-based deployment models are transforming how businesses approach procurement. The rising adoption of these technologies is further accelerating market expansion. The shift in consumer demand towards greater transparency and sustainability in supply chains is also influencing market dynamics, prompting businesses to adopt Procurement Analytics solutions for better tracking and management of their sustainability performance.
Leading Regions, Countries, or Segments in Procurement Analytics Industry
North America currently holds the largest market share in the Procurement Analytics industry, driven by high technological adoption and increased focus on optimizing supply chain efficiency. The region's well-established IT infrastructure and strong presence of major players contribute significantly to its dominance. However, the Asia-Pacific region is witnessing rapid growth, projected to become a significant market in the coming years, fueled by increasing digitalization and substantial investments in technological advancements.
- By Type: Software dominates, accounting for xx% of the market in 2025, with services expected to register strong growth in the forecast period due to the rising need for implementation and support services.
- By Deployment Type: Cloud-based deployments are rapidly gaining traction, exceeding on-premise deployments by xx% by 2025 driven by improved scalability, accessibility, and cost-effectiveness.
- By Application: Spend analytics holds the largest market share in 2025, followed by supply chain analytics and risk analytics. Demand for contract management and demand forecasting solutions is projected to increase significantly in the coming years.
- By End-User: Manufacturing and BFSI (Banking, Financial Services, and Insurance) sectors are major adopters, with retail and e-commerce showing significant growth potential due to increased focus on cost optimization and inventory management.
Key Drivers: High investments in digital transformation, government initiatives promoting the use of analytics, and increasing awareness of supply chain risk management are key growth drivers.
Procurement Analytics Industry Product Innovations
Recent product innovations in Procurement Analytics focus on incorporating advanced analytics capabilities like AI and machine learning to enhance predictive capabilities, improve decision-making, and automate processes. New solutions feature improved user interfaces, integration with enterprise resource planning (ERP) systems, and enhanced reporting functionalities. Key innovations include real-time dashboards for improved visibility into spending patterns and risk factors, advanced algorithms for demand forecasting, and blockchain technology for enhanced transparency and security in supply chain operations. These advancements contribute to improved efficiency, cost savings, and risk mitigation for businesses.
Propelling Factors for Procurement Analytics Growth
Technological advancements, particularly in AI and machine learning, are significantly driving the growth of the Procurement Analytics market. The increasing need for improved supply chain visibility and risk management is also a major driver. Moreover, the growing pressure to optimize costs and improve operational efficiency is pushing businesses to adopt these solutions. Government regulations and industry standards emphasizing data privacy and security are also influencing market growth by creating a demand for robust and compliant solutions.
Obstacles in the Procurement Analytics Industry Market
High implementation costs, data integration challenges, and the need for skilled professionals to manage and interpret data can hinder the adoption of Procurement Analytics solutions. Data security and privacy concerns also pose significant challenges, particularly with the increasing use of cloud-based solutions. Competition from established players and emerging startups, along with the complexity of integrating these solutions into existing business processes, can also create barriers to market growth. The impact of these obstacles is estimated to restrain market growth by approximately xx% during the forecast period.
Future Opportunities in Procurement Analytics Industry
Emerging opportunities lie in expanding into new geographies, particularly developing markets with growing digitalization and industrialization. The increasing adoption of IoT (Internet of Things) devices in the supply chain opens avenues for integrating real-time data into Procurement Analytics platforms, improving visibility and predictive capabilities. Further, the integration of blockchain technology, coupled with robust data analytics, offers greater transparency and efficiency in managing complex supply chains.
Major Players in the Procurement Analytics Industry Ecosystem
- SAS Institute Inc
- Simfoni Analytic
- IBM Corporation
- JAGGAER Inc
- BRIDGEi2i Analytics Solutions Pvt Ltd
- Rosslyn Data Technologies PLC
- Zycus Inc
- Oracle Corporation
- SAP SE
- Genpact Limited
Key Developments in Procurement Analytics Industry
- October 2023: SAP announced that Tata Projects Limited is leveraging RISE with SAP solutions to accelerate its business transformation, highlighting the increasing adoption of cloud-based Procurement Analytics solutions in large enterprises.
- August 2022: SAS Institute Inc's partnership with SingleStore enhanced data access and scalability for its analytics platform, improving the performance and value proposition of its Procurement Analytics offerings.
Strategic Procurement Analytics Industry Market Forecast
The Procurement Analytics market is poised for robust growth over the next decade, driven by continuous technological advancements, increasing demand for supply chain optimization, and the growing adoption of cloud-based solutions. The market is expected to witness significant expansion, particularly in emerging economies and sectors like retail and e-commerce. The continued development of AI-powered solutions and integration with other enterprise technologies will further accelerate market growth, creating considerable opportunities for both established players and new entrants.
Procurement Analytics Industry Segmentation
-
1. Type
- 1.1. Software
- 1.2. Services
-
2. Deployment Type
- 2.1. On-Premise
- 2.2. Cloud
-
3. Application
- 3.1. Supply Chain Analytics
- 3.2. Risk Analytics
- 3.3. Spend Analytics
- 3.4. Demand Forecasting
- 3.5. Contract Management
-
4. End-User
- 4.1. Manufacturing
- 4.2. Transportation & Logistic
- 4.3. Retail and E-commerce
- 4.4. BFSI
- 4.5. IT & Telecommunication
- 4.6. Other End-Users (Education, Healthcare)
Procurement Analytics Industry Segmentation By Geography
- 1. North America
- 2. Europe
- 3. Asia Pacific
- 4. Rest of the World
Procurement Analytics Industry REPORT HIGHLIGHTS
| Aspects | Details |
|---|---|
| Study Period | 2019-2033 |
| Base Year | 2024 |
| Estimated Year | 2025 |
| Forecast Period | 2025-2033 |
| Historical Period | 2019-2024 |
| Growth Rate | CAGR of 25.67% from 2019-2033 |
| Segmentation |
|
Table of Contents
- 1. Introduction
- 1.1. Research Scope
- 1.2. Market Segmentation
- 1.3. Research Methodology
- 1.4. Definitions and Assumptions
- 2. Executive Summary
- 2.1. Introduction
- 3. Market Dynamics
- 3.1. Introduction
- 3.2. Market Drivers
- 3.2.1. Rising Adoption in Procurement Process in Industries; Rising Demand for Cloud Based Analytical Solutions
- 3.3. Market Restrains
- 3.3.1. Lack of Trained and Skilled Analytical Professionals; Growing Data Breaches Cases
- 3.4. Market Trends
- 3.4.1. Retail and E-commerce Sector to Witness the Growth
- 4. Market Factor Analysis
- 4.1. Porters Five Forces
- 4.2. Supply/Value Chain
- 4.3. PESTEL analysis
- 4.4. Market Entropy
- 4.5. Patent/Trademark Analysis
- 5. Global Procurement Analytics Industry Analysis, Insights and Forecast, 2019-2031
- 5.1. Market Analysis, Insights and Forecast - by Type
- 5.1.1. Software
- 5.1.2. Services
- 5.2. Market Analysis, Insights and Forecast - by Deployment Type
- 5.2.1. On-Premise
- 5.2.2. Cloud
- 5.3. Market Analysis, Insights and Forecast - by Application
- 5.3.1. Supply Chain Analytics
- 5.3.2. Risk Analytics
- 5.3.3. Spend Analytics
- 5.3.4. Demand Forecasting
- 5.3.5. Contract Management
- 5.4. Market Analysis, Insights and Forecast - by End-User
- 5.4.1. Manufacturing
- 5.4.2. Transportation & Logistic
- 5.4.3. Retail and E-commerce
- 5.4.4. BFSI
- 5.4.5. IT & Telecommunication
- 5.4.6. Other End-Users (Education, Healthcare)
- 5.5. Market Analysis, Insights and Forecast - by Region
- 5.5.1. North America
- 5.5.2. Europe
- 5.5.3. Asia Pacific
- 5.5.4. Rest of the World
- 5.1. Market Analysis, Insights and Forecast - by Type
- 6. North America Procurement Analytics Industry Analysis, Insights and Forecast, 2019-2031
- 6.1. Market Analysis, Insights and Forecast - by Type
- 6.1.1. Software
- 6.1.2. Services
- 6.2. Market Analysis, Insights and Forecast - by Deployment Type
- 6.2.1. On-Premise
- 6.2.2. Cloud
- 6.3. Market Analysis, Insights and Forecast - by Application
- 6.3.1. Supply Chain Analytics
- 6.3.2. Risk Analytics
- 6.3.3. Spend Analytics
- 6.3.4. Demand Forecasting
- 6.3.5. Contract Management
- 6.4. Market Analysis, Insights and Forecast - by End-User
- 6.4.1. Manufacturing
- 6.4.2. Transportation & Logistic
- 6.4.3. Retail and E-commerce
- 6.4.4. BFSI
- 6.4.5. IT & Telecommunication
- 6.4.6. Other End-Users (Education, Healthcare)
- 6.1. Market Analysis, Insights and Forecast - by Type
- 7. Europe Procurement Analytics Industry Analysis, Insights and Forecast, 2019-2031
- 7.1. Market Analysis, Insights and Forecast - by Type
- 7.1.1. Software
- 7.1.2. Services
- 7.2. Market Analysis, Insights and Forecast - by Deployment Type
- 7.2.1. On-Premise
- 7.2.2. Cloud
- 7.3. Market Analysis, Insights and Forecast - by Application
- 7.3.1. Supply Chain Analytics
- 7.3.2. Risk Analytics
- 7.3.3. Spend Analytics
- 7.3.4. Demand Forecasting
- 7.3.5. Contract Management
- 7.4. Market Analysis, Insights and Forecast - by End-User
- 7.4.1. Manufacturing
- 7.4.2. Transportation & Logistic
- 7.4.3. Retail and E-commerce
- 7.4.4. BFSI
- 7.4.5. IT & Telecommunication
- 7.4.6. Other End-Users (Education, Healthcare)
- 7.1. Market Analysis, Insights and Forecast - by Type
- 8. Asia Pacific Procurement Analytics Industry Analysis, Insights and Forecast, 2019-2031
- 8.1. Market Analysis, Insights and Forecast - by Type
- 8.1.1. Software
- 8.1.2. Services
- 8.2. Market Analysis, Insights and Forecast - by Deployment Type
- 8.2.1. On-Premise
- 8.2.2. Cloud
- 8.3. Market Analysis, Insights and Forecast - by Application
- 8.3.1. Supply Chain Analytics
- 8.3.2. Risk Analytics
- 8.3.3. Spend Analytics
- 8.3.4. Demand Forecasting
- 8.3.5. Contract Management
- 8.4. Market Analysis, Insights and Forecast - by End-User
- 8.4.1. Manufacturing
- 8.4.2. Transportation & Logistic
- 8.4.3. Retail and E-commerce
- 8.4.4. BFSI
- 8.4.5. IT & Telecommunication
- 8.4.6. Other End-Users (Education, Healthcare)
- 8.1. Market Analysis, Insights and Forecast - by Type
- 9. Rest of the World Procurement Analytics Industry Analysis, Insights and Forecast, 2019-2031
- 9.1. Market Analysis, Insights and Forecast - by Type
- 9.1.1. Software
- 9.1.2. Services
- 9.2. Market Analysis, Insights and Forecast - by Deployment Type
- 9.2.1. On-Premise
- 9.2.2. Cloud
- 9.3. Market Analysis, Insights and Forecast - by Application
- 9.3.1. Supply Chain Analytics
- 9.3.2. Risk Analytics
- 9.3.3. Spend Analytics
- 9.3.4. Demand Forecasting
- 9.3.5. Contract Management
- 9.4. Market Analysis, Insights and Forecast - by End-User
- 9.4.1. Manufacturing
- 9.4.2. Transportation & Logistic
- 9.4.3. Retail and E-commerce
- 9.4.4. BFSI
- 9.4.5. IT & Telecommunication
- 9.4.6. Other End-Users (Education, Healthcare)
- 9.1. Market Analysis, Insights and Forecast - by Type
- 10. North America Procurement Analytics Industry Analysis, Insights and Forecast, 2019-2031
- 10.1. Market Analysis, Insights and Forecast - By Country/Sub-region
- 10.1.1.
- 11. Europe Procurement Analytics Industry Analysis, Insights and Forecast, 2019-2031
- 11.1. Market Analysis, Insights and Forecast - By Country/Sub-region
- 11.1.1.
- 12. Asia Pacific Procurement Analytics Industry Analysis, Insights and Forecast, 2019-2031
- 12.1. Market Analysis, Insights and Forecast - By Country/Sub-region
- 12.1.1.
- 13. Rest of the World Procurement Analytics Industry Analysis, Insights and Forecast, 2019-2031
- 13.1. Market Analysis, Insights and Forecast - By Country/Sub-region
- 13.1.1.
- 14. Competitive Analysis
- 14.1. Global Market Share Analysis 2024
- 14.2. Company Profiles
- 14.2.1 SAS Institute Inc
- 14.2.1.1. Overview
- 14.2.1.2. Products
- 14.2.1.3. SWOT Analysis
- 14.2.1.4. Recent Developments
- 14.2.1.5. Financials (Based on Availability)
- 14.2.2 Simfoni Analytic
- 14.2.2.1. Overview
- 14.2.2.2. Products
- 14.2.2.3. SWOT Analysis
- 14.2.2.4. Recent Developments
- 14.2.2.5. Financials (Based on Availability)
- 14.2.3 IBM Corporation
- 14.2.3.1. Overview
- 14.2.3.2. Products
- 14.2.3.3. SWOT Analysis
- 14.2.3.4. Recent Developments
- 14.2.3.5. Financials (Based on Availability)
- 14.2.4 JAGGAER Inc
- 14.2.4.1. Overview
- 14.2.4.2. Products
- 14.2.4.3. SWOT Analysis
- 14.2.4.4. Recent Developments
- 14.2.4.5. Financials (Based on Availability)
- 14.2.5 BRIDGEi2i Analytics Solutions Pvt Ltd
- 14.2.5.1. Overview
- 14.2.5.2. Products
- 14.2.5.3. SWOT Analysis
- 14.2.5.4. Recent Developments
- 14.2.5.5. Financials (Based on Availability)
- 14.2.6 Rosslyn Data Technologies PLC
- 14.2.6.1. Overview
- 14.2.6.2. Products
- 14.2.6.3. SWOT Analysis
- 14.2.6.4. Recent Developments
- 14.2.6.5. Financials (Based on Availability)
- 14.2.7 Zycus Inc
- 14.2.7.1. Overview
- 14.2.7.2. Products
- 14.2.7.3. SWOT Analysis
- 14.2.7.4. Recent Developments
- 14.2.7.5. Financials (Based on Availability)
- 14.2.8 Oracle Corporation
- 14.2.8.1. Overview
- 14.2.8.2. Products
- 14.2.8.3. SWOT Analysis
- 14.2.8.4. Recent Developments
- 14.2.8.5. Financials (Based on Availability)
- 14.2.9 SAP SE
- 14.2.9.1. Overview
- 14.2.9.2. Products
- 14.2.9.3. SWOT Analysis
- 14.2.9.4. Recent Developments
- 14.2.9.5. Financials (Based on Availability)
- 14.2.10 Genpact Limited
- 14.2.10.1. Overview
- 14.2.10.2. Products
- 14.2.10.3. SWOT Analysis
- 14.2.10.4. Recent Developments
- 14.2.10.5. Financials (Based on Availability)
- 14.2.1 SAS Institute Inc
List of Figures
- Figure 1: Global Procurement Analytics Industry Revenue Breakdown (Million, %) by Region 2024 & 2032
- Figure 2: North America Procurement Analytics Industry Revenue (Million), by Country 2024 & 2032
- Figure 3: North America Procurement Analytics Industry Revenue Share (%), by Country 2024 & 2032
- Figure 4: Europe Procurement Analytics Industry Revenue (Million), by Country 2024 & 2032
- Figure 5: Europe Procurement Analytics Industry Revenue Share (%), by Country 2024 & 2032
- Figure 6: Asia Pacific Procurement Analytics Industry Revenue (Million), by Country 2024 & 2032
- Figure 7: Asia Pacific Procurement Analytics Industry Revenue Share (%), by Country 2024 & 2032
- Figure 8: Rest of the World Procurement Analytics Industry Revenue (Million), by Country 2024 & 2032
- Figure 9: Rest of the World Procurement Analytics Industry Revenue Share (%), by Country 2024 & 2032
- Figure 10: North America Procurement Analytics Industry Revenue (Million), by Type 2024 & 2032
- Figure 11: North America Procurement Analytics Industry Revenue Share (%), by Type 2024 & 2032
- Figure 12: North America Procurement Analytics Industry Revenue (Million), by Deployment Type 2024 & 2032
- Figure 13: North America Procurement Analytics Industry Revenue Share (%), by Deployment Type 2024 & 2032
- Figure 14: North America Procurement Analytics Industry Revenue (Million), by Application 2024 & 2032
- Figure 15: North America Procurement Analytics Industry Revenue Share (%), by Application 2024 & 2032
- Figure 16: North America Procurement Analytics Industry Revenue (Million), by End-User 2024 & 2032
- Figure 17: North America Procurement Analytics Industry Revenue Share (%), by End-User 2024 & 2032
- Figure 18: North America Procurement Analytics Industry Revenue (Million), by Country 2024 & 2032
- Figure 19: North America Procurement Analytics Industry Revenue Share (%), by Country 2024 & 2032
- Figure 20: Europe Procurement Analytics Industry Revenue (Million), by Type 2024 & 2032
- Figure 21: Europe Procurement Analytics Industry Revenue Share (%), by Type 2024 & 2032
- Figure 22: Europe Procurement Analytics Industry Revenue (Million), by Deployment Type 2024 & 2032
- Figure 23: Europe Procurement Analytics Industry Revenue Share (%), by Deployment Type 2024 & 2032
- Figure 24: Europe Procurement Analytics Industry Revenue (Million), by Application 2024 & 2032
- Figure 25: Europe Procurement Analytics Industry Revenue Share (%), by Application 2024 & 2032
- Figure 26: Europe Procurement Analytics Industry Revenue (Million), by End-User 2024 & 2032
- Figure 27: Europe Procurement Analytics Industry Revenue Share (%), by End-User 2024 & 2032
- Figure 28: Europe Procurement Analytics Industry Revenue (Million), by Country 2024 & 2032
- Figure 29: Europe Procurement Analytics Industry Revenue Share (%), by Country 2024 & 2032
- Figure 30: Asia Pacific Procurement Analytics Industry Revenue (Million), by Type 2024 & 2032
- Figure 31: Asia Pacific Procurement Analytics Industry Revenue Share (%), by Type 2024 & 2032
- Figure 32: Asia Pacific Procurement Analytics Industry Revenue (Million), by Deployment Type 2024 & 2032
- Figure 33: Asia Pacific Procurement Analytics Industry Revenue Share (%), by Deployment Type 2024 & 2032
- Figure 34: Asia Pacific Procurement Analytics Industry Revenue (Million), by Application 2024 & 2032
- Figure 35: Asia Pacific Procurement Analytics Industry Revenue Share (%), by Application 2024 & 2032
- Figure 36: Asia Pacific Procurement Analytics Industry Revenue (Million), by End-User 2024 & 2032
- Figure 37: Asia Pacific Procurement Analytics Industry Revenue Share (%), by End-User 2024 & 2032
- Figure 38: Asia Pacific Procurement Analytics Industry Revenue (Million), by Country 2024 & 2032
- Figure 39: Asia Pacific Procurement Analytics Industry Revenue Share (%), by Country 2024 & 2032
- Figure 40: Rest of the World Procurement Analytics Industry Revenue (Million), by Type 2024 & 2032
- Figure 41: Rest of the World Procurement Analytics Industry Revenue Share (%), by Type 2024 & 2032
- Figure 42: Rest of the World Procurement Analytics Industry Revenue (Million), by Deployment Type 2024 & 2032
- Figure 43: Rest of the World Procurement Analytics Industry Revenue Share (%), by Deployment Type 2024 & 2032
- Figure 44: Rest of the World Procurement Analytics Industry Revenue (Million), by Application 2024 & 2032
- Figure 45: Rest of the World Procurement Analytics Industry Revenue Share (%), by Application 2024 & 2032
- Figure 46: Rest of the World Procurement Analytics Industry Revenue (Million), by End-User 2024 & 2032
- Figure 47: Rest of the World Procurement Analytics Industry Revenue Share (%), by End-User 2024 & 2032
- Figure 48: Rest of the World Procurement Analytics Industry Revenue (Million), by Country 2024 & 2032
- Figure 49: Rest of the World Procurement Analytics Industry Revenue Share (%), by Country 2024 & 2032
List of Tables
- Table 1: Global Procurement Analytics Industry Revenue Million Forecast, by Region 2019 & 2032
- Table 2: Global Procurement Analytics Industry Revenue Million Forecast, by Type 2019 & 2032
- Table 3: Global Procurement Analytics Industry Revenue Million Forecast, by Deployment Type 2019 & 2032
- Table 4: Global Procurement Analytics Industry Revenue Million Forecast, by Application 2019 & 2032
- Table 5: Global Procurement Analytics Industry Revenue Million Forecast, by End-User 2019 & 2032
- Table 6: Global Procurement Analytics Industry Revenue Million Forecast, by Region 2019 & 2032
- Table 7: Global Procurement Analytics Industry Revenue Million Forecast, by Country 2019 & 2032
- Table 8: Procurement Analytics Industry Revenue (Million) Forecast, by Application 2019 & 2032
- Table 9: Global Procurement Analytics Industry Revenue Million Forecast, by Country 2019 & 2032
- Table 10: Procurement Analytics Industry Revenue (Million) Forecast, by Application 2019 & 2032
- Table 11: Global Procurement Analytics Industry Revenue Million Forecast, by Country 2019 & 2032
- Table 12: Procurement Analytics Industry Revenue (Million) Forecast, by Application 2019 & 2032
- Table 13: Global Procurement Analytics Industry Revenue Million Forecast, by Country 2019 & 2032
- Table 14: Procurement Analytics Industry Revenue (Million) Forecast, by Application 2019 & 2032
- Table 15: Global Procurement Analytics Industry Revenue Million Forecast, by Type 2019 & 2032
- Table 16: Global Procurement Analytics Industry Revenue Million Forecast, by Deployment Type 2019 & 2032
- Table 17: Global Procurement Analytics Industry Revenue Million Forecast, by Application 2019 & 2032
- Table 18: Global Procurement Analytics Industry Revenue Million Forecast, by End-User 2019 & 2032
- Table 19: Global Procurement Analytics Industry Revenue Million Forecast, by Country 2019 & 2032
- Table 20: Global Procurement Analytics Industry Revenue Million Forecast, by Type 2019 & 2032
- Table 21: Global Procurement Analytics Industry Revenue Million Forecast, by Deployment Type 2019 & 2032
- Table 22: Global Procurement Analytics Industry Revenue Million Forecast, by Application 2019 & 2032
- Table 23: Global Procurement Analytics Industry Revenue Million Forecast, by End-User 2019 & 2032
- Table 24: Global Procurement Analytics Industry Revenue Million Forecast, by Country 2019 & 2032
- Table 25: Global Procurement Analytics Industry Revenue Million Forecast, by Type 2019 & 2032
- Table 26: Global Procurement Analytics Industry Revenue Million Forecast, by Deployment Type 2019 & 2032
- Table 27: Global Procurement Analytics Industry Revenue Million Forecast, by Application 2019 & 2032
- Table 28: Global Procurement Analytics Industry Revenue Million Forecast, by End-User 2019 & 2032
- Table 29: Global Procurement Analytics Industry Revenue Million Forecast, by Country 2019 & 2032
- Table 30: Global Procurement Analytics Industry Revenue Million Forecast, by Type 2019 & 2032
- Table 31: Global Procurement Analytics Industry Revenue Million Forecast, by Deployment Type 2019 & 2032
- Table 32: Global Procurement Analytics Industry Revenue Million Forecast, by Application 2019 & 2032
- Table 33: Global Procurement Analytics Industry Revenue Million Forecast, by End-User 2019 & 2032
- Table 34: Global Procurement Analytics Industry Revenue Million Forecast, by Country 2019 & 2032
Frequently Asked Questions
1. What is the projected Compound Annual Growth Rate (CAGR) of the Procurement Analytics Industry?
The projected CAGR is approximately 25.67%.
2. Which companies are prominent players in the Procurement Analytics Industry?
Key companies in the market include SAS Institute Inc, Simfoni Analytic, IBM Corporation, JAGGAER Inc, BRIDGEi2i Analytics Solutions Pvt Ltd, Rosslyn Data Technologies PLC, Zycus Inc, Oracle Corporation, SAP SE, Genpact Limited.
3. What are the main segments of the Procurement Analytics Industry?
The market segments include Type, Deployment Type, Application, End-User.
4. Can you provide details about the market size?
The market size is estimated to be USD 4.17 Million as of 2022.
5. What are some drivers contributing to market growth?
Rising Adoption in Procurement Process in Industries; Rising Demand for Cloud Based Analytical Solutions.
6. What are the notable trends driving market growth?
Retail and E-commerce Sector to Witness the Growth.
7. Are there any restraints impacting market growth?
Lack of Trained and Skilled Analytical Professionals; Growing Data Breaches Cases.
8. Can you provide examples of recent developments in the market?
October 2023: SAP announced that Tata Projects Limited, one of India's fastest-growing technology, engineering, procurement, and construction companies, is accelerating its business transformation journey by leveraging the RISE with SAP solutions and surrounding cloud solutions.
9. What pricing options are available for accessing the report?
Pricing options include single-user, multi-user, and enterprise licenses priced at USD 4750, USD 5250, and USD 8750 respectively.
10. Is the market size provided in terms of value or volume?
The market size is provided in terms of value, measured in Million.
11. Are there any specific market keywords associated with the report?
Yes, the market keyword associated with the report is "Procurement Analytics Industry," which aids in identifying and referencing the specific market segment covered.
12. How do I determine which pricing option suits my needs best?
The pricing options vary based on user requirements and access needs. Individual users may opt for single-user licenses, while businesses requiring broader access may choose multi-user or enterprise licenses for cost-effective access to the report.
13. Are there any additional resources or data provided in the Procurement Analytics Industry report?
While the report offers comprehensive insights, it's advisable to review the specific contents or supplementary materials provided to ascertain if additional resources or data are available.
14. How can I stay updated on further developments or reports in the Procurement Analytics Industry?
To stay informed about further developments, trends, and reports in the Procurement Analytics Industry, consider subscribing to industry newsletters, following relevant companies and organizations, or regularly checking reputable industry news sources and publications.
Methodology
Step 1 - Identification of Relevant Samples Size from Population Database


Step 2 - Approaches for Defining Global Market Size (Value, Volume* & Price*)

Note*: In applicable scenarios
Step 3 - Data Sources
Primary Research
- Web Analytics
- Survey Reports
- Research Institute
- Latest Research Reports
- Opinion Leaders
Secondary Research
- Annual Reports
- White Paper
- Latest Press Release
- Industry Association
- Paid Database
- Investor Presentations

Step 4 - Data Triangulation
Involves using different sources of information in order to increase the validity of a study
These sources are likely to be stakeholders in a program - participants, other researchers, program staff, other community members, and so on.
Then we put all data in single framework & apply various statistical tools to find out the dynamic on the market.
During the analysis stage, feedback from the stakeholder groups would be compared to determine areas of agreement as well as areas of divergence
