

Key Insights
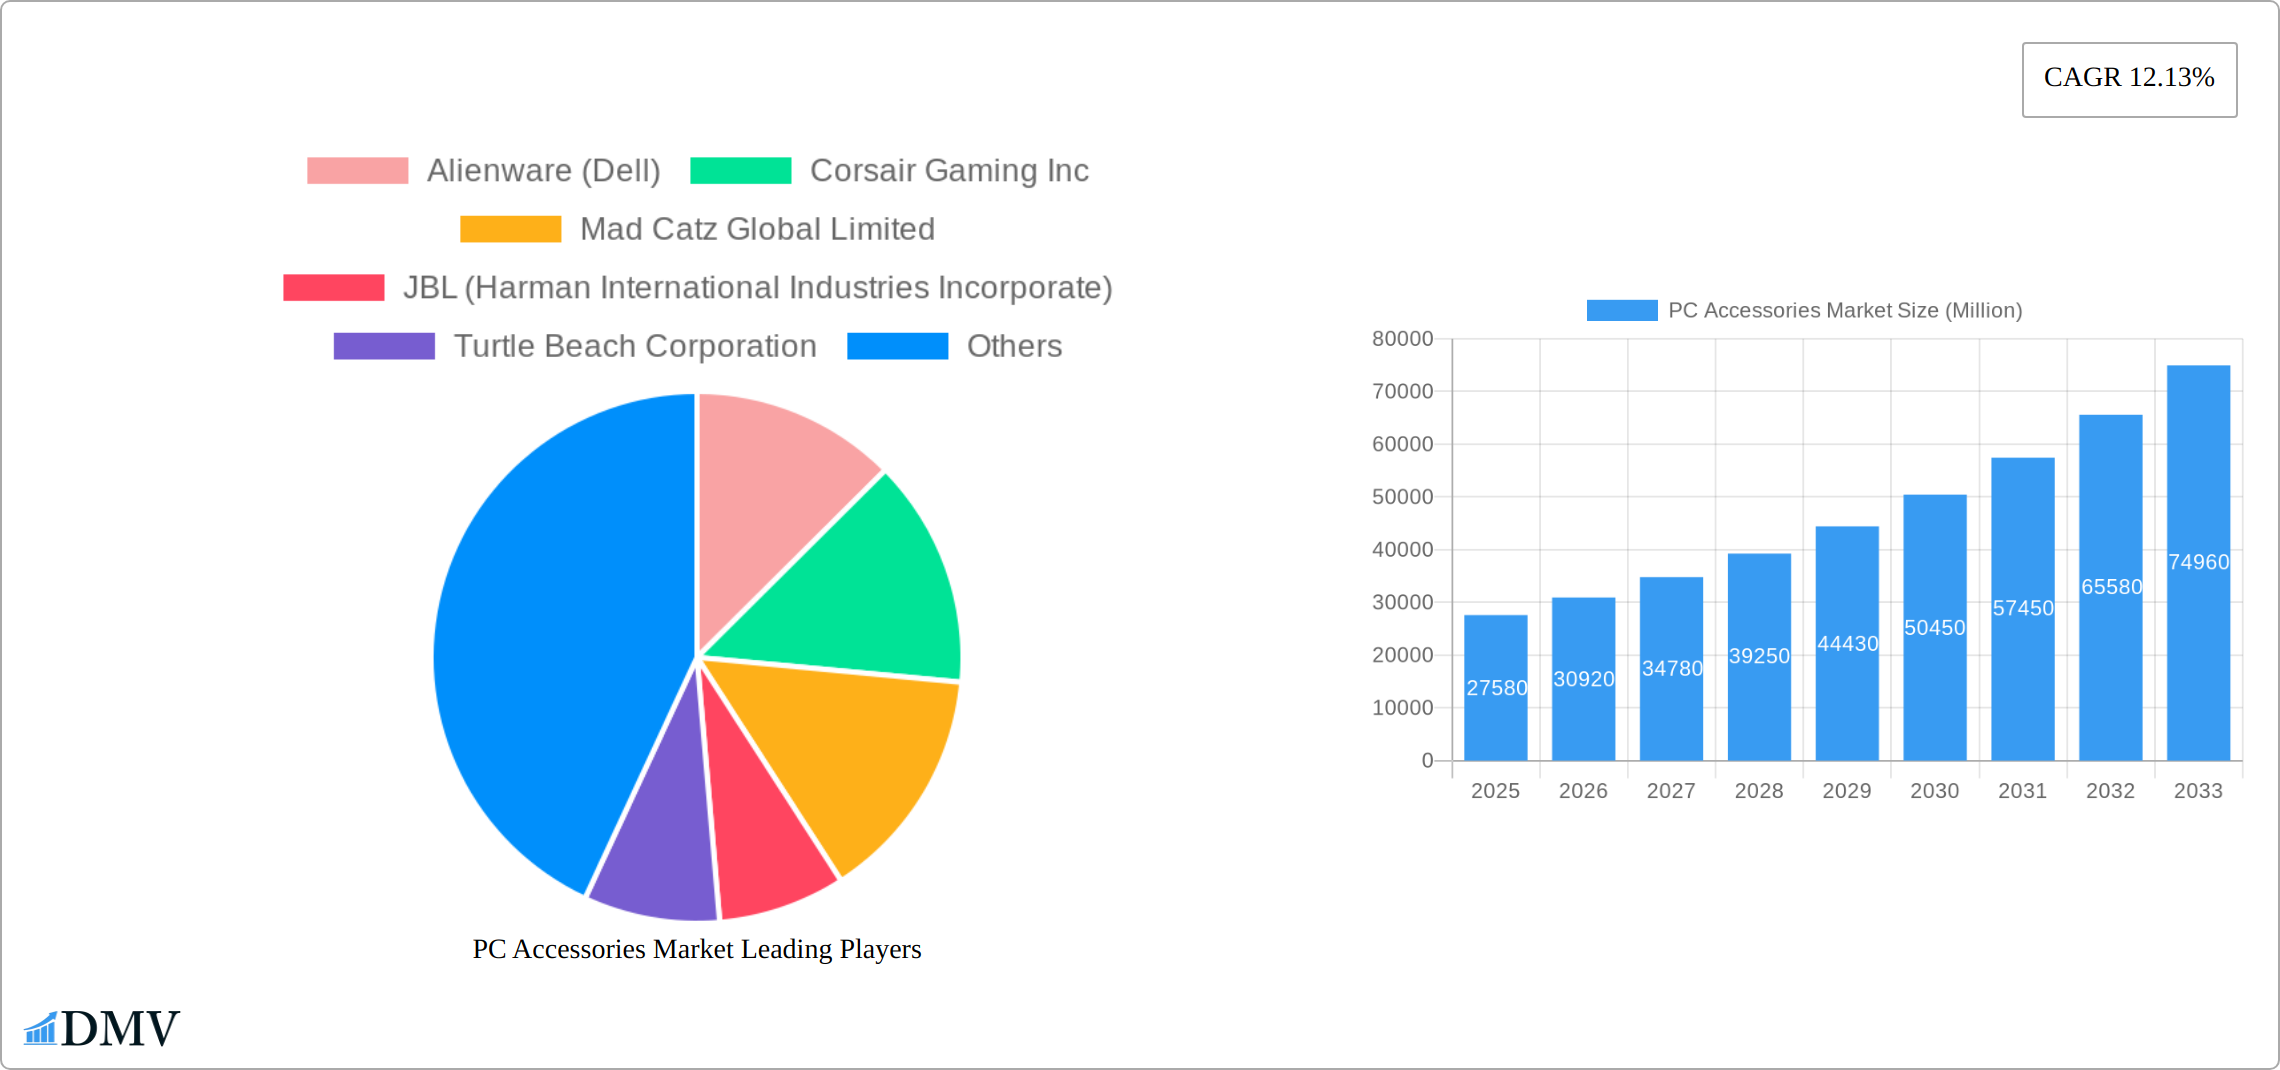
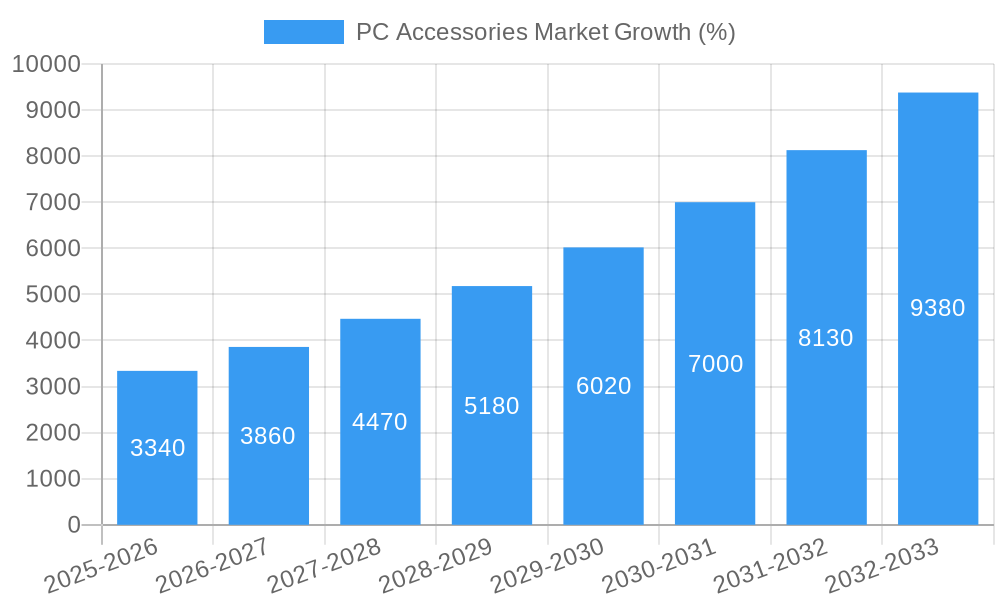
The global PC Accessories market, valued at $27.58 billion in 2025, is projected to experience robust growth, exhibiting a Compound Annual Growth Rate (CAGR) of 12.13% from 2025 to 2033. This expansion is fueled by several key drivers. The increasing popularity of gaming, both professionally and casually, significantly boosts demand for high-performance gaming peripherals like headsets, keyboards, and mice. Furthermore, the rise of remote work and online learning has fueled demand for ergonomic accessories such as monitor arms and comfortable gaming chairs, enhancing productivity and user experience. Technological advancements, such as improved wireless connectivity, customizable RGB lighting, and advanced sensor technology in mice and keyboards, are also contributing to market growth. While the market faces restraints such as economic fluctuations impacting discretionary spending, the overall trend points towards sustained growth driven by continuous innovation and evolving consumer preferences. Segmentation reveals strong growth in gaming accessories, with mice and headsets leading the charge, but non-gaming segments like ergonomic office accessories also exhibit significant potential.
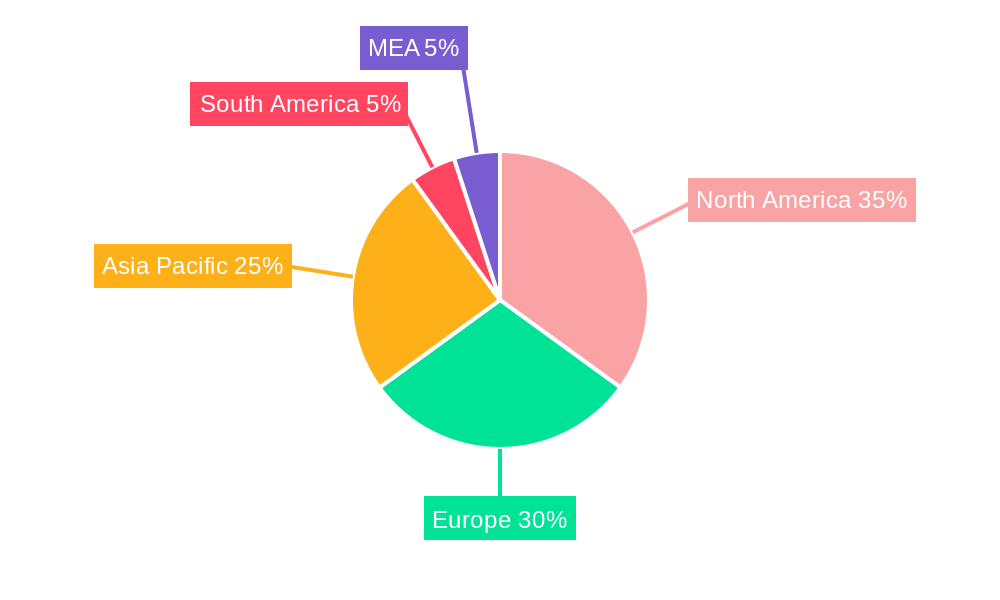
The market's geographical distribution shows North America and Europe currently holding substantial market share, driven by high levels of PC penetration and consumer spending. However, the Asia-Pacific region presents a rapidly expanding opportunity, fueled by rising disposable incomes and increasing adoption of PCs and gaming culture in countries like China and India. Major players like Logitech, Razer, Corsair, and Dell are competing fiercely through innovation and brand building, constantly introducing new products and features to cater to the evolving needs of gamers and professionals alike. The forecast period (2025-2033) indicates a significant expansion of the market, driven by the continued convergence of gaming and productivity-oriented accessories. This trend suggests future growth in hybrid products that offer both high performance and ergonomic design, catering to a broader user base. Competitive landscape analysis highlights the importance of strategic partnerships, mergers, and acquisitions, enabling companies to expand their product portfolios and reach wider markets.
PC Accessories Market: A Comprehensive Report (2019-2033)
This insightful report provides a deep dive into the global PC Accessories Market, offering a comprehensive analysis of market trends, competitive dynamics, and future growth opportunities from 2019 to 2033. The study covers key segments including gaming and non-gaming accessories, encompassing mice, keyboards, headsets, monitor arms, gaming chairs, and webcams. With a base year of 2025 and a forecast period spanning 2025-2033, this report is an invaluable resource for stakeholders seeking to understand and capitalize on the evolving landscape of the PC accessories industry. The market is projected to reach xx Million by 2033, showcasing significant growth potential.
PC Accessories Market Composition & Trends
This section evaluates the PC accessories market's competitive landscape, encompassing market concentration, innovation drivers, regulatory frameworks, substitute products, end-user profiles, and merger & acquisition (M&A) activities. The report analyzes the market share distribution among key players like Alienware (Dell), Corsair Gaming Inc, Mad Catz Global Limited, JBL (Harman International Industries Incorporate), Turtle Beach Corporation, Microsoft Corporation, Nintendo Co Ltd, Koninklijke Philips NV, Cooler Master Co Ltd (CMC), Sennheiser Electronic GmbH & Co KG, AOC International, Razer Inc, Reddragon (Eastern Times Technology Co Ltd), Logitech International SA, and Sony Corporation.
- Market Concentration: The report details the market share held by top players, identifying the degree of concentration and the presence of any dominant players. xx% of the market is concentrated among the top 5 players in 2025.
- Innovation Catalysts: Analysis of technological advancements driving innovation, such as AI integration and improved ergonomics, influencing product development and consumer preference.
- Regulatory Landscape: Assessment of the regulatory environment and its impact on market growth, including safety standards and import/export regulations.
- Substitute Products: Examination of alternative products or technologies that could potentially impact the market share of PC accessories.
- End-User Profiles: Detailed segmentation of end-users, including gamers, professionals, and general consumers, based on their needs and purchasing habits.
- M&A Activities: Review of recent mergers and acquisitions within the PC accessories industry, analyzing their impact on market consolidation and competitive dynamics. Total M&A deal value in 2024 is estimated at xx Million.
PC Accessories Market Industry Evolution
The PC accessories market has undergone a significant transformation from 2019 to 2024, and this trend is projected to continue through 2033. This evolution is driven by several key factors: rapid technological advancements, such as the seamless integration of artificial intelligence (AI) and the dramatic improvements in connectivity; a shift in consumer preferences towards ergonomic designs and high-performance accessories; and the ever-increasing demand for enhanced functionality and seamless integration within broader ecosystems. The market's expansion is clearly illustrated by the compound annual growth rate (CAGR). For instance, the gaming headset segment experienced a robust CAGR of xx% between 2019 and 2024, fueled largely by the explosive growth of esports and the broader gaming community. This growth trajectory is expected to continue, driven by emerging technologies and shifting user needs.
Leading Regions, Countries, or Segments in PC Accessories Market
This section identifies the dominant regions, countries, and product segments within the PC accessories market. Detailed analysis is provided for each segment (Mice, Keyboards, Headsets, Monitor Arms, Gaming Chairs, Webcams) highlighting regional variations in market size and growth drivers.
Key Drivers (Examples):
- North America: Strong demand for high-end gaming accessories, coupled with high disposable incomes.
- Asia-Pacific: Rapid growth driven by increasing internet penetration and a young, tech-savvy population.
- Gaming Segment: Significant growth fueled by the popularity of esports and online gaming.
The dominance of specific regions or segments is analyzed based on various factors like investment trends, regulatory support, and consumer preferences, providing detailed insights into market dynamics. For instance, the North American market for gaming chairs is experiencing substantial growth due to factors such as the growing popularity of esports and increased awareness of ergonomic benefits.
PC Accessories Market Product Innovations
Recent innovations include the development of AI-powered accessories, ergonomic designs focused on comfort and health, and the integration of advanced connectivity technologies. These innovations enhance performance, provide enhanced user experience, and cater to evolving consumer demands, leading to increased market penetration and higher adoption rates.
Propelling Factors for PC Accessories Market Growth
Several factors drive the growth of the PC accessories market. These include technological advancements (like the release of Snapdragon X Plus by Qualcomm offering faster and more energy-efficient processors), rising disposable incomes in developing economies, and the increasing popularity of gaming and esports. Government initiatives promoting digitalization and the expanding online retail landscape are also contributing significantly to market growth.
Obstacles in the PC Accessories Market Market
Challenges facing the PC accessories market include intense competition, supply chain disruptions (potentially causing price fluctuations and product shortages), and stringent regulatory compliance requirements that may impede market expansion in certain regions. Economic downturns and fluctuating currency exchange rates also create uncertainty and impact sales volumes.
Future Opportunities in PC Accessories Market
The future of the PC accessories market presents compelling opportunities for growth and innovation. The burgeoning fields of virtual reality (VR) and augmented reality (AR) are creating significant demand for specialized accessories. The growing adoption of smart homes and smart offices necessitates the development of compatible and integrated PC peripherals. The continued expansion of the gaming industry, along with the increasing popularity of esports, further fuels demand for high-performance gaming accessories. Moreover, there is a rising consumer preference for sustainable and eco-friendly products, creating an opportunity for manufacturers to develop and market environmentally conscious accessories. Companies that successfully leverage these trends are poised for significant market share gains.
Major Players in the PC Accessories Market Ecosystem
- Alienware (Dell)
- Corsair Gaming Inc.
- Mad Catz Global Limited
- JBL (Harman International Industries Incorporated)
- Turtle Beach Corporation
- Microsoft Corporation
- Nintendo Co., Ltd.
- Koninklijke Philips N.V.
- Cooler Master Co., Ltd. (CMC)
- Sennheiser Electronic GmbH & Co. KG
- AOC International
- Razer Inc.
- Reddragon (Eastern Times Technology Co., Ltd.)
- Logitech International S.A.
- Sony Corporation
Key Developments in PC Accessories Market Industry
- April 2024: Qualcomm Technologies, Inc. launched the Snapdragon X Plus, a significant enhancement to its Snapdragon X Series platform. This upgrade offers up to 37% faster CPU performance and 54% lower power consumption, promising a new generation of more efficient and powerful PC accessories.
- January 2024: Lenovo unveiled over 40 new AI-powered devices across its various sub-brands (Yoga, ThinkBook, ThinkPad, ThinkCentre, and Legion). This substantial launch highlights a strong industry-wide push towards AI-integrated PC accessories and personalized computing experiences, setting a new standard for user interaction and device functionality.
- [Add another recent key development here with date and a brief description]
Strategic PC Accessories Market Market Forecast
The PC accessories market is poised for continued growth driven by technological advancements, increasing demand from gaming enthusiasts and professionals, and the proliferation of smart devices. Expanding into new markets, especially in developing economies, and continued innovation in product design and functionality will be crucial for sustained growth and market dominance throughout the forecast period (2025-2033).
PC Accessories Market Segmentation
-
1. Product
-
1.1. Mice
- 1.1.1. Gaming
- 1.1.2. Non-gaming (Enterprise and Consumer)
- 1.2. Keyboard
-
1.3. Headset
- 1.3.1. Gaming and Personal
- 1.3.2. Non-gaming (Commercial)
- 1.4. Monitor Arms
- 1.5. Gaming Chairs
- 1.6. Webcams
-
1.1. Mice
PC Accessories Market Segmentation By Geography
-
1. North America
- 1.1. United States
- 1.2. Canada
-
2. Europe
- 2.1. Germany
- 2.2. United Kingdom
- 2.3. France
- 2.4. Italy
- 2.5. Russia
- 2.6. Switzerland
-
3. Asia Pacific
- 3.1. China
- 3.2. Japan
- 3.3. South Korea
- 3.4. Australia and New Zealand
-
4. Latin America
- 4.1. Brazil
- 4.2. Mexico
-
5. Middle East and Africa
- 5.1. United Arab Emirates
- 5.2. Saudi Arabia
- 5.3. South Africa
PC Accessories Market REPORT HIGHLIGHTS
| Aspects | Details |
|---|---|
| Study Period | 2019-2033 |
| Base Year | 2024 |
| Estimated Year | 2025 |
| Forecast Period | 2025-2033 |
| Historical Period | 2019-2024 |
| Growth Rate | CAGR of 12.13% from 2019-2033 |
| Segmentation |
|
Table of Contents
- 1. Introduction
- 1.1. Research Scope
- 1.2. Market Segmentation
- 1.3. Research Methodology
- 1.4. Definitions and Assumptions
- 2. Executive Summary
- 2.1. Introduction
- 3. Market Dynamics
- 3.1. Introduction
- 3.2. Market Drivers
- 3.2.1 Rising Adoption of Wireless Technologies; Emergence of Technologies Such as AR
- 3.2.2 VR
- 3.2.3 and AI; Adoption of Gaming Platforms Such as E-sports
- 3.3. Market Restrains
- 3.3.1. Fluctuation in the Production of Silicon Chips is Leading to a Shortage in the Demand for Gaming Accessories
- 3.4. Market Trends
- 3.4.1 Emergence of Technologies such as AR
- 3.4.2 VR
- 3.4.3 and AI to Drive the Market
- 4. Market Factor Analysis
- 4.1. Porters Five Forces
- 4.2. Supply/Value Chain
- 4.3. PESTEL analysis
- 4.4. Market Entropy
- 4.5. Patent/Trademark Analysis
- 5. Global PC Accessories Market Analysis, Insights and Forecast, 2019-2031
- 5.1. Market Analysis, Insights and Forecast - by Product
- 5.1.1. Mice
- 5.1.1.1. Gaming
- 5.1.1.2. Non-gaming (Enterprise and Consumer)
- 5.1.2. Keyboard
- 5.1.3. Headset
- 5.1.3.1. Gaming and Personal
- 5.1.3.2. Non-gaming (Commercial)
- 5.1.4. Monitor Arms
- 5.1.5. Gaming Chairs
- 5.1.6. Webcams
- 5.1.1. Mice
- 5.2. Market Analysis, Insights and Forecast - by Region
- 5.2.1. North America
- 5.2.2. Europe
- 5.2.3. Asia Pacific
- 5.2.4. Latin America
- 5.2.5. Middle East and Africa
- 5.1. Market Analysis, Insights and Forecast - by Product
- 6. North America PC Accessories Market Analysis, Insights and Forecast, 2019-2031
- 6.1. Market Analysis, Insights and Forecast - by Product
- 6.1.1. Mice
- 6.1.1.1. Gaming
- 6.1.1.2. Non-gaming (Enterprise and Consumer)
- 6.1.2. Keyboard
- 6.1.3. Headset
- 6.1.3.1. Gaming and Personal
- 6.1.3.2. Non-gaming (Commercial)
- 6.1.4. Monitor Arms
- 6.1.5. Gaming Chairs
- 6.1.6. Webcams
- 6.1.1. Mice
- 6.1. Market Analysis, Insights and Forecast - by Product
- 7. Europe PC Accessories Market Analysis, Insights and Forecast, 2019-2031
- 7.1. Market Analysis, Insights and Forecast - by Product
- 7.1.1. Mice
- 7.1.1.1. Gaming
- 7.1.1.2. Non-gaming (Enterprise and Consumer)
- 7.1.2. Keyboard
- 7.1.3. Headset
- 7.1.3.1. Gaming and Personal
- 7.1.3.2. Non-gaming (Commercial)
- 7.1.4. Monitor Arms
- 7.1.5. Gaming Chairs
- 7.1.6. Webcams
- 7.1.1. Mice
- 7.1. Market Analysis, Insights and Forecast - by Product
- 8. Asia Pacific PC Accessories Market Analysis, Insights and Forecast, 2019-2031
- 8.1. Market Analysis, Insights and Forecast - by Product
- 8.1.1. Mice
- 8.1.1.1. Gaming
- 8.1.1.2. Non-gaming (Enterprise and Consumer)
- 8.1.2. Keyboard
- 8.1.3. Headset
- 8.1.3.1. Gaming and Personal
- 8.1.3.2. Non-gaming (Commercial)
- 8.1.4. Monitor Arms
- 8.1.5. Gaming Chairs
- 8.1.6. Webcams
- 8.1.1. Mice
- 8.1. Market Analysis, Insights and Forecast - by Product
- 9. Latin America PC Accessories Market Analysis, Insights and Forecast, 2019-2031
- 9.1. Market Analysis, Insights and Forecast - by Product
- 9.1.1. Mice
- 9.1.1.1. Gaming
- 9.1.1.2. Non-gaming (Enterprise and Consumer)
- 9.1.2. Keyboard
- 9.1.3. Headset
- 9.1.3.1. Gaming and Personal
- 9.1.3.2. Non-gaming (Commercial)
- 9.1.4. Monitor Arms
- 9.1.5. Gaming Chairs
- 9.1.6. Webcams
- 9.1.1. Mice
- 9.1. Market Analysis, Insights and Forecast - by Product
- 10. Middle East and Africa PC Accessories Market Analysis, Insights and Forecast, 2019-2031
- 10.1. Market Analysis, Insights and Forecast - by Product
- 10.1.1. Mice
- 10.1.1.1. Gaming
- 10.1.1.2. Non-gaming (Enterprise and Consumer)
- 10.1.2. Keyboard
- 10.1.3. Headset
- 10.1.3.1. Gaming and Personal
- 10.1.3.2. Non-gaming (Commercial)
- 10.1.4. Monitor Arms
- 10.1.5. Gaming Chairs
- 10.1.6. Webcams
- 10.1.1. Mice
- 10.1. Market Analysis, Insights and Forecast - by Product
- 11. North America PC Accessories Market Analysis, Insights and Forecast, 2019-2031
- 11.1. Market Analysis, Insights and Forecast - By Country/Sub-region
- 11.1.1 United States
- 11.1.2 Canada
- 11.1.3 Mexico
- 12. Europe PC Accessories Market Analysis, Insights and Forecast, 2019-2031
- 12.1. Market Analysis, Insights and Forecast - By Country/Sub-region
- 12.1.1 Germany
- 12.1.2 United Kingdom
- 12.1.3 France
- 12.1.4 Spain
- 12.1.5 Italy
- 12.1.6 Spain
- 12.1.7 Belgium
- 12.1.8 Netherland
- 12.1.9 Nordics
- 12.1.10 Rest of Europe
- 13. Asia Pacific PC Accessories Market Analysis, Insights and Forecast, 2019-2031
- 13.1. Market Analysis, Insights and Forecast - By Country/Sub-region
- 13.1.1 China
- 13.1.2 Japan
- 13.1.3 India
- 13.1.4 South Korea
- 13.1.5 Southeast Asia
- 13.1.6 Australia
- 13.1.7 Indonesia
- 13.1.8 Phillipes
- 13.1.9 Singapore
- 13.1.10 Thailandc
- 13.1.11 Rest of Asia Pacific
- 14. South America PC Accessories Market Analysis, Insights and Forecast, 2019-2031
- 14.1. Market Analysis, Insights and Forecast - By Country/Sub-region
- 14.1.1 Brazil
- 14.1.2 Argentina
- 14.1.3 Peru
- 14.1.4 Chile
- 14.1.5 Colombia
- 14.1.6 Ecuador
- 14.1.7 Venezuela
- 14.1.8 Rest of South America
- 15. North America PC Accessories Market Analysis, Insights and Forecast, 2019-2031
- 15.1. Market Analysis, Insights and Forecast - By Country/Sub-region
- 15.1.1 United States
- 15.1.2 Canada
- 15.1.3 Mexico
- 16. MEA PC Accessories Market Analysis, Insights and Forecast, 2019-2031
- 16.1. Market Analysis, Insights and Forecast - By Country/Sub-region
- 16.1.1 United Arab Emirates
- 16.1.2 Saudi Arabia
- 16.1.3 South Africa
- 16.1.4 Rest of Middle East and Africa
- 17. Competitive Analysis
- 17.1. Global Market Share Analysis 2024
- 17.2. Company Profiles
- 17.2.1 Alienware (Dell)
- 17.2.1.1. Overview
- 17.2.1.2. Products
- 17.2.1.3. SWOT Analysis
- 17.2.1.4. Recent Developments
- 17.2.1.5. Financials (Based on Availability)
- 17.2.2 Corsair Gaming Inc
- 17.2.2.1. Overview
- 17.2.2.2. Products
- 17.2.2.3. SWOT Analysis
- 17.2.2.4. Recent Developments
- 17.2.2.5. Financials (Based on Availability)
- 17.2.3 Mad Catz Global Limited
- 17.2.3.1. Overview
- 17.2.3.2. Products
- 17.2.3.3. SWOT Analysis
- 17.2.3.4. Recent Developments
- 17.2.3.5. Financials (Based on Availability)
- 17.2.4 JBL (Harman International Industries Incorporate)
- 17.2.4.1. Overview
- 17.2.4.2. Products
- 17.2.4.3. SWOT Analysis
- 17.2.4.4. Recent Developments
- 17.2.4.5. Financials (Based on Availability)
- 17.2.5 Turtle Beach Corporation
- 17.2.5.1. Overview
- 17.2.5.2. Products
- 17.2.5.3. SWOT Analysis
- 17.2.5.4. Recent Developments
- 17.2.5.5. Financials (Based on Availability)
- 17.2.6 Microsoft Corporation
- 17.2.6.1. Overview
- 17.2.6.2. Products
- 17.2.6.3. SWOT Analysis
- 17.2.6.4. Recent Developments
- 17.2.6.5. Financials (Based on Availability)
- 17.2.7 Nintendo Co Ltd
- 17.2.7.1. Overview
- 17.2.7.2. Products
- 17.2.7.3. SWOT Analysis
- 17.2.7.4. Recent Developments
- 17.2.7.5. Financials (Based on Availability)
- 17.2.8 Koninklijke Philips NV
- 17.2.8.1. Overview
- 17.2.8.2. Products
- 17.2.8.3. SWOT Analysis
- 17.2.8.4. Recent Developments
- 17.2.8.5. Financials (Based on Availability)
- 17.2.9 Cooler Master Co Ltd (CMC)
- 17.2.9.1. Overview
- 17.2.9.2. Products
- 17.2.9.3. SWOT Analysis
- 17.2.9.4. Recent Developments
- 17.2.9.5. Financials (Based on Availability)
- 17.2.10 Sennheiser Electronic GmbH & Co KG
- 17.2.10.1. Overview
- 17.2.10.2. Products
- 17.2.10.3. SWOT Analysis
- 17.2.10.4. Recent Developments
- 17.2.10.5. Financials (Based on Availability)
- 17.2.11 AOC Internationa
- 17.2.11.1. Overview
- 17.2.11.2. Products
- 17.2.11.3. SWOT Analysis
- 17.2.11.4. Recent Developments
- 17.2.11.5. Financials (Based on Availability)
- 17.2.12 Razer Inc
- 17.2.12.1. Overview
- 17.2.12.2. Products
- 17.2.12.3. SWOT Analysis
- 17.2.12.4. Recent Developments
- 17.2.12.5. Financials (Based on Availability)
- 17.2.13 Reddragon (Eastern Times Technology Co Ltd)
- 17.2.13.1. Overview
- 17.2.13.2. Products
- 17.2.13.3. SWOT Analysis
- 17.2.13.4. Recent Developments
- 17.2.13.5. Financials (Based on Availability)
- 17.2.14 Logitech International SA
- 17.2.14.1. Overview
- 17.2.14.2. Products
- 17.2.14.3. SWOT Analysis
- 17.2.14.4. Recent Developments
- 17.2.14.5. Financials (Based on Availability)
- 17.2.15 Sony Corporation
- 17.2.15.1. Overview
- 17.2.15.2. Products
- 17.2.15.3. SWOT Analysis
- 17.2.15.4. Recent Developments
- 17.2.15.5. Financials (Based on Availability)
- 17.2.1 Alienware (Dell)
List of Figures
- Figure 1: Global PC Accessories Market Revenue Breakdown (Million, %) by Region 2024 & 2032
- Figure 2: Global PC Accessories Market Volume Breakdown (K Unit, %) by Region 2024 & 2032
- Figure 3: North America PC Accessories Market Revenue (Million), by Country 2024 & 2032
- Figure 4: North America PC Accessories Market Volume (K Unit), by Country 2024 & 2032
- Figure 5: North America PC Accessories Market Revenue Share (%), by Country 2024 & 2032
- Figure 6: North America PC Accessories Market Volume Share (%), by Country 2024 & 2032
- Figure 7: Europe PC Accessories Market Revenue (Million), by Country 2024 & 2032
- Figure 8: Europe PC Accessories Market Volume (K Unit), by Country 2024 & 2032
- Figure 9: Europe PC Accessories Market Revenue Share (%), by Country 2024 & 2032
- Figure 10: Europe PC Accessories Market Volume Share (%), by Country 2024 & 2032
- Figure 11: Asia Pacific PC Accessories Market Revenue (Million), by Country 2024 & 2032
- Figure 12: Asia Pacific PC Accessories Market Volume (K Unit), by Country 2024 & 2032
- Figure 13: Asia Pacific PC Accessories Market Revenue Share (%), by Country 2024 & 2032
- Figure 14: Asia Pacific PC Accessories Market Volume Share (%), by Country 2024 & 2032
- Figure 15: South America PC Accessories Market Revenue (Million), by Country 2024 & 2032
- Figure 16: South America PC Accessories Market Volume (K Unit), by Country 2024 & 2032
- Figure 17: South America PC Accessories Market Revenue Share (%), by Country 2024 & 2032
- Figure 18: South America PC Accessories Market Volume Share (%), by Country 2024 & 2032
- Figure 19: North America PC Accessories Market Revenue (Million), by Country 2024 & 2032
- Figure 20: North America PC Accessories Market Volume (K Unit), by Country 2024 & 2032
- Figure 21: North America PC Accessories Market Revenue Share (%), by Country 2024 & 2032
- Figure 22: North America PC Accessories Market Volume Share (%), by Country 2024 & 2032
- Figure 23: MEA PC Accessories Market Revenue (Million), by Country 2024 & 2032
- Figure 24: MEA PC Accessories Market Volume (K Unit), by Country 2024 & 2032
- Figure 25: MEA PC Accessories Market Revenue Share (%), by Country 2024 & 2032
- Figure 26: MEA PC Accessories Market Volume Share (%), by Country 2024 & 2032
- Figure 27: North America PC Accessories Market Revenue (Million), by Product 2024 & 2032
- Figure 28: North America PC Accessories Market Volume (K Unit), by Product 2024 & 2032
- Figure 29: North America PC Accessories Market Revenue Share (%), by Product 2024 & 2032
- Figure 30: North America PC Accessories Market Volume Share (%), by Product 2024 & 2032
- Figure 31: North America PC Accessories Market Revenue (Million), by Country 2024 & 2032
- Figure 32: North America PC Accessories Market Volume (K Unit), by Country 2024 & 2032
- Figure 33: North America PC Accessories Market Revenue Share (%), by Country 2024 & 2032
- Figure 34: North America PC Accessories Market Volume Share (%), by Country 2024 & 2032
- Figure 35: Europe PC Accessories Market Revenue (Million), by Product 2024 & 2032
- Figure 36: Europe PC Accessories Market Volume (K Unit), by Product 2024 & 2032
- Figure 37: Europe PC Accessories Market Revenue Share (%), by Product 2024 & 2032
- Figure 38: Europe PC Accessories Market Volume Share (%), by Product 2024 & 2032
- Figure 39: Europe PC Accessories Market Revenue (Million), by Country 2024 & 2032
- Figure 40: Europe PC Accessories Market Volume (K Unit), by Country 2024 & 2032
- Figure 41: Europe PC Accessories Market Revenue Share (%), by Country 2024 & 2032
- Figure 42: Europe PC Accessories Market Volume Share (%), by Country 2024 & 2032
- Figure 43: Asia Pacific PC Accessories Market Revenue (Million), by Product 2024 & 2032
- Figure 44: Asia Pacific PC Accessories Market Volume (K Unit), by Product 2024 & 2032
- Figure 45: Asia Pacific PC Accessories Market Revenue Share (%), by Product 2024 & 2032
- Figure 46: Asia Pacific PC Accessories Market Volume Share (%), by Product 2024 & 2032
- Figure 47: Asia Pacific PC Accessories Market Revenue (Million), by Country 2024 & 2032
- Figure 48: Asia Pacific PC Accessories Market Volume (K Unit), by Country 2024 & 2032
- Figure 49: Asia Pacific PC Accessories Market Revenue Share (%), by Country 2024 & 2032
- Figure 50: Asia Pacific PC Accessories Market Volume Share (%), by Country 2024 & 2032
- Figure 51: Latin America PC Accessories Market Revenue (Million), by Product 2024 & 2032
- Figure 52: Latin America PC Accessories Market Volume (K Unit), by Product 2024 & 2032
- Figure 53: Latin America PC Accessories Market Revenue Share (%), by Product 2024 & 2032
- Figure 54: Latin America PC Accessories Market Volume Share (%), by Product 2024 & 2032
- Figure 55: Latin America PC Accessories Market Revenue (Million), by Country 2024 & 2032
- Figure 56: Latin America PC Accessories Market Volume (K Unit), by Country 2024 & 2032
- Figure 57: Latin America PC Accessories Market Revenue Share (%), by Country 2024 & 2032
- Figure 58: Latin America PC Accessories Market Volume Share (%), by Country 2024 & 2032
- Figure 59: Middle East and Africa PC Accessories Market Revenue (Million), by Product 2024 & 2032
- Figure 60: Middle East and Africa PC Accessories Market Volume (K Unit), by Product 2024 & 2032
- Figure 61: Middle East and Africa PC Accessories Market Revenue Share (%), by Product 2024 & 2032
- Figure 62: Middle East and Africa PC Accessories Market Volume Share (%), by Product 2024 & 2032
- Figure 63: Middle East and Africa PC Accessories Market Revenue (Million), by Country 2024 & 2032
- Figure 64: Middle East and Africa PC Accessories Market Volume (K Unit), by Country 2024 & 2032
- Figure 65: Middle East and Africa PC Accessories Market Revenue Share (%), by Country 2024 & 2032
- Figure 66: Middle East and Africa PC Accessories Market Volume Share (%), by Country 2024 & 2032
List of Tables
- Table 1: Global PC Accessories Market Revenue Million Forecast, by Region 2019 & 2032
- Table 2: Global PC Accessories Market Volume K Unit Forecast, by Region 2019 & 2032
- Table 3: Global PC Accessories Market Revenue Million Forecast, by Product 2019 & 2032
- Table 4: Global PC Accessories Market Volume K Unit Forecast, by Product 2019 & 2032
- Table 5: Global PC Accessories Market Revenue Million Forecast, by Region 2019 & 2032
- Table 6: Global PC Accessories Market Volume K Unit Forecast, by Region 2019 & 2032
- Table 7: Global PC Accessories Market Revenue Million Forecast, by Country 2019 & 2032
- Table 8: Global PC Accessories Market Volume K Unit Forecast, by Country 2019 & 2032
- Table 9: United States PC Accessories Market Revenue (Million) Forecast, by Application 2019 & 2032
- Table 10: United States PC Accessories Market Volume (K Unit) Forecast, by Application 2019 & 2032
- Table 11: Canada PC Accessories Market Revenue (Million) Forecast, by Application 2019 & 2032
- Table 12: Canada PC Accessories Market Volume (K Unit) Forecast, by Application 2019 & 2032
- Table 13: Mexico PC Accessories Market Revenue (Million) Forecast, by Application 2019 & 2032
- Table 14: Mexico PC Accessories Market Volume (K Unit) Forecast, by Application 2019 & 2032
- Table 15: Global PC Accessories Market Revenue Million Forecast, by Country 2019 & 2032
- Table 16: Global PC Accessories Market Volume K Unit Forecast, by Country 2019 & 2032
- Table 17: Germany PC Accessories Market Revenue (Million) Forecast, by Application 2019 & 2032
- Table 18: Germany PC Accessories Market Volume (K Unit) Forecast, by Application 2019 & 2032
- Table 19: United Kingdom PC Accessories Market Revenue (Million) Forecast, by Application 2019 & 2032
- Table 20: United Kingdom PC Accessories Market Volume (K Unit) Forecast, by Application 2019 & 2032
- Table 21: France PC Accessories Market Revenue (Million) Forecast, by Application 2019 & 2032
- Table 22: France PC Accessories Market Volume (K Unit) Forecast, by Application 2019 & 2032
- Table 23: Spain PC Accessories Market Revenue (Million) Forecast, by Application 2019 & 2032
- Table 24: Spain PC Accessories Market Volume (K Unit) Forecast, by Application 2019 & 2032
- Table 25: Italy PC Accessories Market Revenue (Million) Forecast, by Application 2019 & 2032
- Table 26: Italy PC Accessories Market Volume (K Unit) Forecast, by Application 2019 & 2032
- Table 27: Spain PC Accessories Market Revenue (Million) Forecast, by Application 2019 & 2032
- Table 28: Spain PC Accessories Market Volume (K Unit) Forecast, by Application 2019 & 2032
- Table 29: Belgium PC Accessories Market Revenue (Million) Forecast, by Application 2019 & 2032
- Table 30: Belgium PC Accessories Market Volume (K Unit) Forecast, by Application 2019 & 2032
- Table 31: Netherland PC Accessories Market Revenue (Million) Forecast, by Application 2019 & 2032
- Table 32: Netherland PC Accessories Market Volume (K Unit) Forecast, by Application 2019 & 2032
- Table 33: Nordics PC Accessories Market Revenue (Million) Forecast, by Application 2019 & 2032
- Table 34: Nordics PC Accessories Market Volume (K Unit) Forecast, by Application 2019 & 2032
- Table 35: Rest of Europe PC Accessories Market Revenue (Million) Forecast, by Application 2019 & 2032
- Table 36: Rest of Europe PC Accessories Market Volume (K Unit) Forecast, by Application 2019 & 2032
- Table 37: Global PC Accessories Market Revenue Million Forecast, by Country 2019 & 2032
- Table 38: Global PC Accessories Market Volume K Unit Forecast, by Country 2019 & 2032
- Table 39: China PC Accessories Market Revenue (Million) Forecast, by Application 2019 & 2032
- Table 40: China PC Accessories Market Volume (K Unit) Forecast, by Application 2019 & 2032
- Table 41: Japan PC Accessories Market Revenue (Million) Forecast, by Application 2019 & 2032
- Table 42: Japan PC Accessories Market Volume (K Unit) Forecast, by Application 2019 & 2032
- Table 43: India PC Accessories Market Revenue (Million) Forecast, by Application 2019 & 2032
- Table 44: India PC Accessories Market Volume (K Unit) Forecast, by Application 2019 & 2032
- Table 45: South Korea PC Accessories Market Revenue (Million) Forecast, by Application 2019 & 2032
- Table 46: South Korea PC Accessories Market Volume (K Unit) Forecast, by Application 2019 & 2032
- Table 47: Southeast Asia PC Accessories Market Revenue (Million) Forecast, by Application 2019 & 2032
- Table 48: Southeast Asia PC Accessories Market Volume (K Unit) Forecast, by Application 2019 & 2032
- Table 49: Australia PC Accessories Market Revenue (Million) Forecast, by Application 2019 & 2032
- Table 50: Australia PC Accessories Market Volume (K Unit) Forecast, by Application 2019 & 2032
- Table 51: Indonesia PC Accessories Market Revenue (Million) Forecast, by Application 2019 & 2032
- Table 52: Indonesia PC Accessories Market Volume (K Unit) Forecast, by Application 2019 & 2032
- Table 53: Phillipes PC Accessories Market Revenue (Million) Forecast, by Application 2019 & 2032
- Table 54: Phillipes PC Accessories Market Volume (K Unit) Forecast, by Application 2019 & 2032
- Table 55: Singapore PC Accessories Market Revenue (Million) Forecast, by Application 2019 & 2032
- Table 56: Singapore PC Accessories Market Volume (K Unit) Forecast, by Application 2019 & 2032
- Table 57: Thailandc PC Accessories Market Revenue (Million) Forecast, by Application 2019 & 2032
- Table 58: Thailandc PC Accessories Market Volume (K Unit) Forecast, by Application 2019 & 2032
- Table 59: Rest of Asia Pacific PC Accessories Market Revenue (Million) Forecast, by Application 2019 & 2032
- Table 60: Rest of Asia Pacific PC Accessories Market Volume (K Unit) Forecast, by Application 2019 & 2032
- Table 61: Global PC Accessories Market Revenue Million Forecast, by Country 2019 & 2032
- Table 62: Global PC Accessories Market Volume K Unit Forecast, by Country 2019 & 2032
- Table 63: Brazil PC Accessories Market Revenue (Million) Forecast, by Application 2019 & 2032
- Table 64: Brazil PC Accessories Market Volume (K Unit) Forecast, by Application 2019 & 2032
- Table 65: Argentina PC Accessories Market Revenue (Million) Forecast, by Application 2019 & 2032
- Table 66: Argentina PC Accessories Market Volume (K Unit) Forecast, by Application 2019 & 2032
- Table 67: Peru PC Accessories Market Revenue (Million) Forecast, by Application 2019 & 2032
- Table 68: Peru PC Accessories Market Volume (K Unit) Forecast, by Application 2019 & 2032
- Table 69: Chile PC Accessories Market Revenue (Million) Forecast, by Application 2019 & 2032
- Table 70: Chile PC Accessories Market Volume (K Unit) Forecast, by Application 2019 & 2032
- Table 71: Colombia PC Accessories Market Revenue (Million) Forecast, by Application 2019 & 2032
- Table 72: Colombia PC Accessories Market Volume (K Unit) Forecast, by Application 2019 & 2032
- Table 73: Ecuador PC Accessories Market Revenue (Million) Forecast, by Application 2019 & 2032
- Table 74: Ecuador PC Accessories Market Volume (K Unit) Forecast, by Application 2019 & 2032
- Table 75: Venezuela PC Accessories Market Revenue (Million) Forecast, by Application 2019 & 2032
- Table 76: Venezuela PC Accessories Market Volume (K Unit) Forecast, by Application 2019 & 2032
- Table 77: Rest of South America PC Accessories Market Revenue (Million) Forecast, by Application 2019 & 2032
- Table 78: Rest of South America PC Accessories Market Volume (K Unit) Forecast, by Application 2019 & 2032
- Table 79: Global PC Accessories Market Revenue Million Forecast, by Country 2019 & 2032
- Table 80: Global PC Accessories Market Volume K Unit Forecast, by Country 2019 & 2032
- Table 81: United States PC Accessories Market Revenue (Million) Forecast, by Application 2019 & 2032
- Table 82: United States PC Accessories Market Volume (K Unit) Forecast, by Application 2019 & 2032
- Table 83: Canada PC Accessories Market Revenue (Million) Forecast, by Application 2019 & 2032
- Table 84: Canada PC Accessories Market Volume (K Unit) Forecast, by Application 2019 & 2032
- Table 85: Mexico PC Accessories Market Revenue (Million) Forecast, by Application 2019 & 2032
- Table 86: Mexico PC Accessories Market Volume (K Unit) Forecast, by Application 2019 & 2032
- Table 87: Global PC Accessories Market Revenue Million Forecast, by Country 2019 & 2032
- Table 88: Global PC Accessories Market Volume K Unit Forecast, by Country 2019 & 2032
- Table 89: United Arab Emirates PC Accessories Market Revenue (Million) Forecast, by Application 2019 & 2032
- Table 90: United Arab Emirates PC Accessories Market Volume (K Unit) Forecast, by Application 2019 & 2032
- Table 91: Saudi Arabia PC Accessories Market Revenue (Million) Forecast, by Application 2019 & 2032
- Table 92: Saudi Arabia PC Accessories Market Volume (K Unit) Forecast, by Application 2019 & 2032
- Table 93: South Africa PC Accessories Market Revenue (Million) Forecast, by Application 2019 & 2032
- Table 94: South Africa PC Accessories Market Volume (K Unit) Forecast, by Application 2019 & 2032
- Table 95: Rest of Middle East and Africa PC Accessories Market Revenue (Million) Forecast, by Application 2019 & 2032
- Table 96: Rest of Middle East and Africa PC Accessories Market Volume (K Unit) Forecast, by Application 2019 & 2032
- Table 97: Global PC Accessories Market Revenue Million Forecast, by Product 2019 & 2032
- Table 98: Global PC Accessories Market Volume K Unit Forecast, by Product 2019 & 2032
- Table 99: Global PC Accessories Market Revenue Million Forecast, by Country 2019 & 2032
- Table 100: Global PC Accessories Market Volume K Unit Forecast, by Country 2019 & 2032
- Table 101: United States PC Accessories Market Revenue (Million) Forecast, by Application 2019 & 2032
- Table 102: United States PC Accessories Market Volume (K Unit) Forecast, by Application 2019 & 2032
- Table 103: Canada PC Accessories Market Revenue (Million) Forecast, by Application 2019 & 2032
- Table 104: Canada PC Accessories Market Volume (K Unit) Forecast, by Application 2019 & 2032
- Table 105: Global PC Accessories Market Revenue Million Forecast, by Product 2019 & 2032
- Table 106: Global PC Accessories Market Volume K Unit Forecast, by Product 2019 & 2032
- Table 107: Global PC Accessories Market Revenue Million Forecast, by Country 2019 & 2032
- Table 108: Global PC Accessories Market Volume K Unit Forecast, by Country 2019 & 2032
- Table 109: Germany PC Accessories Market Revenue (Million) Forecast, by Application 2019 & 2032
- Table 110: Germany PC Accessories Market Volume (K Unit) Forecast, by Application 2019 & 2032
- Table 111: United Kingdom PC Accessories Market Revenue (Million) Forecast, by Application 2019 & 2032
- Table 112: United Kingdom PC Accessories Market Volume (K Unit) Forecast, by Application 2019 & 2032
- Table 113: France PC Accessories Market Revenue (Million) Forecast, by Application 2019 & 2032
- Table 114: France PC Accessories Market Volume (K Unit) Forecast, by Application 2019 & 2032
- Table 115: Italy PC Accessories Market Revenue (Million) Forecast, by Application 2019 & 2032
- Table 116: Italy PC Accessories Market Volume (K Unit) Forecast, by Application 2019 & 2032
- Table 117: Russia PC Accessories Market Revenue (Million) Forecast, by Application 2019 & 2032
- Table 118: Russia PC Accessories Market Volume (K Unit) Forecast, by Application 2019 & 2032
- Table 119: Switzerland PC Accessories Market Revenue (Million) Forecast, by Application 2019 & 2032
- Table 120: Switzerland PC Accessories Market Volume (K Unit) Forecast, by Application 2019 & 2032
- Table 121: Global PC Accessories Market Revenue Million Forecast, by Product 2019 & 2032
- Table 122: Global PC Accessories Market Volume K Unit Forecast, by Product 2019 & 2032
- Table 123: Global PC Accessories Market Revenue Million Forecast, by Country 2019 & 2032
- Table 124: Global PC Accessories Market Volume K Unit Forecast, by Country 2019 & 2032
- Table 125: China PC Accessories Market Revenue (Million) Forecast, by Application 2019 & 2032
- Table 126: China PC Accessories Market Volume (K Unit) Forecast, by Application 2019 & 2032
- Table 127: Japan PC Accessories Market Revenue (Million) Forecast, by Application 2019 & 2032
- Table 128: Japan PC Accessories Market Volume (K Unit) Forecast, by Application 2019 & 2032
- Table 129: South Korea PC Accessories Market Revenue (Million) Forecast, by Application 2019 & 2032
- Table 130: South Korea PC Accessories Market Volume (K Unit) Forecast, by Application 2019 & 2032
- Table 131: Australia and New Zealand PC Accessories Market Revenue (Million) Forecast, by Application 2019 & 2032
- Table 132: Australia and New Zealand PC Accessories Market Volume (K Unit) Forecast, by Application 2019 & 2032
- Table 133: Global PC Accessories Market Revenue Million Forecast, by Product 2019 & 2032
- Table 134: Global PC Accessories Market Volume K Unit Forecast, by Product 2019 & 2032
- Table 135: Global PC Accessories Market Revenue Million Forecast, by Country 2019 & 2032
- Table 136: Global PC Accessories Market Volume K Unit Forecast, by Country 2019 & 2032
- Table 137: Brazil PC Accessories Market Revenue (Million) Forecast, by Application 2019 & 2032
- Table 138: Brazil PC Accessories Market Volume (K Unit) Forecast, by Application 2019 & 2032
- Table 139: Mexico PC Accessories Market Revenue (Million) Forecast, by Application 2019 & 2032
- Table 140: Mexico PC Accessories Market Volume (K Unit) Forecast, by Application 2019 & 2032
- Table 141: Global PC Accessories Market Revenue Million Forecast, by Product 2019 & 2032
- Table 142: Global PC Accessories Market Volume K Unit Forecast, by Product 2019 & 2032
- Table 143: Global PC Accessories Market Revenue Million Forecast, by Country 2019 & 2032
- Table 144: Global PC Accessories Market Volume K Unit Forecast, by Country 2019 & 2032
- Table 145: United Arab Emirates PC Accessories Market Revenue (Million) Forecast, by Application 2019 & 2032
- Table 146: United Arab Emirates PC Accessories Market Volume (K Unit) Forecast, by Application 2019 & 2032
- Table 147: Saudi Arabia PC Accessories Market Revenue (Million) Forecast, by Application 2019 & 2032
- Table 148: Saudi Arabia PC Accessories Market Volume (K Unit) Forecast, by Application 2019 & 2032
- Table 149: South Africa PC Accessories Market Revenue (Million) Forecast, by Application 2019 & 2032
- Table 150: South Africa PC Accessories Market Volume (K Unit) Forecast, by Application 2019 & 2032
Frequently Asked Questions
1. What is the projected Compound Annual Growth Rate (CAGR) of the PC Accessories Market?
The projected CAGR is approximately 12.13%.
2. Which companies are prominent players in the PC Accessories Market?
Key companies in the market include Alienware (Dell), Corsair Gaming Inc, Mad Catz Global Limited, JBL (Harman International Industries Incorporate), Turtle Beach Corporation, Microsoft Corporation, Nintendo Co Ltd, Koninklijke Philips NV, Cooler Master Co Ltd (CMC), Sennheiser Electronic GmbH & Co KG, AOC Internationa, Razer Inc, Reddragon (Eastern Times Technology Co Ltd), Logitech International SA, Sony Corporation.
3. What are the main segments of the PC Accessories Market?
The market segments include Product.
4. Can you provide details about the market size?
The market size is estimated to be USD 27.58 Million as of 2022.
5. What are some drivers contributing to market growth?
Rising Adoption of Wireless Technologies; Emergence of Technologies Such as AR. VR. and AI; Adoption of Gaming Platforms Such as E-sports.
6. What are the notable trends driving market growth?
Emergence of Technologies such as AR. VR. and AI to Drive the Market.
7. Are there any restraints impacting market growth?
Fluctuation in the Production of Silicon Chips is Leading to a Shortage in the Demand for Gaming Accessories.
8. Can you provide examples of recent developments in the market?
April 2024 - Qualcomm Technologies, Inc. expands the leading Snapdragon X Series platform portfolio with Snapdragon X Plus. Snapdragon X Plus features the advanced Qualcomm Oryon CPU, a custom-integrated processor that delivers up to 37% faster CPU performance than competitors while consuming up to 54% less power.
9. What pricing options are available for accessing the report?
Pricing options include single-user, multi-user, and enterprise licenses priced at USD 4750, USD 5250, and USD 8750 respectively.
10. Is the market size provided in terms of value or volume?
The market size is provided in terms of value, measured in Million and volume, measured in K Unit.
11. Are there any specific market keywords associated with the report?
Yes, the market keyword associated with the report is "PC Accessories Market," which aids in identifying and referencing the specific market segment covered.
12. How do I determine which pricing option suits my needs best?
The pricing options vary based on user requirements and access needs. Individual users may opt for single-user licenses, while businesses requiring broader access may choose multi-user or enterprise licenses for cost-effective access to the report.
13. Are there any additional resources or data provided in the PC Accessories Market report?
While the report offers comprehensive insights, it's advisable to review the specific contents or supplementary materials provided to ascertain if additional resources or data are available.
14. How can I stay updated on further developments or reports in the PC Accessories Market?
To stay informed about further developments, trends, and reports in the PC Accessories Market, consider subscribing to industry newsletters, following relevant companies and organizations, or regularly checking reputable industry news sources and publications.
Methodology
Step 1 - Identification of Relevant Samples Size from Population Database


Step 2 - Approaches for Defining Global Market Size (Value, Volume* & Price*)

Note*: In applicable scenarios
Step 3 - Data Sources
Primary Research
- Web Analytics
- Survey Reports
- Research Institute
- Latest Research Reports
- Opinion Leaders
Secondary Research
- Annual Reports
- White Paper
- Latest Press Release
- Industry Association
- Paid Database
- Investor Presentations

Step 4 - Data Triangulation
Involves using different sources of information in order to increase the validity of a study
These sources are likely to be stakeholders in a program - participants, other researchers, program staff, other community members, and so on.
Then we put all data in single framework & apply various statistical tools to find out the dynamic on the market.
During the analysis stage, feedback from the stakeholder groups would be compared to determine areas of agreement as well as areas of divergence
