

Key Insights
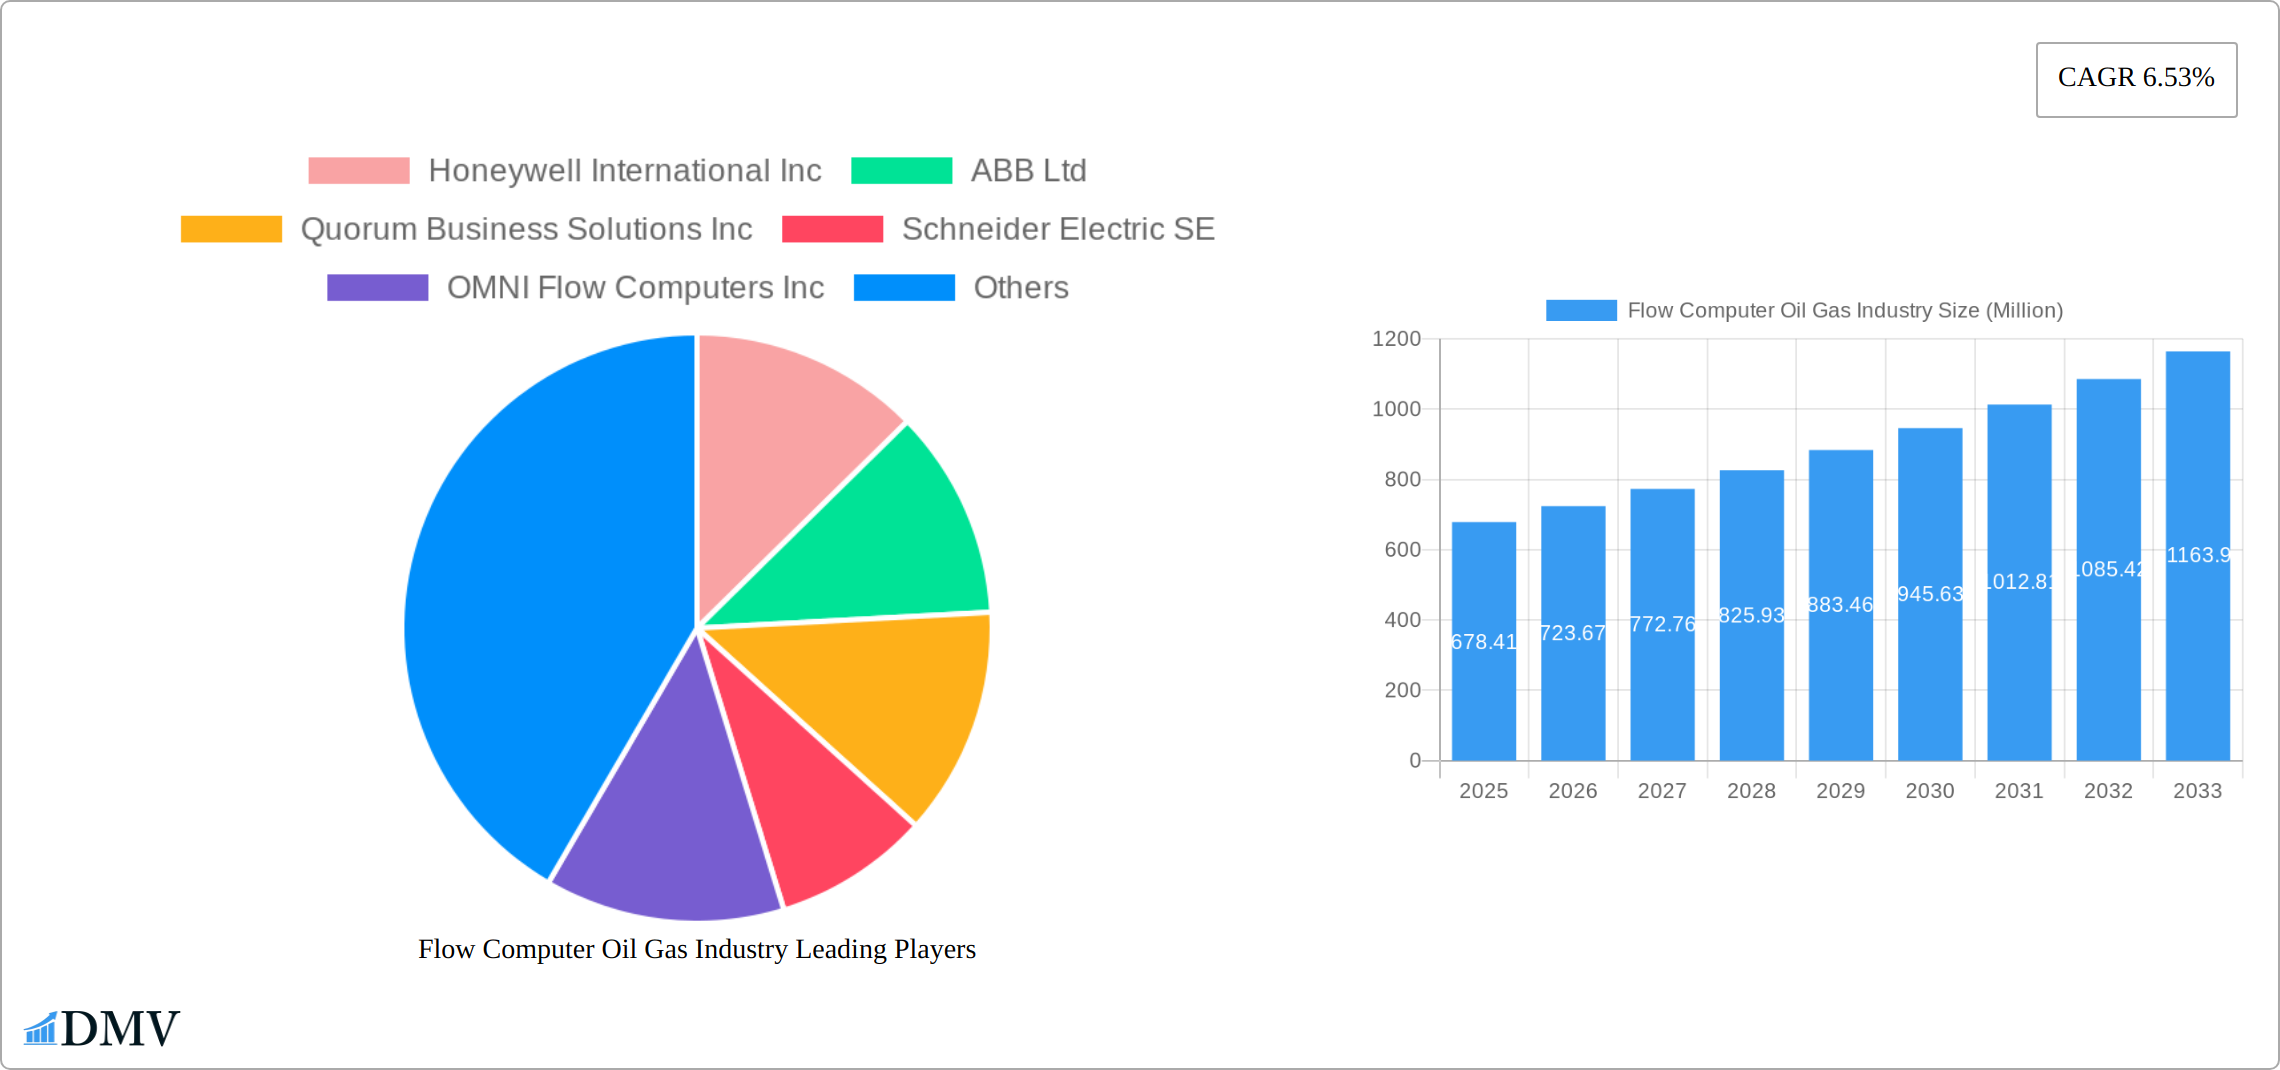
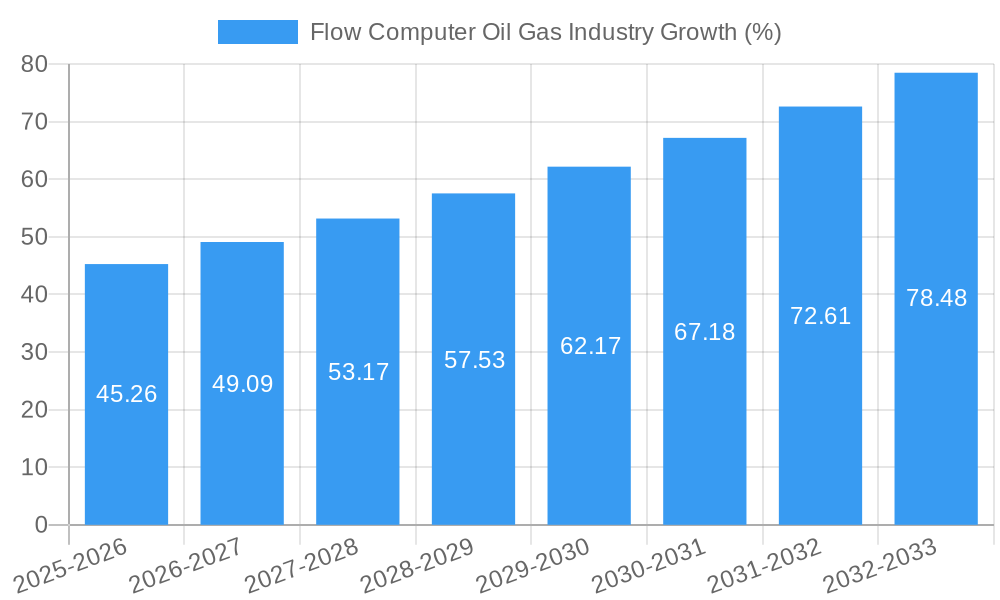
The flow computer oil and gas market, currently valued at $678.41 million in 2025, is projected to experience robust growth, driven by increasing demand for enhanced oil recovery techniques and the need for precise measurement and control in oil and gas production. The market's Compound Annual Growth Rate (CAGR) of 6.53% from 2025 to 2033 indicates a significant expansion over the forecast period. Key drivers include the rising adoption of automation and digitalization in the oil and gas industry to improve operational efficiency and reduce human error. Furthermore, stringent environmental regulations and the growing focus on emissions reduction are pushing the adoption of advanced flow computers capable of precise metering and monitoring, thus minimizing waste and environmental impact. The market segmentation by offering (hardware and software) reflects the integrated nature of flow computer systems, with software components playing a crucial role in data analysis and process optimization. Major players like Honeywell, ABB, and Schneider Electric are leveraging their expertise in automation and control systems to consolidate their market share. However, challenges such as high initial investment costs and the need for specialized expertise in implementation and maintenance could act as potential restraints on market growth.
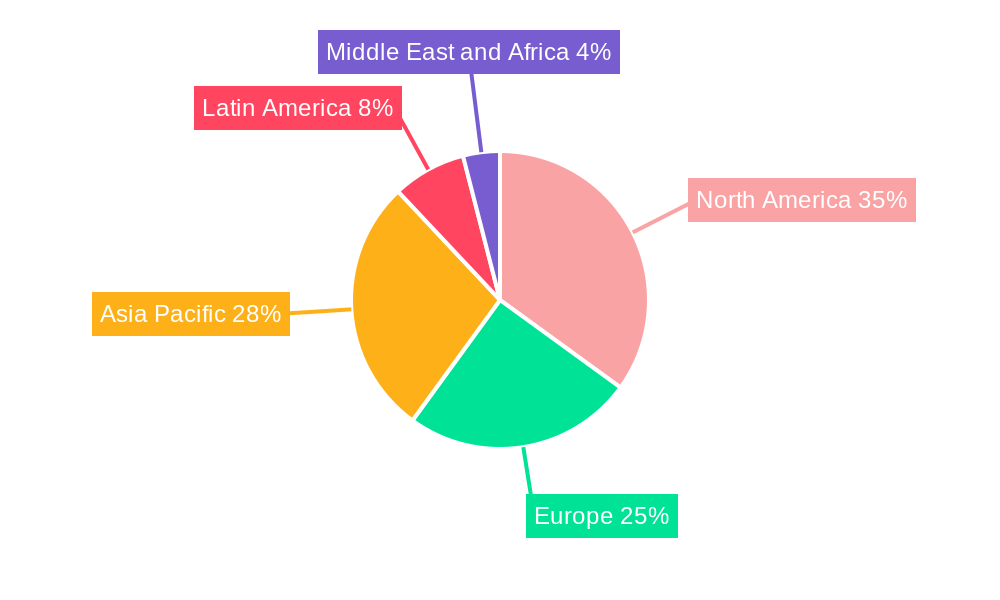
The regional distribution of the market is expected to be diverse, with North America likely holding a significant share due to the mature oil and gas infrastructure and substantial investments in technology upgrades. However, the Asia-Pacific region is anticipated to witness substantial growth, fueled by the rapid expansion of oil and gas production and exploration activities in countries like China and India. Europe and the Middle East and Africa regions will also contribute to the market's overall growth, albeit at potentially slower paces relative to the Asia-Pacific region. Continuous technological advancements, including the integration of Artificial Intelligence (AI) and Machine Learning (ML) in flow computer systems, are expected to open up new avenues for growth and efficiency improvements throughout the forecast period, shaping a future of more intelligent and environmentally conscious oil and gas operations.
Flow Computer Oil & Gas Industry Market Report: 2019-2033
This comprehensive report provides an in-depth analysis of the Flow Computer Oil & Gas Industry, offering critical insights into market dynamics, competitive landscapes, and future growth potential. Covering the period 2019-2033, with a base year of 2025 and forecast extending to 2033, this report is an invaluable resource for stakeholders seeking to navigate this evolving market. The study incorporates data from the historical period (2019-2024) and provides crucial estimations for 2025. This report is presented without modification.
Flow Computer Oil & Gas Industry Market Composition & Trends
This section evaluates the market concentration, innovation drivers, regulatory landscape, substitute products, end-user profiles, and merger & acquisition (M&A) activities within the flow computer oil and gas industry. The market is characterized by a moderately concentrated landscape, with key players like Honeywell International Inc., ABB Ltd., and Emerson Electric Company holding significant market share. However, smaller, specialized companies are also emerging, introducing niche innovations.
- Market Share Distribution (2025 Estimate): Honeywell (15%), ABB (12%), Emerson (10%), Others (63%). These figures represent a combined market value exceeding $xx Million.
- Innovation Catalysts: Increasing demand for automation, enhanced data analytics, and stringent emission regulations are driving innovation.
- Regulatory Landscape: Stringent safety and environmental regulations are shaping industry practices, influencing the adoption of advanced flow computers.
- Substitute Products: While few direct substitutes exist, alternative measurement technologies present indirect competition.
- End-User Profiles: Major end-users include upstream and downstream oil & gas companies, pipeline operators, and refining facilities.
- M&A Activities: The past five years have witnessed significant M&A activity, with deal values exceeding $xx Million annually, driven by the consolidation of market share and technological acquisition. Notable deals included [mention specific deal examples, if available, otherwise state 'data unavailable'].
Flow Computer Oil & Gas Industry Industry Evolution
The flow computer oil and gas industry has experienced significant evolution driven by technological advancements and changing consumer demands. The market witnessed a Compound Annual Growth Rate (CAGR) of xx% during the historical period (2019-2024), reaching a market size of $xx Million in 2024. This growth is projected to continue, with a forecasted CAGR of xx% from 2025 to 2033, reaching a market size of $xx Million by 2033. This growth is fueled by increasing automation in oil and gas operations, the implementation of smart meters and sensors to manage and optimize oil and gas production and transportation, and increasing demand for improved data analytics and reporting capabilities. The adoption rate of advanced flow computer technologies, such as those incorporating artificial intelligence and machine learning, is increasing, driving higher efficiency and reducing operational costs. The demand for cloud-based solutions and remote monitoring capabilities is also on the rise, driven by the need for improved accessibility and real-time data analysis.
Leading Regions, Countries, or Segments in Flow Computer Oil & Gas Industry
North America currently dominates the flow computer market, driven by robust oil and gas production activities and significant investments in infrastructure modernization. Within this region, the United States holds the largest share.
Key Drivers for North American Dominance:
- High Oil & Gas Production: The region is a major producer of oil and gas, creating a large demand for flow computers.
- Technological Advancements: Significant investments in R&D are driving innovation in flow computer technologies within the region.
- Favorable Regulatory Environment: While stringent, regulatory frameworks encourage the adoption of advanced technologies for enhanced safety and environmental compliance.
By Offering:
The Hardware segment holds a larger market share compared to the Software segment due to the substantial capital expenditure required for hardware installations. However, software solutions are experiencing faster growth rates, driven by increasing demand for data analytics and remote monitoring capabilities.
Flow Computer Oil & Gas Industry Product Innovations
Recent innovations in flow computers include the integration of advanced analytics capabilities, enabling predictive maintenance and optimized resource allocation. The development of more compact and ruggedized designs is also improving deployment flexibility in challenging environments. The rise of cloud-based platforms allows for remote monitoring and data access, enhancing operational efficiency. Unique selling propositions include improved accuracy, reduced maintenance requirements, and enhanced cybersecurity features.
Propelling Factors for Flow Computer Oil & Gas Industry Growth
The industry's growth is driven by several key factors:
- Automation and Digitalization: The increasing demand for automation and digitalization in oil and gas operations is a primary driver, pushing the adoption of advanced flow computer technologies.
- Enhanced Data Analytics: The need for improved data analytics and real-time monitoring capabilities is creating significant opportunities for flow computer vendors.
- Stringent Regulations: Stricter environmental regulations are driving the need for accurate measurement and monitoring of hydrocarbon flows.
Obstacles in the Flow Computer Oil & Gas Industry Market
Challenges facing the industry include:
- High Initial Investment Costs: The high cost of implementing flow computer systems can be a barrier for smaller companies.
- Cybersecurity Threats: The increasing reliance on networked systems raises concerns about cybersecurity vulnerabilities.
- Supply Chain Disruptions: Supply chain constraints due to geopolitical factors and economic fluctuations can impact availability and pricing.
Future Opportunities in Flow Computer Oil & Gas Industry
Future growth opportunities lie in:
- Expansion into Emerging Markets: Developing countries with growing oil and gas sectors represent substantial untapped potential.
- Integration of AI and Machine Learning: Further integration of AI and machine learning algorithms can enhance predictive capabilities and optimize operations.
- Development of Wireless and IoT-enabled solutions: Wireless technology and integration with the Internet of Things (IoT) are poised to further enhance connectivity and data accessibility.
Major Players in the Flow Computer Oil & Gas Industry Ecosystem
- Honeywell International Inc
- ABB Ltd
- Quorum Business Solutions Inc
- Schneider Electric SE
- OMNI Flow Computers Inc
- Yokogawa Electric Corporation
- Bedrock Automation Platforms Inc (Maxim Integrated Products Inc)
- Flowmetrics Inc
- Dynamic Flow Computers Inc
- Emerson Electric Company
Key Developments in Flow Computer Oil & Gas Industry Industry
- 2022-Q4: Emerson Electric Company launched a new line of advanced flow computers with enhanced cybersecurity features.
- 2023-Q1: ABB Ltd. acquired a smaller flow computer company, expanding its product portfolio. [Add other relevant developments with dates as available].
Strategic Flow Computer Oil & Gas Industry Market Forecast
The flow computer market is poised for continued growth, driven by the increasing adoption of automation technologies, stringent regulatory requirements, and the expanding oil and gas production in various regions. The integration of advanced analytics and AI/ML capabilities, coupled with the expansion into emerging markets, will further propel the industry’s growth trajectory in the coming years. The market is expected to witness significant innovation and consolidation, offering substantial opportunities for both established players and emerging companies.
Flow Computer Oil Gas Industry Segmentation
-
1. Offering
- 1.1. Hardware
- 1.2. Software
Flow Computer Oil Gas Industry Segmentation By Geography
- 1. North America
- 2. Europe
- 3. Asia Pacific
- 4. Latin America
- 5. Middle East and Africa
Flow Computer Oil Gas Industry REPORT HIGHLIGHTS
| Aspects | Details |
|---|---|
| Study Period | 2019-2033 |
| Base Year | 2024 |
| Estimated Year | 2025 |
| Forecast Period | 2025-2033 |
| Historical Period | 2019-2024 |
| Growth Rate | CAGR of 6.53% from 2019-2033 |
| Segmentation |
|
Table of Contents
- 1. Introduction
- 1.1. Research Scope
- 1.2. Market Segmentation
- 1.3. Research Methodology
- 1.4. Definitions and Assumptions
- 2. Executive Summary
- 2.1. Introduction
- 3. Market Dynamics
- 3.1. Introduction
- 3.2. Market Drivers
- 3.2.1. ; Growing Need for Reliable Flow and High-tech Computing Systems; Continually Evolving Data Computational Capacity of Flow Computers
- 3.3. Market Restrains
- 3.3.1. ; Cyber-Security Threats Deterring Deployment of Advanced Flow Computer Systems; Dynamic Changes in Oil & Gas Prices leading to Reduced Investment in Infrastructure
- 3.4. Market Trends
- 3.4.1. Evolving Data Computational Capacity of Flow Computers
- 4. Market Factor Analysis
- 4.1. Porters Five Forces
- 4.2. Supply/Value Chain
- 4.3. PESTEL analysis
- 4.4. Market Entropy
- 4.5. Patent/Trademark Analysis
- 5. Global Flow Computer Oil Gas Industry Analysis, Insights and Forecast, 2019-2031
- 5.1. Market Analysis, Insights and Forecast - by Offering
- 5.1.1. Hardware
- 5.1.2. Software
- 5.2. Market Analysis, Insights and Forecast - by Region
- 5.2.1. North America
- 5.2.2. Europe
- 5.2.3. Asia Pacific
- 5.2.4. Latin America
- 5.2.5. Middle East and Africa
- 5.1. Market Analysis, Insights and Forecast - by Offering
- 6. North America Flow Computer Oil Gas Industry Analysis, Insights and Forecast, 2019-2031
- 6.1. Market Analysis, Insights and Forecast - by Offering
- 6.1.1. Hardware
- 6.1.2. Software
- 6.1. Market Analysis, Insights and Forecast - by Offering
- 7. Europe Flow Computer Oil Gas Industry Analysis, Insights and Forecast, 2019-2031
- 7.1. Market Analysis, Insights and Forecast - by Offering
- 7.1.1. Hardware
- 7.1.2. Software
- 7.1. Market Analysis, Insights and Forecast - by Offering
- 8. Asia Pacific Flow Computer Oil Gas Industry Analysis, Insights and Forecast, 2019-2031
- 8.1. Market Analysis, Insights and Forecast - by Offering
- 8.1.1. Hardware
- 8.1.2. Software
- 8.1. Market Analysis, Insights and Forecast - by Offering
- 9. Latin America Flow Computer Oil Gas Industry Analysis, Insights and Forecast, 2019-2031
- 9.1. Market Analysis, Insights and Forecast - by Offering
- 9.1.1. Hardware
- 9.1.2. Software
- 9.1. Market Analysis, Insights and Forecast - by Offering
- 10. Middle East and Africa Flow Computer Oil Gas Industry Analysis, Insights and Forecast, 2019-2031
- 10.1. Market Analysis, Insights and Forecast - by Offering
- 10.1.1. Hardware
- 10.1.2. Software
- 10.1. Market Analysis, Insights and Forecast - by Offering
- 11. North America Flow Computer Oil Gas Industry Analysis, Insights and Forecast, 2019-2031
- 11.1. Market Analysis, Insights and Forecast - By Country/Sub-region
- 11.1.1.
- 12. Europe Flow Computer Oil Gas Industry Analysis, Insights and Forecast, 2019-2031
- 12.1. Market Analysis, Insights and Forecast - By Country/Sub-region
- 12.1.1.
- 13. Asia Pacific Flow Computer Oil Gas Industry Analysis, Insights and Forecast, 2019-2031
- 13.1. Market Analysis, Insights and Forecast - By Country/Sub-region
- 13.1.1.
- 14. Latin America Flow Computer Oil Gas Industry Analysis, Insights and Forecast, 2019-2031
- 14.1. Market Analysis, Insights and Forecast - By Country/Sub-region
- 14.1.1.
- 15. Middle East and Africa Flow Computer Oil Gas Industry Analysis, Insights and Forecast, 2019-2031
- 15.1. Market Analysis, Insights and Forecast - By Country/Sub-region
- 15.1.1.
- 16. Competitive Analysis
- 16.1. Global Market Share Analysis 2024
- 16.2. Company Profiles
- 16.2.1 Honeywell International Inc
- 16.2.1.1. Overview
- 16.2.1.2. Products
- 16.2.1.3. SWOT Analysis
- 16.2.1.4. Recent Developments
- 16.2.1.5. Financials (Based on Availability)
- 16.2.2 ABB Ltd
- 16.2.2.1. Overview
- 16.2.2.2. Products
- 16.2.2.3. SWOT Analysis
- 16.2.2.4. Recent Developments
- 16.2.2.5. Financials (Based on Availability)
- 16.2.3 Quorum Business Solutions Inc
- 16.2.3.1. Overview
- 16.2.3.2. Products
- 16.2.3.3. SWOT Analysis
- 16.2.3.4. Recent Developments
- 16.2.3.5. Financials (Based on Availability)
- 16.2.4 Schneider Electric SE
- 16.2.4.1. Overview
- 16.2.4.2. Products
- 16.2.4.3. SWOT Analysis
- 16.2.4.4. Recent Developments
- 16.2.4.5. Financials (Based on Availability)
- 16.2.5 OMNI Flow Computers Inc
- 16.2.5.1. Overview
- 16.2.5.2. Products
- 16.2.5.3. SWOT Analysis
- 16.2.5.4. Recent Developments
- 16.2.5.5. Financials (Based on Availability)
- 16.2.6 Yokogawa Electric Corporation
- 16.2.6.1. Overview
- 16.2.6.2. Products
- 16.2.6.3. SWOT Analysis
- 16.2.6.4. Recent Developments
- 16.2.6.5. Financials (Based on Availability)
- 16.2.7 Bedrock Automation Platforms Inc (Maxim Integrated Products Inc )
- 16.2.7.1. Overview
- 16.2.7.2. Products
- 16.2.7.3. SWOT Analysis
- 16.2.7.4. Recent Developments
- 16.2.7.5. Financials (Based on Availability)
- 16.2.8 Flowmetrics Inc *List Not Exhaustive
- 16.2.8.1. Overview
- 16.2.8.2. Products
- 16.2.8.3. SWOT Analysis
- 16.2.8.4. Recent Developments
- 16.2.8.5. Financials (Based on Availability)
- 16.2.9 Dynamic Flow Computers Inc
- 16.2.9.1. Overview
- 16.2.9.2. Products
- 16.2.9.3. SWOT Analysis
- 16.2.9.4. Recent Developments
- 16.2.9.5. Financials (Based on Availability)
- 16.2.10 Emerson Electric Company
- 16.2.10.1. Overview
- 16.2.10.2. Products
- 16.2.10.3. SWOT Analysis
- 16.2.10.4. Recent Developments
- 16.2.10.5. Financials (Based on Availability)
- 16.2.1 Honeywell International Inc
List of Figures
- Figure 1: Global Flow Computer Oil Gas Industry Revenue Breakdown (Million, %) by Region 2024 & 2032
- Figure 2: North America Flow Computer Oil Gas Industry Revenue (Million), by Country 2024 & 2032
- Figure 3: North America Flow Computer Oil Gas Industry Revenue Share (%), by Country 2024 & 2032
- Figure 4: Europe Flow Computer Oil Gas Industry Revenue (Million), by Country 2024 & 2032
- Figure 5: Europe Flow Computer Oil Gas Industry Revenue Share (%), by Country 2024 & 2032
- Figure 6: Asia Pacific Flow Computer Oil Gas Industry Revenue (Million), by Country 2024 & 2032
- Figure 7: Asia Pacific Flow Computer Oil Gas Industry Revenue Share (%), by Country 2024 & 2032
- Figure 8: Latin America Flow Computer Oil Gas Industry Revenue (Million), by Country 2024 & 2032
- Figure 9: Latin America Flow Computer Oil Gas Industry Revenue Share (%), by Country 2024 & 2032
- Figure 10: Middle East and Africa Flow Computer Oil Gas Industry Revenue (Million), by Country 2024 & 2032
- Figure 11: Middle East and Africa Flow Computer Oil Gas Industry Revenue Share (%), by Country 2024 & 2032
- Figure 12: North America Flow Computer Oil Gas Industry Revenue (Million), by Offering 2024 & 2032
- Figure 13: North America Flow Computer Oil Gas Industry Revenue Share (%), by Offering 2024 & 2032
- Figure 14: North America Flow Computer Oil Gas Industry Revenue (Million), by Country 2024 & 2032
- Figure 15: North America Flow Computer Oil Gas Industry Revenue Share (%), by Country 2024 & 2032
- Figure 16: Europe Flow Computer Oil Gas Industry Revenue (Million), by Offering 2024 & 2032
- Figure 17: Europe Flow Computer Oil Gas Industry Revenue Share (%), by Offering 2024 & 2032
- Figure 18: Europe Flow Computer Oil Gas Industry Revenue (Million), by Country 2024 & 2032
- Figure 19: Europe Flow Computer Oil Gas Industry Revenue Share (%), by Country 2024 & 2032
- Figure 20: Asia Pacific Flow Computer Oil Gas Industry Revenue (Million), by Offering 2024 & 2032
- Figure 21: Asia Pacific Flow Computer Oil Gas Industry Revenue Share (%), by Offering 2024 & 2032
- Figure 22: Asia Pacific Flow Computer Oil Gas Industry Revenue (Million), by Country 2024 & 2032
- Figure 23: Asia Pacific Flow Computer Oil Gas Industry Revenue Share (%), by Country 2024 & 2032
- Figure 24: Latin America Flow Computer Oil Gas Industry Revenue (Million), by Offering 2024 & 2032
- Figure 25: Latin America Flow Computer Oil Gas Industry Revenue Share (%), by Offering 2024 & 2032
- Figure 26: Latin America Flow Computer Oil Gas Industry Revenue (Million), by Country 2024 & 2032
- Figure 27: Latin America Flow Computer Oil Gas Industry Revenue Share (%), by Country 2024 & 2032
- Figure 28: Middle East and Africa Flow Computer Oil Gas Industry Revenue (Million), by Offering 2024 & 2032
- Figure 29: Middle East and Africa Flow Computer Oil Gas Industry Revenue Share (%), by Offering 2024 & 2032
- Figure 30: Middle East and Africa Flow Computer Oil Gas Industry Revenue (Million), by Country 2024 & 2032
- Figure 31: Middle East and Africa Flow Computer Oil Gas Industry Revenue Share (%), by Country 2024 & 2032
List of Tables
- Table 1: Global Flow Computer Oil Gas Industry Revenue Million Forecast, by Region 2019 & 2032
- Table 2: Global Flow Computer Oil Gas Industry Revenue Million Forecast, by Offering 2019 & 2032
- Table 3: Global Flow Computer Oil Gas Industry Revenue Million Forecast, by Region 2019 & 2032
- Table 4: Global Flow Computer Oil Gas Industry Revenue Million Forecast, by Country 2019 & 2032
- Table 5: Flow Computer Oil Gas Industry Revenue (Million) Forecast, by Application 2019 & 2032
- Table 6: Global Flow Computer Oil Gas Industry Revenue Million Forecast, by Country 2019 & 2032
- Table 7: Flow Computer Oil Gas Industry Revenue (Million) Forecast, by Application 2019 & 2032
- Table 8: Global Flow Computer Oil Gas Industry Revenue Million Forecast, by Country 2019 & 2032
- Table 9: Flow Computer Oil Gas Industry Revenue (Million) Forecast, by Application 2019 & 2032
- Table 10: Global Flow Computer Oil Gas Industry Revenue Million Forecast, by Country 2019 & 2032
- Table 11: Flow Computer Oil Gas Industry Revenue (Million) Forecast, by Application 2019 & 2032
- Table 12: Global Flow Computer Oil Gas Industry Revenue Million Forecast, by Country 2019 & 2032
- Table 13: Flow Computer Oil Gas Industry Revenue (Million) Forecast, by Application 2019 & 2032
- Table 14: Global Flow Computer Oil Gas Industry Revenue Million Forecast, by Offering 2019 & 2032
- Table 15: Global Flow Computer Oil Gas Industry Revenue Million Forecast, by Country 2019 & 2032
- Table 16: Global Flow Computer Oil Gas Industry Revenue Million Forecast, by Offering 2019 & 2032
- Table 17: Global Flow Computer Oil Gas Industry Revenue Million Forecast, by Country 2019 & 2032
- Table 18: Global Flow Computer Oil Gas Industry Revenue Million Forecast, by Offering 2019 & 2032
- Table 19: Global Flow Computer Oil Gas Industry Revenue Million Forecast, by Country 2019 & 2032
- Table 20: Global Flow Computer Oil Gas Industry Revenue Million Forecast, by Offering 2019 & 2032
- Table 21: Global Flow Computer Oil Gas Industry Revenue Million Forecast, by Country 2019 & 2032
- Table 22: Global Flow Computer Oil Gas Industry Revenue Million Forecast, by Offering 2019 & 2032
- Table 23: Global Flow Computer Oil Gas Industry Revenue Million Forecast, by Country 2019 & 2032
Frequently Asked Questions
1. What is the projected Compound Annual Growth Rate (CAGR) of the Flow Computer Oil Gas Industry?
The projected CAGR is approximately 6.53%.
2. Which companies are prominent players in the Flow Computer Oil Gas Industry?
Key companies in the market include Honeywell International Inc, ABB Ltd, Quorum Business Solutions Inc, Schneider Electric SE, OMNI Flow Computers Inc, Yokogawa Electric Corporation, Bedrock Automation Platforms Inc (Maxim Integrated Products Inc ), Flowmetrics Inc *List Not Exhaustive, Dynamic Flow Computers Inc, Emerson Electric Company.
3. What are the main segments of the Flow Computer Oil Gas Industry?
The market segments include Offering.
4. Can you provide details about the market size?
The market size is estimated to be USD 678.41 Million as of 2022.
5. What are some drivers contributing to market growth?
; Growing Need for Reliable Flow and High-tech Computing Systems; Continually Evolving Data Computational Capacity of Flow Computers.
6. What are the notable trends driving market growth?
Evolving Data Computational Capacity of Flow Computers.
7. Are there any restraints impacting market growth?
; Cyber-Security Threats Deterring Deployment of Advanced Flow Computer Systems; Dynamic Changes in Oil & Gas Prices leading to Reduced Investment in Infrastructure.
8. Can you provide examples of recent developments in the market?
N/A
9. What pricing options are available for accessing the report?
Pricing options include single-user, multi-user, and enterprise licenses priced at USD 4750, USD 5250, and USD 8750 respectively.
10. Is the market size provided in terms of value or volume?
The market size is provided in terms of value, measured in Million.
11. Are there any specific market keywords associated with the report?
Yes, the market keyword associated with the report is "Flow Computer Oil Gas Industry," which aids in identifying and referencing the specific market segment covered.
12. How do I determine which pricing option suits my needs best?
The pricing options vary based on user requirements and access needs. Individual users may opt for single-user licenses, while businesses requiring broader access may choose multi-user or enterprise licenses for cost-effective access to the report.
13. Are there any additional resources or data provided in the Flow Computer Oil Gas Industry report?
While the report offers comprehensive insights, it's advisable to review the specific contents or supplementary materials provided to ascertain if additional resources or data are available.
14. How can I stay updated on further developments or reports in the Flow Computer Oil Gas Industry?
To stay informed about further developments, trends, and reports in the Flow Computer Oil Gas Industry, consider subscribing to industry newsletters, following relevant companies and organizations, or regularly checking reputable industry news sources and publications.
Methodology
Step 1 - Identification of Relevant Samples Size from Population Database


Step 2 - Approaches for Defining Global Market Size (Value, Volume* & Price*)

Note*: In applicable scenarios
Step 3 - Data Sources
Primary Research
- Web Analytics
- Survey Reports
- Research Institute
- Latest Research Reports
- Opinion Leaders
Secondary Research
- Annual Reports
- White Paper
- Latest Press Release
- Industry Association
- Paid Database
- Investor Presentations

Step 4 - Data Triangulation
Involves using different sources of information in order to increase the validity of a study
These sources are likely to be stakeholders in a program - participants, other researchers, program staff, other community members, and so on.
Then we put all data in single framework & apply various statistical tools to find out the dynamic on the market.
During the analysis stage, feedback from the stakeholder groups would be compared to determine areas of agreement as well as areas of divergence
