

Key Insights
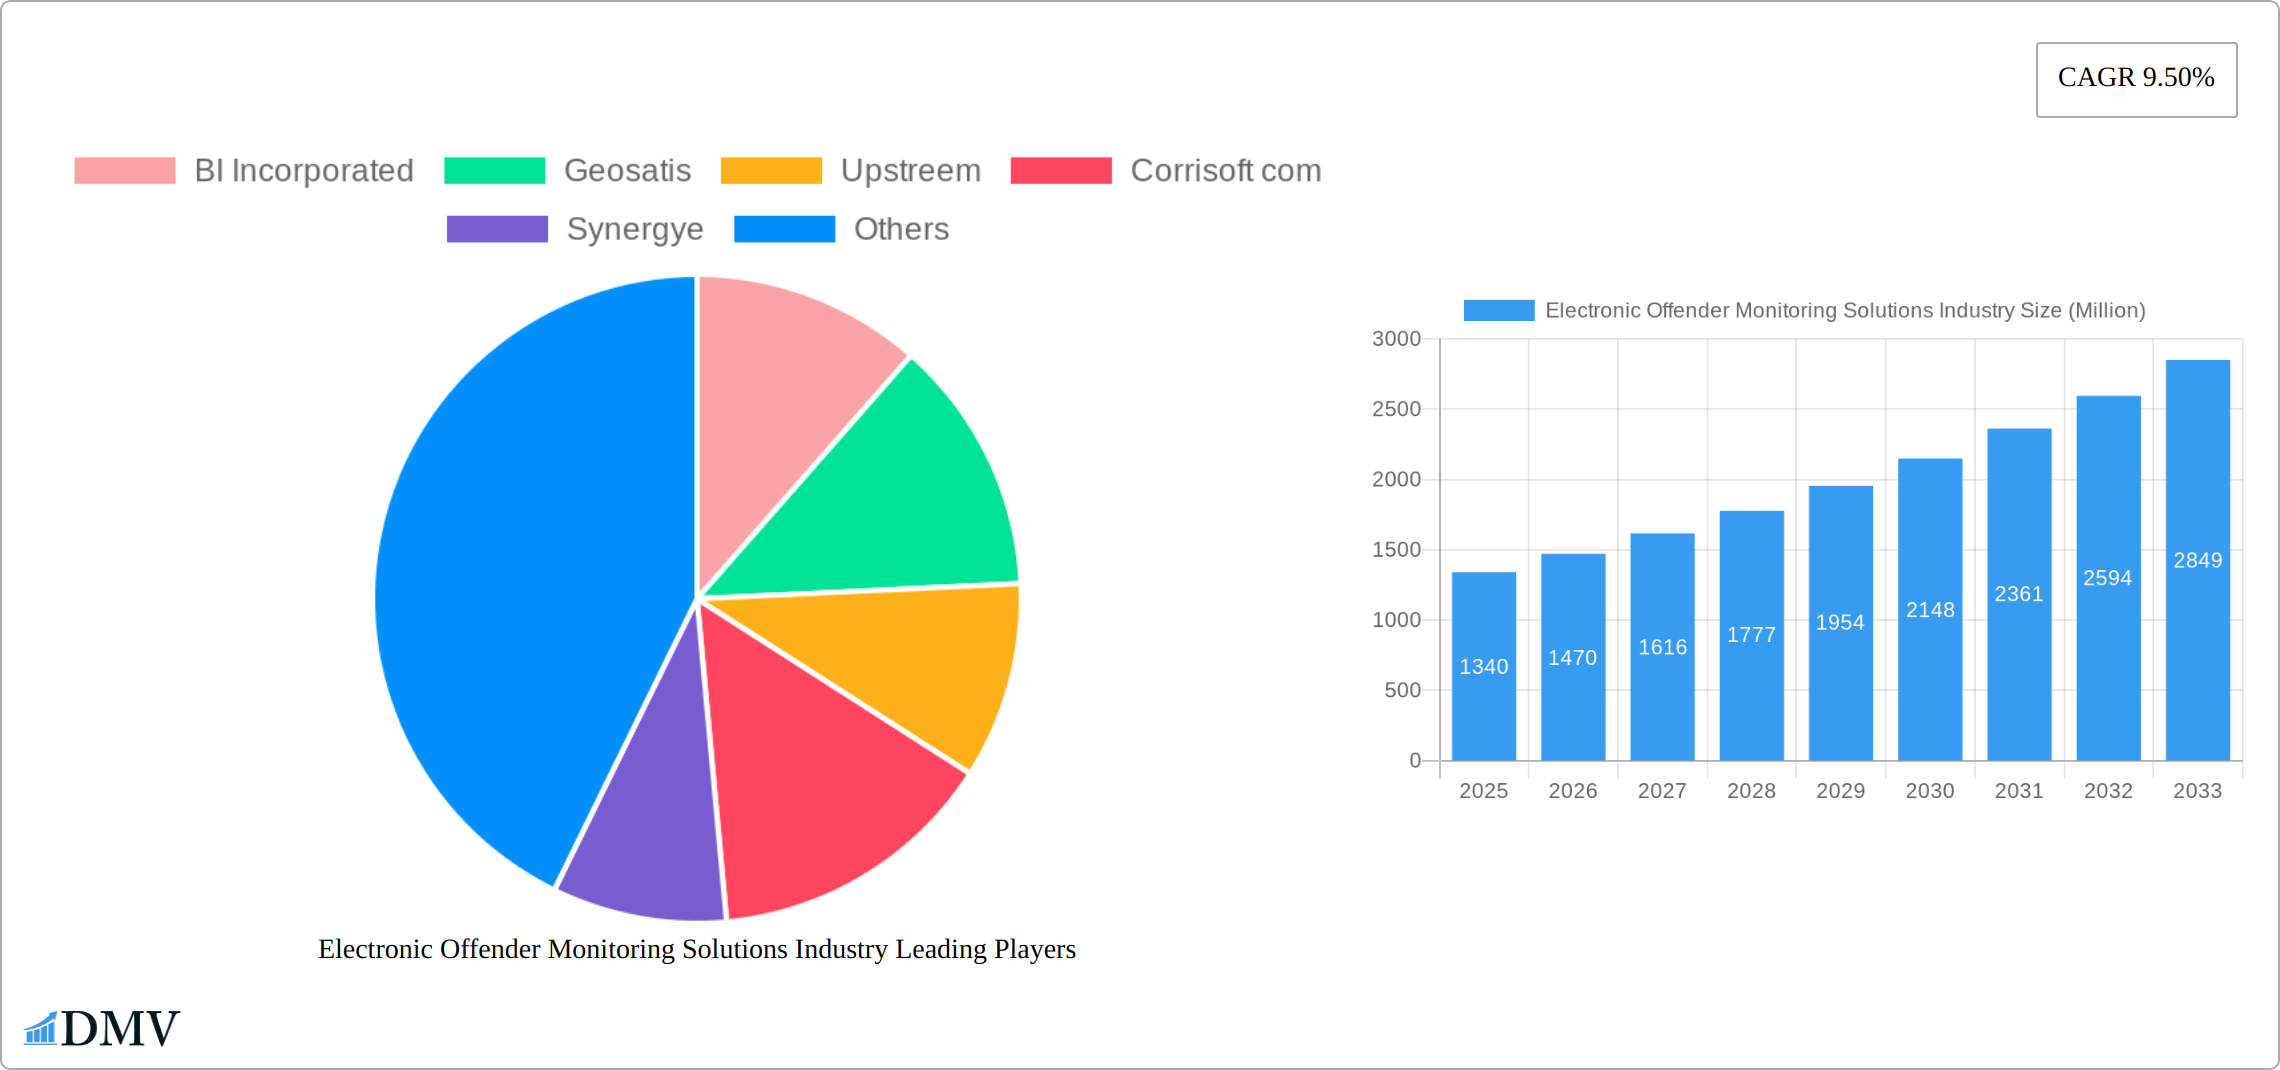
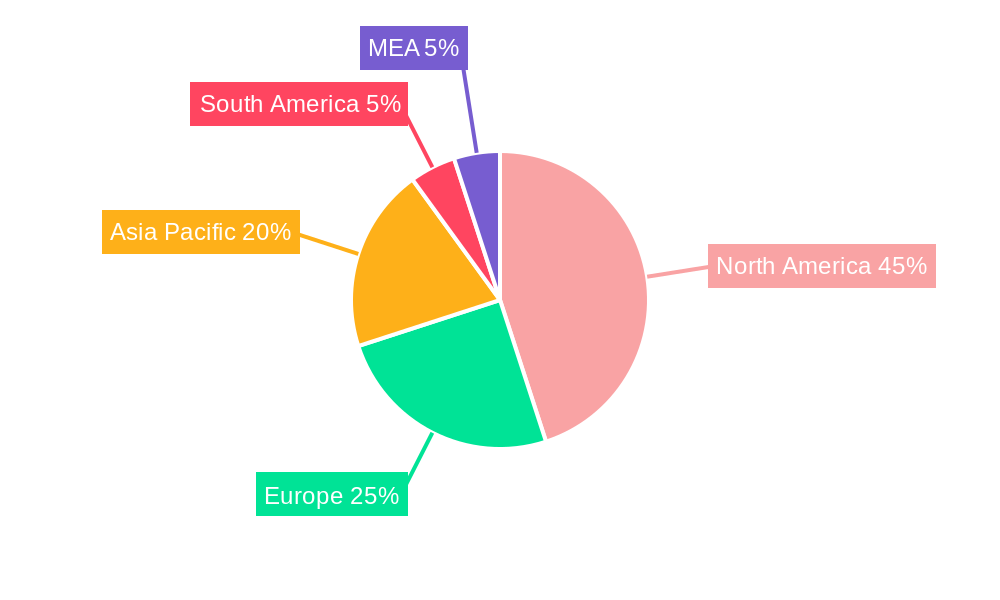
The Electronic Offender Monitoring (EOM) solutions market is experiencing robust growth, projected to reach a market size of $1.34 billion in 2025 and maintain a Compound Annual Growth Rate (CAGR) of 9.5% from 2025 to 2033. This expansion is driven by several key factors. Increasing crime rates and the need for efficient and cost-effective alternatives to traditional incarceration are fueling demand. Furthermore, technological advancements in GPS tracking, radio frequency identification (RFID), and other monitoring technologies are enhancing accuracy, reliability, and overall effectiveness of EOM systems. Governments are increasingly adopting these solutions to improve community safety, reduce recidivism, and optimize resource allocation within correctional systems. The rise in remote monitoring capabilities, driven by advancements in mobile technology and data analytics, is also significantly contributing to market growth. This allows for greater flexibility and cost efficiency compared to traditional in-person supervision. The market is segmented by technology (RF, GPS) and offering (solutions, services), with both segments witnessing significant growth fueled by technological innovation and increasing government investment. The North American region, particularly the United States, currently holds a dominant market share, driven by strong government support and advanced technological infrastructure. However, other regions such as Asia Pacific and Europe are also expected to show significant growth over the forecast period, driven by rising adoption rates and increasing awareness of the benefits of EOM solutions. The competitive landscape is relatively fragmented, with several established players and emerging technology companies vying for market share.
The continued growth of the EOM solutions market hinges on several factors. Government regulations and policies regarding offender monitoring will directly influence market adoption. Technological advancements, particularly in areas such as AI-powered analytics for risk assessment and improved data security, will be pivotal. The ongoing challenge will be balancing cost-effectiveness with the accuracy and reliability of monitoring systems. Further development of user-friendly interfaces and integration with existing correctional infrastructure will facilitate broader market penetration. Growing concerns about privacy and data security related to the collection and use of personal data from offenders will need to be addressed to build trust and confidence in these systems. The development of sophisticated algorithms that can accurately predict recidivism and inform intervention strategies will enhance the overall effectiveness and social impact of EOM solutions, further fueling market growth in the coming years.
Electronic Offender Monitoring Solutions Industry Market Composition & Trends
The Electronic Offender Monitoring Solutions industry is a dynamic landscape shaped by established players and emerging innovators. Market concentration is significant, with key companies like BI Incorporated, G4S Limited, and Securus Technologies LLC holding substantial shares. While precise figures fluctuate, BI Incorporated historically commands a significant portion (around 30%), followed by G4S Limited and Securus Technologies LLC, each with approximately 20% market share. This leaves a considerable 30% for other competitors, highlighting a competitive yet consolidated market structure. Innovation is fueled by advancements in Global Positioning System (GPS) and Radio Frequency (RF) technologies, enabling increasingly precise and real-time tracking, driving wider adoption.
Regulatory frameworks significantly influence market dynamics, exhibiting considerable variation across different regions. North America, particularly the United States, often features stringent regulations emphasizing ethical device usage and data privacy, while European markets prioritize data protection under GDPR and similar legislation. While traditional incarceration remains a competing approach, the cost-effectiveness and more humane aspects of electronic monitoring are increasingly persuading end-users to adopt these solutions, particularly in jurisdictions seeking to manage correctional budgets effectively.
Mergers and acquisitions (M&A) activity plays a crucial role in industry growth, with recent deals exceeding $100 million aiming to broaden service offerings and expand geographic reach. Acquisitions of smaller technology firms by larger corporations such as Supercom and AMOS Spacecom exemplify this trend, integrating advanced monitoring technologies into existing platforms and strengthening their market positions.
Approximate Market Share Distribution (Historical Data):
BI Incorporated: ~30%
G4S Limited: ~20%
Securus Technologies LLC: ~20%
Others: ~30%
Recent M&A Deal Values:
Over $100 Million
Electronic Offender Monitoring Solutions Industry Industry Evolution
The Electronic Offender Monitoring Solutions Industry has undergone significant evolution over the study period of 2019-2033, with a marked increase in market growth trajectories driven by technological advancements and shifting consumer demands. From 2019 to 2024, the historical period, the industry experienced a compounded annual growth rate (CAGR) of approximately 7%, fueled by the increasing adoption of GPS and RF technologies for offender monitoring. This growth trend is expected to continue during the forecast period of 2025-2033, with a projected CAGR of 8%, as more jurisdictions recognize the benefits of electronic monitoring over traditional incarceration.
Technological advancements have been pivotal in this evolution. The integration of IoT and AI technologies has led to the development of more sophisticated monitoring solutions that offer real-time data analysis and predictive analytics, enhancing the effectiveness of offender management. For instance, the adoption rate of GPS-based monitoring systems increased by 15% from 2020 to 2024, reflecting a growing trust in these technologies.
Consumer demands have also shifted, with a greater emphasis on rehabilitation and reintegration into society rather than punitive measures. This shift has led to increased demand for monitoring solutions that not only track offenders but also provide support and resources for their rehabilitation. As a result, the market has seen a rise in the development of comprehensive solutions that combine monitoring with rehabilitation programs.
Leading Regions, Countries, or Segments in Electronic Offender Monitoring Solutions Industry
North America, especially the United States, dominates the Electronic Offender Monitoring Solutions industry, exhibiting the highest adoption rates. This leadership stems from substantial investments and supportive regulatory environments.
- Key Drivers of North American Dominance:
- Significant Investment: Over $500 million invested in electronic monitoring solutions in the U.S. since 2019 (approximate figure).
- Supportive Regulatory Framework: Clear regulations facilitating technology deployment and operational procedures.
Within North America, GPS technology holds a commanding market share (approximately 60%), favored for its accuracy and real-time tracking capabilities, crucial for effective offender management. The "Solutions" segment, encompassing both hardware and software, leads the market with approximately 55% share, driven by continuous innovation in monitoring devices and user-friendly software enhancing program efficiency.
- Factors Contributing to Market Leadership:
- North American Dominance: High investment and regulatory support.
- GPS Technology Prevalence: Accuracy and real-time tracking capabilities.
- Solutions Segment Leadership: Integrated hardware and software solutions driving efficiency gains.
Electronic Offender Monitoring Solutions Industry Product Innovations
Recent product innovations in the Electronic Offender Monitoring Solutions Industry include the development of wearable devices equipped with GPS and RF technologies, offering enhanced accuracy and reliability. Companies like Buddi AI and TRACK GROUP have introduced devices that not only track offenders but also monitor vital signs and behavior patterns, providing valuable data for rehabilitation programs. These innovations have led to a 20% increase in the adoption of advanced monitoring solutions over the past year, highlighting their unique selling propositions and technological advancements.
Propelling Factors for Electronic Offender Monitoring Solutions Industry Growth
The growth of the Electronic Offender Monitoring Solutions Industry is propelled by several key factors. Technological advancements, such as the integration of AI and IoT, enhance the capabilities of monitoring devices, making them more efficient and reliable. Economically, the cost-effectiveness of electronic monitoring compared to traditional incarceration is a significant driver, with potential savings of up to 50% for correctional systems. Regulatory influences also play a crucial role, with governments increasingly recognizing the benefits of electronic monitoring for offender rehabilitation and public safety.
Obstacles in the Electronic Offender Monitoring Solutions Industry Market
Growth in the Electronic Offender Monitoring Solutions industry faces several obstacles. Regulatory hurdles concerning data privacy and ethical considerations can impede technology adoption. Supply chain disruptions, often stemming from global events, cause delivery delays and increased costs. Competition from alternative solutions, such as traditional incarceration, remains a challenge, with some jurisdictions still favoring established, albeit often more expensive and less humane, methods. Addressing these obstacles requires proactive strategies to navigate regulatory frameworks, mitigate supply chain risks, and effectively demonstrate the cost-effectiveness and social benefits of electronic monitoring compared to traditional approaches.
Future Opportunities in Electronic Offender Monitoring Solutions Industry
Significant opportunities exist, including expansion into new markets like the Asia-Pacific region, where interest in alternative correctional approaches is growing. Technological advancements, such as integrating biometric monitoring and predictive analytics, offer exciting avenues for product development. The growing emphasis on rehabilitation presents opportunities to create comprehensive programs that integrate monitoring with supportive services, creating a more holistic approach to offender management.
Major Players in the Electronic Offender Monitoring Solutions Industry Ecosystem
- BI Incorporated
- Geosatis
- Upstreem
- Corrisoft com
- Synergye
- Supercom
- AMOS Spacecom
- Buddi AI
- G4S Limited
- Attenti
- Securus Technologies LLC
- Alcohol Monitoring Systems Inc (SCRAM Systems)
- TRACK GROUP
Key Developments in Electronic Offender Monitoring Solutions Industry Industry
- October 2022: B.I. Incorporated entered an exclusive agreement with OMNIA Partners Public Sector, allowing national city, county, and state government agencies to contract with B.I. for community corrections supervision technologies at competitive costs. This development streamlines the procurement process for participating agencies, saving time and effort.
- January 2022: The Denver City Council approved a USD 1.5 Million contract with B.I. Incorporated for electronic monitoring equipment through January 31, 2025. This contract underscores the growing reliance on electronic monitoring solutions in correctional systems, impacting market dynamics by increasing demand for such technologies.
Strategic Electronic Offender Monitoring Solutions Industry Market Forecast
The future of the Electronic Offender Monitoring Solutions industry appears promising. Technological advancements, cost-effectiveness, and evolving regulatory landscapes are key growth drivers. The integration of AI and IoT technologies is expected to enhance monitoring capabilities significantly. The potential for substantial cost savings within correctional systems will continue to fuel market growth. As more regions recognize the benefits of electronic monitoring for both rehabilitation and public safety, the industry's expansion into new markets is highly likely, presenting considerable opportunities for all stakeholders.
Electronic Offender Monitoring Solutions Industry Segmentation
-
1. Technology
- 1.1. Radio Frequency (RF)
- 1.2. Global Positioning System (GPS)
-
2. Offering
- 2.1. Solutions
- 2.2. Services
Electronic Offender Monitoring Solutions Industry Segmentation By Geography
- 1. North America
- 2. Europe
- 3. Asia
- 4. Australia and New Zealand
- 5. Latin America
- 6. Middle East and Africa
Electronic Offender Monitoring Solutions Industry REPORT HIGHLIGHTS
| Aspects | Details |
|---|---|
| Study Period | 2019-2033 |
| Base Year | 2024 |
| Estimated Year | 2025 |
| Forecast Period | 2025-2033 |
| Historical Period | 2019-2024 |
| Growth Rate | CAGR of 9.50% from 2019-2033 |
| Segmentation |
|
Table of Contents
- 1. Introduction
- 1.1. Research Scope
- 1.2. Market Segmentation
- 1.3. Research Methodology
- 1.4. Definitions and Assumptions
- 2. Executive Summary
- 2.1. Introduction
- 3. Market Dynamics
- 3.1. Introduction
- 3.2. Market Drivers
- 3.2.1. The Prison Overcrowding Worsened by the COVID-19 Pandemic; Growing Adoption of Victim Protection Solutions
- 3.3. Market Restrains
- 3.3.1. Electronic Offender Monitoring Devices Can Be Tampered by Offenders
- 3.4. Market Trends
- 3.4.1. Global Positioning System Driving the Market Growth
- 4. Market Factor Analysis
- 4.1. Porters Five Forces
- 4.2. Supply/Value Chain
- 4.3. PESTEL analysis
- 4.4. Market Entropy
- 4.5. Patent/Trademark Analysis
- 5. Global Electronic Offender Monitoring Solutions Industry Analysis, Insights and Forecast, 2019-2031
- 5.1. Market Analysis, Insights and Forecast - by Technology
- 5.1.1. Radio Frequency (RF)
- 5.1.2. Global Positioning System (GPS)
- 5.2. Market Analysis, Insights and Forecast - by Offering
- 5.2.1. Solutions
- 5.2.2. Services
- 5.3. Market Analysis, Insights and Forecast - by Region
- 5.3.1. North America
- 5.3.2. Europe
- 5.3.3. Asia
- 5.3.4. Australia and New Zealand
- 5.3.5. Latin America
- 5.3.6. Middle East and Africa
- 5.1. Market Analysis, Insights and Forecast - by Technology
- 6. North America Electronic Offender Monitoring Solutions Industry Analysis, Insights and Forecast, 2019-2031
- 6.1. Market Analysis, Insights and Forecast - by Technology
- 6.1.1. Radio Frequency (RF)
- 6.1.2. Global Positioning System (GPS)
- 6.2. Market Analysis, Insights and Forecast - by Offering
- 6.2.1. Solutions
- 6.2.2. Services
- 6.1. Market Analysis, Insights and Forecast - by Technology
- 7. Europe Electronic Offender Monitoring Solutions Industry Analysis, Insights and Forecast, 2019-2031
- 7.1. Market Analysis, Insights and Forecast - by Technology
- 7.1.1. Radio Frequency (RF)
- 7.1.2. Global Positioning System (GPS)
- 7.2. Market Analysis, Insights and Forecast - by Offering
- 7.2.1. Solutions
- 7.2.2. Services
- 7.1. Market Analysis, Insights and Forecast - by Technology
- 8. Asia Electronic Offender Monitoring Solutions Industry Analysis, Insights and Forecast, 2019-2031
- 8.1. Market Analysis, Insights and Forecast - by Technology
- 8.1.1. Radio Frequency (RF)
- 8.1.2. Global Positioning System (GPS)
- 8.2. Market Analysis, Insights and Forecast - by Offering
- 8.2.1. Solutions
- 8.2.2. Services
- 8.1. Market Analysis, Insights and Forecast - by Technology
- 9. Australia and New Zealand Electronic Offender Monitoring Solutions Industry Analysis, Insights and Forecast, 2019-2031
- 9.1. Market Analysis, Insights and Forecast - by Technology
- 9.1.1. Radio Frequency (RF)
- 9.1.2. Global Positioning System (GPS)
- 9.2. Market Analysis, Insights and Forecast - by Offering
- 9.2.1. Solutions
- 9.2.2. Services
- 9.1. Market Analysis, Insights and Forecast - by Technology
- 10. Latin America Electronic Offender Monitoring Solutions Industry Analysis, Insights and Forecast, 2019-2031
- 10.1. Market Analysis, Insights and Forecast - by Technology
- 10.1.1. Radio Frequency (RF)
- 10.1.2. Global Positioning System (GPS)
- 10.2. Market Analysis, Insights and Forecast - by Offering
- 10.2.1. Solutions
- 10.2.2. Services
- 10.1. Market Analysis, Insights and Forecast - by Technology
- 11. Middle East and Africa Electronic Offender Monitoring Solutions Industry Analysis, Insights and Forecast, 2019-2031
- 11.1. Market Analysis, Insights and Forecast - by Technology
- 11.1.1. Radio Frequency (RF)
- 11.1.2. Global Positioning System (GPS)
- 11.2. Market Analysis, Insights and Forecast - by Offering
- 11.2.1. Solutions
- 11.2.2. Services
- 11.1. Market Analysis, Insights and Forecast - by Technology
- 12. North America Electronic Offender Monitoring Solutions Industry Analysis, Insights and Forecast, 2019-2031
- 12.1. Market Analysis, Insights and Forecast - By Country/Sub-region
- 12.1.1 United States
- 12.1.2 Canada
- 12.1.3 Mexico
- 13. Europe Electronic Offender Monitoring Solutions Industry Analysis, Insights and Forecast, 2019-2031
- 13.1. Market Analysis, Insights and Forecast - By Country/Sub-region
- 13.1.1 Germany
- 13.1.2 United Kingdom
- 13.1.3 France
- 13.1.4 Spain
- 13.1.5 Italy
- 13.1.6 Spain
- 13.1.7 Belgium
- 13.1.8 Netherland
- 13.1.9 Nordics
- 13.1.10 Rest of Europe
- 14. Asia Pacific Electronic Offender Monitoring Solutions Industry Analysis, Insights and Forecast, 2019-2031
- 14.1. Market Analysis, Insights and Forecast - By Country/Sub-region
- 14.1.1 China
- 14.1.2 Japan
- 14.1.3 India
- 14.1.4 South Korea
- 14.1.5 Southeast Asia
- 14.1.6 Australia
- 14.1.7 Indonesia
- 14.1.8 Phillipes
- 14.1.9 Singapore
- 14.1.10 Thailandc
- 14.1.11 Rest of Asia Pacific
- 15. South America Electronic Offender Monitoring Solutions Industry Analysis, Insights and Forecast, 2019-2031
- 15.1. Market Analysis, Insights and Forecast - By Country/Sub-region
- 15.1.1 Brazil
- 15.1.2 Argentina
- 15.1.3 Peru
- 15.1.4 Chile
- 15.1.5 Colombia
- 15.1.6 Ecuador
- 15.1.7 Venezuela
- 15.1.8 Rest of South America
- 16. North America Electronic Offender Monitoring Solutions Industry Analysis, Insights and Forecast, 2019-2031
- 16.1. Market Analysis, Insights and Forecast - By Country/Sub-region
- 16.1.1 United States
- 16.1.2 Canada
- 16.1.3 Mexico
- 17. MEA Electronic Offender Monitoring Solutions Industry Analysis, Insights and Forecast, 2019-2031
- 17.1. Market Analysis, Insights and Forecast - By Country/Sub-region
- 17.1.1 United Arab Emirates
- 17.1.2 Saudi Arabia
- 17.1.3 South Africa
- 17.1.4 Rest of Middle East and Africa
- 18. Competitive Analysis
- 18.1. Global Market Share Analysis 2024
- 18.2. Company Profiles
- 18.2.1 BI Incorporated
- 18.2.1.1. Overview
- 18.2.1.2. Products
- 18.2.1.3. SWOT Analysis
- 18.2.1.4. Recent Developments
- 18.2.1.5. Financials (Based on Availability)
- 18.2.2 Geosatis
- 18.2.2.1. Overview
- 18.2.2.2. Products
- 18.2.2.3. SWOT Analysis
- 18.2.2.4. Recent Developments
- 18.2.2.5. Financials (Based on Availability)
- 18.2.3 Upstreem
- 18.2.3.1. Overview
- 18.2.3.2. Products
- 18.2.3.3. SWOT Analysis
- 18.2.3.4. Recent Developments
- 18.2.3.5. Financials (Based on Availability)
- 18.2.4 Corrisoft com
- 18.2.4.1. Overview
- 18.2.4.2. Products
- 18.2.4.3. SWOT Analysis
- 18.2.4.4. Recent Developments
- 18.2.4.5. Financials (Based on Availability)
- 18.2.5 Synergye
- 18.2.5.1. Overview
- 18.2.5.2. Products
- 18.2.5.3. SWOT Analysis
- 18.2.5.4. Recent Developments
- 18.2.5.5. Financials (Based on Availability)
- 18.2.6 Supercom
- 18.2.6.1. Overview
- 18.2.6.2. Products
- 18.2.6.3. SWOT Analysis
- 18.2.6.4. Recent Developments
- 18.2.6.5. Financials (Based on Availability)
- 18.2.7 AMOS Spacecom
- 18.2.7.1. Overview
- 18.2.7.2. Products
- 18.2.7.3. SWOT Analysis
- 18.2.7.4. Recent Developments
- 18.2.7.5. Financials (Based on Availability)
- 18.2.8 Buddi AI
- 18.2.8.1. Overview
- 18.2.8.2. Products
- 18.2.8.3. SWOT Analysis
- 18.2.8.4. Recent Developments
- 18.2.8.5. Financials (Based on Availability)
- 18.2.9 G4S Limited
- 18.2.9.1. Overview
- 18.2.9.2. Products
- 18.2.9.3. SWOT Analysis
- 18.2.9.4. Recent Developments
- 18.2.9.5. Financials (Based on Availability)
- 18.2.10 Attenti
- 18.2.10.1. Overview
- 18.2.10.2. Products
- 18.2.10.3. SWOT Analysis
- 18.2.10.4. Recent Developments
- 18.2.10.5. Financials (Based on Availability)
- 18.2.11 Securus Technologies LLC
- 18.2.11.1. Overview
- 18.2.11.2. Products
- 18.2.11.3. SWOT Analysis
- 18.2.11.4. Recent Developments
- 18.2.11.5. Financials (Based on Availability)
- 18.2.12 Alcohol Monitoring Systems Inc (SCRAM Systems)
- 18.2.12.1. Overview
- 18.2.12.2. Products
- 18.2.12.3. SWOT Analysis
- 18.2.12.4. Recent Developments
- 18.2.12.5. Financials (Based on Availability)
- 18.2.13 TRACK GROUP
- 18.2.13.1. Overview
- 18.2.13.2. Products
- 18.2.13.3. SWOT Analysis
- 18.2.13.4. Recent Developments
- 18.2.13.5. Financials (Based on Availability)
- 18.2.1 BI Incorporated
List of Figures
- Figure 1: Global Electronic Offender Monitoring Solutions Industry Revenue Breakdown (Million, %) by Region 2024 & 2032
- Figure 2: Global Electronic Offender Monitoring Solutions Industry Volume Breakdown (K Unit, %) by Region 2024 & 2032
- Figure 3: North America Electronic Offender Monitoring Solutions Industry Revenue (Million), by Country 2024 & 2032
- Figure 4: North America Electronic Offender Monitoring Solutions Industry Volume (K Unit), by Country 2024 & 2032
- Figure 5: North America Electronic Offender Monitoring Solutions Industry Revenue Share (%), by Country 2024 & 2032
- Figure 6: North America Electronic Offender Monitoring Solutions Industry Volume Share (%), by Country 2024 & 2032
- Figure 7: Europe Electronic Offender Monitoring Solutions Industry Revenue (Million), by Country 2024 & 2032
- Figure 8: Europe Electronic Offender Monitoring Solutions Industry Volume (K Unit), by Country 2024 & 2032
- Figure 9: Europe Electronic Offender Monitoring Solutions Industry Revenue Share (%), by Country 2024 & 2032
- Figure 10: Europe Electronic Offender Monitoring Solutions Industry Volume Share (%), by Country 2024 & 2032
- Figure 11: Asia Pacific Electronic Offender Monitoring Solutions Industry Revenue (Million), by Country 2024 & 2032
- Figure 12: Asia Pacific Electronic Offender Monitoring Solutions Industry Volume (K Unit), by Country 2024 & 2032
- Figure 13: Asia Pacific Electronic Offender Monitoring Solutions Industry Revenue Share (%), by Country 2024 & 2032
- Figure 14: Asia Pacific Electronic Offender Monitoring Solutions Industry Volume Share (%), by Country 2024 & 2032
- Figure 15: South America Electronic Offender Monitoring Solutions Industry Revenue (Million), by Country 2024 & 2032
- Figure 16: South America Electronic Offender Monitoring Solutions Industry Volume (K Unit), by Country 2024 & 2032
- Figure 17: South America Electronic Offender Monitoring Solutions Industry Revenue Share (%), by Country 2024 & 2032
- Figure 18: South America Electronic Offender Monitoring Solutions Industry Volume Share (%), by Country 2024 & 2032
- Figure 19: North America Electronic Offender Monitoring Solutions Industry Revenue (Million), by Country 2024 & 2032
- Figure 20: North America Electronic Offender Monitoring Solutions Industry Volume (K Unit), by Country 2024 & 2032
- Figure 21: North America Electronic Offender Monitoring Solutions Industry Revenue Share (%), by Country 2024 & 2032
- Figure 22: North America Electronic Offender Monitoring Solutions Industry Volume Share (%), by Country 2024 & 2032
- Figure 23: MEA Electronic Offender Monitoring Solutions Industry Revenue (Million), by Country 2024 & 2032
- Figure 24: MEA Electronic Offender Monitoring Solutions Industry Volume (K Unit), by Country 2024 & 2032
- Figure 25: MEA Electronic Offender Monitoring Solutions Industry Revenue Share (%), by Country 2024 & 2032
- Figure 26: MEA Electronic Offender Monitoring Solutions Industry Volume Share (%), by Country 2024 & 2032
- Figure 27: North America Electronic Offender Monitoring Solutions Industry Revenue (Million), by Technology 2024 & 2032
- Figure 28: North America Electronic Offender Monitoring Solutions Industry Volume (K Unit), by Technology 2024 & 2032
- Figure 29: North America Electronic Offender Monitoring Solutions Industry Revenue Share (%), by Technology 2024 & 2032
- Figure 30: North America Electronic Offender Monitoring Solutions Industry Volume Share (%), by Technology 2024 & 2032
- Figure 31: North America Electronic Offender Monitoring Solutions Industry Revenue (Million), by Offering 2024 & 2032
- Figure 32: North America Electronic Offender Monitoring Solutions Industry Volume (K Unit), by Offering 2024 & 2032
- Figure 33: North America Electronic Offender Monitoring Solutions Industry Revenue Share (%), by Offering 2024 & 2032
- Figure 34: North America Electronic Offender Monitoring Solutions Industry Volume Share (%), by Offering 2024 & 2032
- Figure 35: North America Electronic Offender Monitoring Solutions Industry Revenue (Million), by Country 2024 & 2032
- Figure 36: North America Electronic Offender Monitoring Solutions Industry Volume (K Unit), by Country 2024 & 2032
- Figure 37: North America Electronic Offender Monitoring Solutions Industry Revenue Share (%), by Country 2024 & 2032
- Figure 38: North America Electronic Offender Monitoring Solutions Industry Volume Share (%), by Country 2024 & 2032
- Figure 39: Europe Electronic Offender Monitoring Solutions Industry Revenue (Million), by Technology 2024 & 2032
- Figure 40: Europe Electronic Offender Monitoring Solutions Industry Volume (K Unit), by Technology 2024 & 2032
- Figure 41: Europe Electronic Offender Monitoring Solutions Industry Revenue Share (%), by Technology 2024 & 2032
- Figure 42: Europe Electronic Offender Monitoring Solutions Industry Volume Share (%), by Technology 2024 & 2032
- Figure 43: Europe Electronic Offender Monitoring Solutions Industry Revenue (Million), by Offering 2024 & 2032
- Figure 44: Europe Electronic Offender Monitoring Solutions Industry Volume (K Unit), by Offering 2024 & 2032
- Figure 45: Europe Electronic Offender Monitoring Solutions Industry Revenue Share (%), by Offering 2024 & 2032
- Figure 46: Europe Electronic Offender Monitoring Solutions Industry Volume Share (%), by Offering 2024 & 2032
- Figure 47: Europe Electronic Offender Monitoring Solutions Industry Revenue (Million), by Country 2024 & 2032
- Figure 48: Europe Electronic Offender Monitoring Solutions Industry Volume (K Unit), by Country 2024 & 2032
- Figure 49: Europe Electronic Offender Monitoring Solutions Industry Revenue Share (%), by Country 2024 & 2032
- Figure 50: Europe Electronic Offender Monitoring Solutions Industry Volume Share (%), by Country 2024 & 2032
- Figure 51: Asia Electronic Offender Monitoring Solutions Industry Revenue (Million), by Technology 2024 & 2032
- Figure 52: Asia Electronic Offender Monitoring Solutions Industry Volume (K Unit), by Technology 2024 & 2032
- Figure 53: Asia Electronic Offender Monitoring Solutions Industry Revenue Share (%), by Technology 2024 & 2032
- Figure 54: Asia Electronic Offender Monitoring Solutions Industry Volume Share (%), by Technology 2024 & 2032
- Figure 55: Asia Electronic Offender Monitoring Solutions Industry Revenue (Million), by Offering 2024 & 2032
- Figure 56: Asia Electronic Offender Monitoring Solutions Industry Volume (K Unit), by Offering 2024 & 2032
- Figure 57: Asia Electronic Offender Monitoring Solutions Industry Revenue Share (%), by Offering 2024 & 2032
- Figure 58: Asia Electronic Offender Monitoring Solutions Industry Volume Share (%), by Offering 2024 & 2032
- Figure 59: Asia Electronic Offender Monitoring Solutions Industry Revenue (Million), by Country 2024 & 2032
- Figure 60: Asia Electronic Offender Monitoring Solutions Industry Volume (K Unit), by Country 2024 & 2032
- Figure 61: Asia Electronic Offender Monitoring Solutions Industry Revenue Share (%), by Country 2024 & 2032
- Figure 62: Asia Electronic Offender Monitoring Solutions Industry Volume Share (%), by Country 2024 & 2032
- Figure 63: Australia and New Zealand Electronic Offender Monitoring Solutions Industry Revenue (Million), by Technology 2024 & 2032
- Figure 64: Australia and New Zealand Electronic Offender Monitoring Solutions Industry Volume (K Unit), by Technology 2024 & 2032
- Figure 65: Australia and New Zealand Electronic Offender Monitoring Solutions Industry Revenue Share (%), by Technology 2024 & 2032
- Figure 66: Australia and New Zealand Electronic Offender Monitoring Solutions Industry Volume Share (%), by Technology 2024 & 2032
- Figure 67: Australia and New Zealand Electronic Offender Monitoring Solutions Industry Revenue (Million), by Offering 2024 & 2032
- Figure 68: Australia and New Zealand Electronic Offender Monitoring Solutions Industry Volume (K Unit), by Offering 2024 & 2032
- Figure 69: Australia and New Zealand Electronic Offender Monitoring Solutions Industry Revenue Share (%), by Offering 2024 & 2032
- Figure 70: Australia and New Zealand Electronic Offender Monitoring Solutions Industry Volume Share (%), by Offering 2024 & 2032
- Figure 71: Australia and New Zealand Electronic Offender Monitoring Solutions Industry Revenue (Million), by Country 2024 & 2032
- Figure 72: Australia and New Zealand Electronic Offender Monitoring Solutions Industry Volume (K Unit), by Country 2024 & 2032
- Figure 73: Australia and New Zealand Electronic Offender Monitoring Solutions Industry Revenue Share (%), by Country 2024 & 2032
- Figure 74: Australia and New Zealand Electronic Offender Monitoring Solutions Industry Volume Share (%), by Country 2024 & 2032
- Figure 75: Latin America Electronic Offender Monitoring Solutions Industry Revenue (Million), by Technology 2024 & 2032
- Figure 76: Latin America Electronic Offender Monitoring Solutions Industry Volume (K Unit), by Technology 2024 & 2032
- Figure 77: Latin America Electronic Offender Monitoring Solutions Industry Revenue Share (%), by Technology 2024 & 2032
- Figure 78: Latin America Electronic Offender Monitoring Solutions Industry Volume Share (%), by Technology 2024 & 2032
- Figure 79: Latin America Electronic Offender Monitoring Solutions Industry Revenue (Million), by Offering 2024 & 2032
- Figure 80: Latin America Electronic Offender Monitoring Solutions Industry Volume (K Unit), by Offering 2024 & 2032
- Figure 81: Latin America Electronic Offender Monitoring Solutions Industry Revenue Share (%), by Offering 2024 & 2032
- Figure 82: Latin America Electronic Offender Monitoring Solutions Industry Volume Share (%), by Offering 2024 & 2032
- Figure 83: Latin America Electronic Offender Monitoring Solutions Industry Revenue (Million), by Country 2024 & 2032
- Figure 84: Latin America Electronic Offender Monitoring Solutions Industry Volume (K Unit), by Country 2024 & 2032
- Figure 85: Latin America Electronic Offender Monitoring Solutions Industry Revenue Share (%), by Country 2024 & 2032
- Figure 86: Latin America Electronic Offender Monitoring Solutions Industry Volume Share (%), by Country 2024 & 2032
- Figure 87: Middle East and Africa Electronic Offender Monitoring Solutions Industry Revenue (Million), by Technology 2024 & 2032
- Figure 88: Middle East and Africa Electronic Offender Monitoring Solutions Industry Volume (K Unit), by Technology 2024 & 2032
- Figure 89: Middle East and Africa Electronic Offender Monitoring Solutions Industry Revenue Share (%), by Technology 2024 & 2032
- Figure 90: Middle East and Africa Electronic Offender Monitoring Solutions Industry Volume Share (%), by Technology 2024 & 2032
- Figure 91: Middle East and Africa Electronic Offender Monitoring Solutions Industry Revenue (Million), by Offering 2024 & 2032
- Figure 92: Middle East and Africa Electronic Offender Monitoring Solutions Industry Volume (K Unit), by Offering 2024 & 2032
- Figure 93: Middle East and Africa Electronic Offender Monitoring Solutions Industry Revenue Share (%), by Offering 2024 & 2032
- Figure 94: Middle East and Africa Electronic Offender Monitoring Solutions Industry Volume Share (%), by Offering 2024 & 2032
- Figure 95: Middle East and Africa Electronic Offender Monitoring Solutions Industry Revenue (Million), by Country 2024 & 2032
- Figure 96: Middle East and Africa Electronic Offender Monitoring Solutions Industry Volume (K Unit), by Country 2024 & 2032
- Figure 97: Middle East and Africa Electronic Offender Monitoring Solutions Industry Revenue Share (%), by Country 2024 & 2032
- Figure 98: Middle East and Africa Electronic Offender Monitoring Solutions Industry Volume Share (%), by Country 2024 & 2032
List of Tables
- Table 1: Global Electronic Offender Monitoring Solutions Industry Revenue Million Forecast, by Region 2019 & 2032
- Table 2: Global Electronic Offender Monitoring Solutions Industry Volume K Unit Forecast, by Region 2019 & 2032
- Table 3: Global Electronic Offender Monitoring Solutions Industry Revenue Million Forecast, by Technology 2019 & 2032
- Table 4: Global Electronic Offender Monitoring Solutions Industry Volume K Unit Forecast, by Technology 2019 & 2032
- Table 5: Global Electronic Offender Monitoring Solutions Industry Revenue Million Forecast, by Offering 2019 & 2032
- Table 6: Global Electronic Offender Monitoring Solutions Industry Volume K Unit Forecast, by Offering 2019 & 2032
- Table 7: Global Electronic Offender Monitoring Solutions Industry Revenue Million Forecast, by Region 2019 & 2032
- Table 8: Global Electronic Offender Monitoring Solutions Industry Volume K Unit Forecast, by Region 2019 & 2032
- Table 9: Global Electronic Offender Monitoring Solutions Industry Revenue Million Forecast, by Country 2019 & 2032
- Table 10: Global Electronic Offender Monitoring Solutions Industry Volume K Unit Forecast, by Country 2019 & 2032
- Table 11: United States Electronic Offender Monitoring Solutions Industry Revenue (Million) Forecast, by Application 2019 & 2032
- Table 12: United States Electronic Offender Monitoring Solutions Industry Volume (K Unit) Forecast, by Application 2019 & 2032
- Table 13: Canada Electronic Offender Monitoring Solutions Industry Revenue (Million) Forecast, by Application 2019 & 2032
- Table 14: Canada Electronic Offender Monitoring Solutions Industry Volume (K Unit) Forecast, by Application 2019 & 2032
- Table 15: Mexico Electronic Offender Monitoring Solutions Industry Revenue (Million) Forecast, by Application 2019 & 2032
- Table 16: Mexico Electronic Offender Monitoring Solutions Industry Volume (K Unit) Forecast, by Application 2019 & 2032
- Table 17: Global Electronic Offender Monitoring Solutions Industry Revenue Million Forecast, by Country 2019 & 2032
- Table 18: Global Electronic Offender Monitoring Solutions Industry Volume K Unit Forecast, by Country 2019 & 2032
- Table 19: Germany Electronic Offender Monitoring Solutions Industry Revenue (Million) Forecast, by Application 2019 & 2032
- Table 20: Germany Electronic Offender Monitoring Solutions Industry Volume (K Unit) Forecast, by Application 2019 & 2032
- Table 21: United Kingdom Electronic Offender Monitoring Solutions Industry Revenue (Million) Forecast, by Application 2019 & 2032
- Table 22: United Kingdom Electronic Offender Monitoring Solutions Industry Volume (K Unit) Forecast, by Application 2019 & 2032
- Table 23: France Electronic Offender Monitoring Solutions Industry Revenue (Million) Forecast, by Application 2019 & 2032
- Table 24: France Electronic Offender Monitoring Solutions Industry Volume (K Unit) Forecast, by Application 2019 & 2032
- Table 25: Spain Electronic Offender Monitoring Solutions Industry Revenue (Million) Forecast, by Application 2019 & 2032
- Table 26: Spain Electronic Offender Monitoring Solutions Industry Volume (K Unit) Forecast, by Application 2019 & 2032
- Table 27: Italy Electronic Offender Monitoring Solutions Industry Revenue (Million) Forecast, by Application 2019 & 2032
- Table 28: Italy Electronic Offender Monitoring Solutions Industry Volume (K Unit) Forecast, by Application 2019 & 2032
- Table 29: Spain Electronic Offender Monitoring Solutions Industry Revenue (Million) Forecast, by Application 2019 & 2032
- Table 30: Spain Electronic Offender Monitoring Solutions Industry Volume (K Unit) Forecast, by Application 2019 & 2032
- Table 31: Belgium Electronic Offender Monitoring Solutions Industry Revenue (Million) Forecast, by Application 2019 & 2032
- Table 32: Belgium Electronic Offender Monitoring Solutions Industry Volume (K Unit) Forecast, by Application 2019 & 2032
- Table 33: Netherland Electronic Offender Monitoring Solutions Industry Revenue (Million) Forecast, by Application 2019 & 2032
- Table 34: Netherland Electronic Offender Monitoring Solutions Industry Volume (K Unit) Forecast, by Application 2019 & 2032
- Table 35: Nordics Electronic Offender Monitoring Solutions Industry Revenue (Million) Forecast, by Application 2019 & 2032
- Table 36: Nordics Electronic Offender Monitoring Solutions Industry Volume (K Unit) Forecast, by Application 2019 & 2032
- Table 37: Rest of Europe Electronic Offender Monitoring Solutions Industry Revenue (Million) Forecast, by Application 2019 & 2032
- Table 38: Rest of Europe Electronic Offender Monitoring Solutions Industry Volume (K Unit) Forecast, by Application 2019 & 2032
- Table 39: Global Electronic Offender Monitoring Solutions Industry Revenue Million Forecast, by Country 2019 & 2032
- Table 40: Global Electronic Offender Monitoring Solutions Industry Volume K Unit Forecast, by Country 2019 & 2032
- Table 41: China Electronic Offender Monitoring Solutions Industry Revenue (Million) Forecast, by Application 2019 & 2032
- Table 42: China Electronic Offender Monitoring Solutions Industry Volume (K Unit) Forecast, by Application 2019 & 2032
- Table 43: Japan Electronic Offender Monitoring Solutions Industry Revenue (Million) Forecast, by Application 2019 & 2032
- Table 44: Japan Electronic Offender Monitoring Solutions Industry Volume (K Unit) Forecast, by Application 2019 & 2032
- Table 45: India Electronic Offender Monitoring Solutions Industry Revenue (Million) Forecast, by Application 2019 & 2032
- Table 46: India Electronic Offender Monitoring Solutions Industry Volume (K Unit) Forecast, by Application 2019 & 2032
- Table 47: South Korea Electronic Offender Monitoring Solutions Industry Revenue (Million) Forecast, by Application 2019 & 2032
- Table 48: South Korea Electronic Offender Monitoring Solutions Industry Volume (K Unit) Forecast, by Application 2019 & 2032
- Table 49: Southeast Asia Electronic Offender Monitoring Solutions Industry Revenue (Million) Forecast, by Application 2019 & 2032
- Table 50: Southeast Asia Electronic Offender Monitoring Solutions Industry Volume (K Unit) Forecast, by Application 2019 & 2032
- Table 51: Australia Electronic Offender Monitoring Solutions Industry Revenue (Million) Forecast, by Application 2019 & 2032
- Table 52: Australia Electronic Offender Monitoring Solutions Industry Volume (K Unit) Forecast, by Application 2019 & 2032
- Table 53: Indonesia Electronic Offender Monitoring Solutions Industry Revenue (Million) Forecast, by Application 2019 & 2032
- Table 54: Indonesia Electronic Offender Monitoring Solutions Industry Volume (K Unit) Forecast, by Application 2019 & 2032
- Table 55: Phillipes Electronic Offender Monitoring Solutions Industry Revenue (Million) Forecast, by Application 2019 & 2032
- Table 56: Phillipes Electronic Offender Monitoring Solutions Industry Volume (K Unit) Forecast, by Application 2019 & 2032
- Table 57: Singapore Electronic Offender Monitoring Solutions Industry Revenue (Million) Forecast, by Application 2019 & 2032
- Table 58: Singapore Electronic Offender Monitoring Solutions Industry Volume (K Unit) Forecast, by Application 2019 & 2032
- Table 59: Thailandc Electronic Offender Monitoring Solutions Industry Revenue (Million) Forecast, by Application 2019 & 2032
- Table 60: Thailandc Electronic Offender Monitoring Solutions Industry Volume (K Unit) Forecast, by Application 2019 & 2032
- Table 61: Rest of Asia Pacific Electronic Offender Monitoring Solutions Industry Revenue (Million) Forecast, by Application 2019 & 2032
- Table 62: Rest of Asia Pacific Electronic Offender Monitoring Solutions Industry Volume (K Unit) Forecast, by Application 2019 & 2032
- Table 63: Global Electronic Offender Monitoring Solutions Industry Revenue Million Forecast, by Country 2019 & 2032
- Table 64: Global Electronic Offender Monitoring Solutions Industry Volume K Unit Forecast, by Country 2019 & 2032
- Table 65: Brazil Electronic Offender Monitoring Solutions Industry Revenue (Million) Forecast, by Application 2019 & 2032
- Table 66: Brazil Electronic Offender Monitoring Solutions Industry Volume (K Unit) Forecast, by Application 2019 & 2032
- Table 67: Argentina Electronic Offender Monitoring Solutions Industry Revenue (Million) Forecast, by Application 2019 & 2032
- Table 68: Argentina Electronic Offender Monitoring Solutions Industry Volume (K Unit) Forecast, by Application 2019 & 2032
- Table 69: Peru Electronic Offender Monitoring Solutions Industry Revenue (Million) Forecast, by Application 2019 & 2032
- Table 70: Peru Electronic Offender Monitoring Solutions Industry Volume (K Unit) Forecast, by Application 2019 & 2032
- Table 71: Chile Electronic Offender Monitoring Solutions Industry Revenue (Million) Forecast, by Application 2019 & 2032
- Table 72: Chile Electronic Offender Monitoring Solutions Industry Volume (K Unit) Forecast, by Application 2019 & 2032
- Table 73: Colombia Electronic Offender Monitoring Solutions Industry Revenue (Million) Forecast, by Application 2019 & 2032
- Table 74: Colombia Electronic Offender Monitoring Solutions Industry Volume (K Unit) Forecast, by Application 2019 & 2032
- Table 75: Ecuador Electronic Offender Monitoring Solutions Industry Revenue (Million) Forecast, by Application 2019 & 2032
- Table 76: Ecuador Electronic Offender Monitoring Solutions Industry Volume (K Unit) Forecast, by Application 2019 & 2032
- Table 77: Venezuela Electronic Offender Monitoring Solutions Industry Revenue (Million) Forecast, by Application 2019 & 2032
- Table 78: Venezuela Electronic Offender Monitoring Solutions Industry Volume (K Unit) Forecast, by Application 2019 & 2032
- Table 79: Rest of South America Electronic Offender Monitoring Solutions Industry Revenue (Million) Forecast, by Application 2019 & 2032
- Table 80: Rest of South America Electronic Offender Monitoring Solutions Industry Volume (K Unit) Forecast, by Application 2019 & 2032
- Table 81: Global Electronic Offender Monitoring Solutions Industry Revenue Million Forecast, by Country 2019 & 2032
- Table 82: Global Electronic Offender Monitoring Solutions Industry Volume K Unit Forecast, by Country 2019 & 2032
- Table 83: United States Electronic Offender Monitoring Solutions Industry Revenue (Million) Forecast, by Application 2019 & 2032
- Table 84: United States Electronic Offender Monitoring Solutions Industry Volume (K Unit) Forecast, by Application 2019 & 2032
- Table 85: Canada Electronic Offender Monitoring Solutions Industry Revenue (Million) Forecast, by Application 2019 & 2032
- Table 86: Canada Electronic Offender Monitoring Solutions Industry Volume (K Unit) Forecast, by Application 2019 & 2032
- Table 87: Mexico Electronic Offender Monitoring Solutions Industry Revenue (Million) Forecast, by Application 2019 & 2032
- Table 88: Mexico Electronic Offender Monitoring Solutions Industry Volume (K Unit) Forecast, by Application 2019 & 2032
- Table 89: Global Electronic Offender Monitoring Solutions Industry Revenue Million Forecast, by Country 2019 & 2032
- Table 90: Global Electronic Offender Monitoring Solutions Industry Volume K Unit Forecast, by Country 2019 & 2032
- Table 91: United Arab Emirates Electronic Offender Monitoring Solutions Industry Revenue (Million) Forecast, by Application 2019 & 2032
- Table 92: United Arab Emirates Electronic Offender Monitoring Solutions Industry Volume (K Unit) Forecast, by Application 2019 & 2032
- Table 93: Saudi Arabia Electronic Offender Monitoring Solutions Industry Revenue (Million) Forecast, by Application 2019 & 2032
- Table 94: Saudi Arabia Electronic Offender Monitoring Solutions Industry Volume (K Unit) Forecast, by Application 2019 & 2032
- Table 95: South Africa Electronic Offender Monitoring Solutions Industry Revenue (Million) Forecast, by Application 2019 & 2032
- Table 96: South Africa Electronic Offender Monitoring Solutions Industry Volume (K Unit) Forecast, by Application 2019 & 2032
- Table 97: Rest of Middle East and Africa Electronic Offender Monitoring Solutions Industry Revenue (Million) Forecast, by Application 2019 & 2032
- Table 98: Rest of Middle East and Africa Electronic Offender Monitoring Solutions Industry Volume (K Unit) Forecast, by Application 2019 & 2032
- Table 99: Global Electronic Offender Monitoring Solutions Industry Revenue Million Forecast, by Technology 2019 & 2032
- Table 100: Global Electronic Offender Monitoring Solutions Industry Volume K Unit Forecast, by Technology 2019 & 2032
- Table 101: Global Electronic Offender Monitoring Solutions Industry Revenue Million Forecast, by Offering 2019 & 2032
- Table 102: Global Electronic Offender Monitoring Solutions Industry Volume K Unit Forecast, by Offering 2019 & 2032
- Table 103: Global Electronic Offender Monitoring Solutions Industry Revenue Million Forecast, by Country 2019 & 2032
- Table 104: Global Electronic Offender Monitoring Solutions Industry Volume K Unit Forecast, by Country 2019 & 2032
- Table 105: Global Electronic Offender Monitoring Solutions Industry Revenue Million Forecast, by Technology 2019 & 2032
- Table 106: Global Electronic Offender Monitoring Solutions Industry Volume K Unit Forecast, by Technology 2019 & 2032
- Table 107: Global Electronic Offender Monitoring Solutions Industry Revenue Million Forecast, by Offering 2019 & 2032
- Table 108: Global Electronic Offender Monitoring Solutions Industry Volume K Unit Forecast, by Offering 2019 & 2032
- Table 109: Global Electronic Offender Monitoring Solutions Industry Revenue Million Forecast, by Country 2019 & 2032
- Table 110: Global Electronic Offender Monitoring Solutions Industry Volume K Unit Forecast, by Country 2019 & 2032
- Table 111: Global Electronic Offender Monitoring Solutions Industry Revenue Million Forecast, by Technology 2019 & 2032
- Table 112: Global Electronic Offender Monitoring Solutions Industry Volume K Unit Forecast, by Technology 2019 & 2032
- Table 113: Global Electronic Offender Monitoring Solutions Industry Revenue Million Forecast, by Offering 2019 & 2032
- Table 114: Global Electronic Offender Monitoring Solutions Industry Volume K Unit Forecast, by Offering 2019 & 2032
- Table 115: Global Electronic Offender Monitoring Solutions Industry Revenue Million Forecast, by Country 2019 & 2032
- Table 116: Global Electronic Offender Monitoring Solutions Industry Volume K Unit Forecast, by Country 2019 & 2032
- Table 117: Global Electronic Offender Monitoring Solutions Industry Revenue Million Forecast, by Technology 2019 & 2032
- Table 118: Global Electronic Offender Monitoring Solutions Industry Volume K Unit Forecast, by Technology 2019 & 2032
- Table 119: Global Electronic Offender Monitoring Solutions Industry Revenue Million Forecast, by Offering 2019 & 2032
- Table 120: Global Electronic Offender Monitoring Solutions Industry Volume K Unit Forecast, by Offering 2019 & 2032
- Table 121: Global Electronic Offender Monitoring Solutions Industry Revenue Million Forecast, by Country 2019 & 2032
- Table 122: Global Electronic Offender Monitoring Solutions Industry Volume K Unit Forecast, by Country 2019 & 2032
- Table 123: Global Electronic Offender Monitoring Solutions Industry Revenue Million Forecast, by Technology 2019 & 2032
- Table 124: Global Electronic Offender Monitoring Solutions Industry Volume K Unit Forecast, by Technology 2019 & 2032
- Table 125: Global Electronic Offender Monitoring Solutions Industry Revenue Million Forecast, by Offering 2019 & 2032
- Table 126: Global Electronic Offender Monitoring Solutions Industry Volume K Unit Forecast, by Offering 2019 & 2032
- Table 127: Global Electronic Offender Monitoring Solutions Industry Revenue Million Forecast, by Country 2019 & 2032
- Table 128: Global Electronic Offender Monitoring Solutions Industry Volume K Unit Forecast, by Country 2019 & 2032
- Table 129: Global Electronic Offender Monitoring Solutions Industry Revenue Million Forecast, by Technology 2019 & 2032
- Table 130: Global Electronic Offender Monitoring Solutions Industry Volume K Unit Forecast, by Technology 2019 & 2032
- Table 131: Global Electronic Offender Monitoring Solutions Industry Revenue Million Forecast, by Offering 2019 & 2032
- Table 132: Global Electronic Offender Monitoring Solutions Industry Volume K Unit Forecast, by Offering 2019 & 2032
- Table 133: Global Electronic Offender Monitoring Solutions Industry Revenue Million Forecast, by Country 2019 & 2032
- Table 134: Global Electronic Offender Monitoring Solutions Industry Volume K Unit Forecast, by Country 2019 & 2032
Frequently Asked Questions
1. What is the projected Compound Annual Growth Rate (CAGR) of the Electronic Offender Monitoring Solutions Industry?
The projected CAGR is approximately 9.50%.
2. Which companies are prominent players in the Electronic Offender Monitoring Solutions Industry?
Key companies in the market include BI Incorporated, Geosatis, Upstreem, Corrisoft com, Synergye, Supercom, AMOS Spacecom, Buddi AI, G4S Limited, Attenti, Securus Technologies LLC, Alcohol Monitoring Systems Inc (SCRAM Systems), TRACK GROUP.
3. What are the main segments of the Electronic Offender Monitoring Solutions Industry?
The market segments include Technology, Offering.
4. Can you provide details about the market size?
The market size is estimated to be USD 1.34 Million as of 2022.
5. What are some drivers contributing to market growth?
The Prison Overcrowding Worsened by the COVID-19 Pandemic; Growing Adoption of Victim Protection Solutions.
6. What are the notable trends driving market growth?
Global Positioning System Driving the Market Growth.
7. Are there any restraints impacting market growth?
Electronic Offender Monitoring Devices Can Be Tampered by Offenders.
8. Can you provide examples of recent developments in the market?
October 2022: B.I. Incorporated, the U.S. player for electronic monitoring products and services, entered an exclusive agreement with OMNIA Partners Public Sector that allowed national city, county, and state government agencies to contract with B.I. for its community corrections supervision technologies at competitive costs. Participating agencies save time and effort by skipping the lengthy Request for Proposal process.
9. What pricing options are available for accessing the report?
Pricing options include single-user, multi-user, and enterprise licenses priced at USD 4750, USD 5250, and USD 8750 respectively.
10. Is the market size provided in terms of value or volume?
The market size is provided in terms of value, measured in Million and volume, measured in K Unit.
11. Are there any specific market keywords associated with the report?
Yes, the market keyword associated with the report is "Electronic Offender Monitoring Solutions Industry," which aids in identifying and referencing the specific market segment covered.
12. How do I determine which pricing option suits my needs best?
The pricing options vary based on user requirements and access needs. Individual users may opt for single-user licenses, while businesses requiring broader access may choose multi-user or enterprise licenses for cost-effective access to the report.
13. Are there any additional resources or data provided in the Electronic Offender Monitoring Solutions Industry report?
While the report offers comprehensive insights, it's advisable to review the specific contents or supplementary materials provided to ascertain if additional resources or data are available.
14. How can I stay updated on further developments or reports in the Electronic Offender Monitoring Solutions Industry?
To stay informed about further developments, trends, and reports in the Electronic Offender Monitoring Solutions Industry, consider subscribing to industry newsletters, following relevant companies and organizations, or regularly checking reputable industry news sources and publications.
Methodology
Step 1 - Identification of Relevant Samples Size from Population Database


Step 2 - Approaches for Defining Global Market Size (Value, Volume* & Price*)

Note*: In applicable scenarios
Step 3 - Data Sources
Primary Research
- Web Analytics
- Survey Reports
- Research Institute
- Latest Research Reports
- Opinion Leaders
Secondary Research
- Annual Reports
- White Paper
- Latest Press Release
- Industry Association
- Paid Database
- Investor Presentations

Step 4 - Data Triangulation
Involves using different sources of information in order to increase the validity of a study
These sources are likely to be stakeholders in a program - participants, other researchers, program staff, other community members, and so on.
Then we put all data in single framework & apply various statistical tools to find out the dynamic on the market.
During the analysis stage, feedback from the stakeholder groups would be compared to determine areas of agreement as well as areas of divergence
