

Key Insights
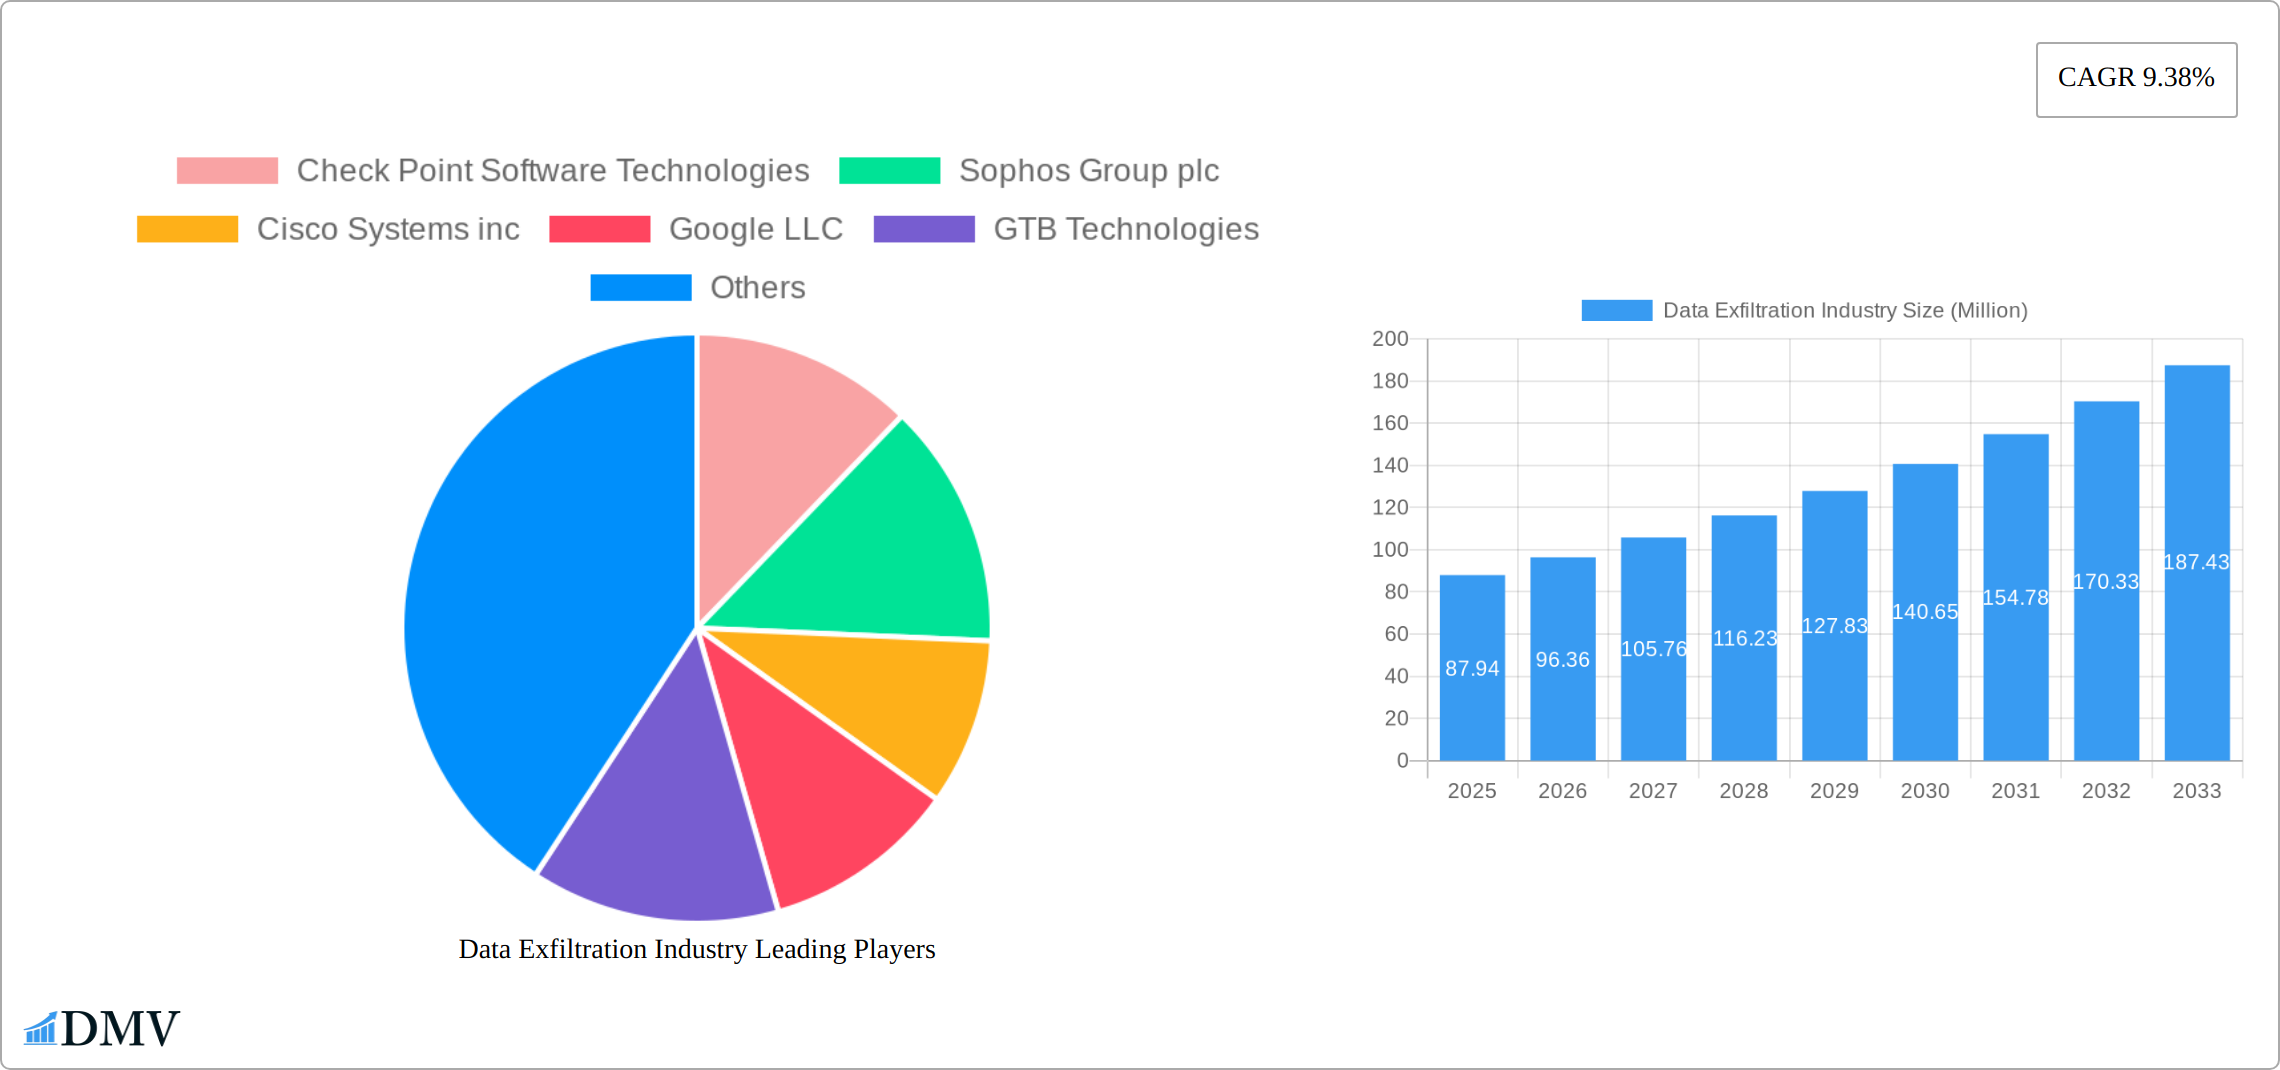
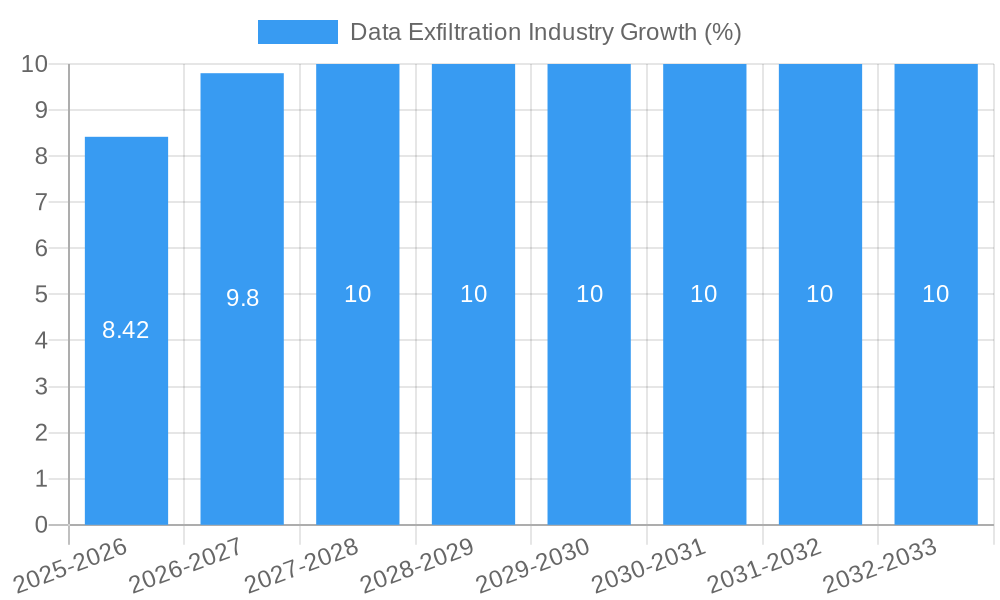
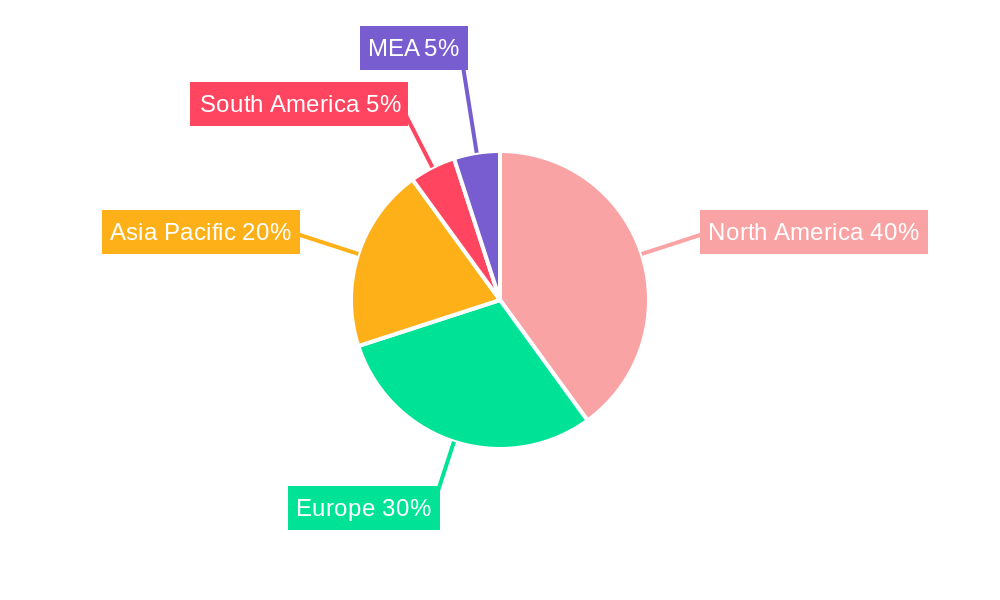
The data exfiltration prevention market, valued at $87.94 million in 2025, is experiencing robust growth, projected to expand at a Compound Annual Growth Rate (CAGR) of 9.38% from 2025 to 2033. This significant expansion is driven by the increasing frequency and sophistication of cyberattacks targeting sensitive data across various sectors. The rising adoption of cloud computing and remote work models, while offering flexibility, also expands the attack surface, making robust data exfiltration prevention solutions crucial for organizations of all sizes. Furthermore, stringent data privacy regulations like GDPR and CCPA are compelling businesses to invest heavily in advanced security measures to mitigate potential fines and reputational damage associated with data breaches. The market is segmented by organization size (SMEs and large enterprises), component (solutions and services), and end-user vertical (BFSI, IT & Telecom, Healthcare, Government, Retail, Manufacturing, and others). The solutions segment includes encryption, antivirus, firewall, intrusion detection systems, and data loss prevention tools, while services encompass penetration testing, support, maintenance, integration, and consulting. Large enterprises are currently the primary consumers of these solutions due to their extensive data holdings and complex IT infrastructures, but the SME segment is expected to see significant growth fueled by increasing awareness and affordability of solutions. Geographically, North America currently dominates the market, followed by Europe and Asia Pacific, with growth expected across all regions driven by increasing digitalization and expanding internet penetration.
The competitive landscape is characterized by a mix of established players like Check Point, Sophos, Cisco, and McAfee, alongside emerging innovative companies such as Zscaler and HackerOne. These companies offer a broad spectrum of solutions and services catering to diverse organizational needs and security postures. The market's future trajectory will be shaped by advancements in Artificial Intelligence (AI) and Machine Learning (ML) for threat detection, the integration of security solutions into broader IT ecosystems, and the continued evolution of attack vectors necessitating constant innovation in preventative measures. The potential for growth remains substantial, particularly as the global reliance on digital technologies continues to accelerate, increasing the demand for sophisticated data exfiltration prevention solutions. Furthermore, the increasing collaboration between cybersecurity vendors and governmental agencies is likely to foster a more resilient and secure digital ecosystem.
This comprehensive report provides an in-depth analysis of the Data Exfiltration Industry, projecting a market value of $xx Million by 2033. The study covers the period 2019-2033, with a focus on the 2025-2033 forecast period and a base year of 2025. It offers crucial insights for stakeholders seeking to understand market dynamics, competitive landscapes, and future growth opportunities within this critical sector.
Data Exfiltration Industry Market Composition & Trends
The Data Exfiltration market, valued at $xx Million in 2024, exhibits a moderately consolidated structure. Key players, including Check Point Software Technologies, Sophos Group plc, Cisco Systems Inc, and Palo Alto Networks, hold significant market share, though a fragmented landscape exists among smaller specialized vendors. Market share distribution is dynamic, influenced by continuous innovation, strategic acquisitions, and evolving regulatory landscapes. The industry witnesses substantial M&A activity, with deal values exceeding $xx Million annually in recent years.
- Market Concentration: Moderately Consolidated
- Innovation Catalysts: AI-powered threat detection, advanced encryption techniques, and cloud-based security solutions.
- Regulatory Landscape: Stringent data privacy regulations (GDPR, CCPA) are driving demand for robust data exfiltration prevention solutions.
- Substitute Products: Limited direct substitutes exist, but alternative security approaches may partially address overlapping concerns.
- End-User Profiles: Large enterprises and government organizations represent the highest spending segments, though SMEs are increasingly adopting such solutions.
- M&A Activity: Significant activity with annual deal values exceeding $xx Million, reflecting industry consolidation and expansion.
Data Exfiltration Industry Industry Evolution
The Data Exfiltration Industry has experienced significant growth fueled by increasing cyber threats, evolving data privacy regulations, and the rise of cloud computing and remote work. The market witnessed a Compound Annual Growth Rate (CAGR) of xx% during the historical period (2019-2024). Technological advancements, including AI-driven threat intelligence and automation, have enhanced detection and response capabilities. Consumer demand is shifting towards comprehensive, integrated security platforms that offer proactive threat prevention and real-time monitoring, rather than solely reactive solutions. The adoption rate of advanced solutions like Data Loss Prevention (DLP) and Insider Threat Management is rapidly increasing, further contributing to market expansion. We project a CAGR of xx% between 2025 and 2033, driven by increasing digital transformation and escalating cyberattacks. The market is anticipated to reach $xx Million by 2033.
Leading Regions, Countries, or Segments in Data Exfiltration Industry
North America currently dominates the Data Exfiltration market, driven by its robust IT infrastructure, high adoption of advanced security solutions, and stringent regulatory frameworks. However, the Asia-Pacific region is exhibiting the fastest growth, fueled by increasing digitalization, a burgeoning number of cyber threats, and expanding business operations in emerging economies.
- By Organization Size: Large enterprises, with their substantial budgets and complex IT infrastructures, currently account for the largest market share. Nevertheless, the Small and Medium-sized Enterprises (SME) segment demonstrates significant and rapidly expanding growth potential as cybersecurity becomes more accessible and critical for businesses of all sizes.
- By Component: Solutions, particularly Data Loss Prevention (DLP), encryption, and advanced firewall technologies, comprise the larger segment. Services, including penetration testing, incident response, and expert consulting, are experiencing robust growth. This surge is driven by the rising demand for specialized expertise to navigate increasingly sophisticated exfiltration tactics and ensure comprehensive security postures.
- By End-user Vertical: The Banking, Financial Services, and Insurance (BFSI), Information Technology (IT) & Telecommunications, and Government & Defense sectors are leading adopters. This dominance is due to their strict regulatory compliance requirements and the exceptionally high sensitivity of the data they manage, making them prime targets for exfiltration attempts.
Key growth drivers for the data exfiltration industry include significant and escalating investments in cybersecurity infrastructure, supportive government initiatives promoting cybersecurity awareness and best practices, and the enforcement of stringent data protection regulations globally, all of which necessitate advanced exfiltration prevention and detection capabilities.
Data Exfiltration Industry Product Innovations
Recent innovations in the data exfiltration industry are intensely focused on enhancing detection accuracy, significantly reducing false positives, and automating incident response workflows. Artificial Intelligence (AI)-powered solutions are becoming increasingly prevalent, offering advanced threat analysis, predictive capabilities, and the ability to learn and adapt to evolving exfiltration techniques. The emergence of cloud-native security platforms is simplifying deployment, management, and scalability, while seamless integration with existing security infrastructure is improving overall effectiveness and providing a unified view of security events. Key unique selling propositions now include frictionless integration, proactive threat prevention mechanisms, real-time anomaly detection, and minimized operational overhead. Performance metrics are increasingly emphasizing detection rates, rapid response times, comprehensive visibility, and user-friendliness for security teams.
Propelling Factors for Data Exfiltration Industry Growth
Technological advancements, particularly in the fields of AI and machine learning, are pivotal drivers, offering more sophisticated and effective threat detection and response mechanisms capable of identifying subtle exfiltration patterns. The accelerating adoption of cloud computing models and the widespread shift towards remote and hybrid work environments create new attack vectors and expand the potential exfiltration surface, thereby necessitating robust data exfiltration prevention and monitoring measures. Furthermore, the establishment and enforcement of stringent data privacy regulations across various jurisdictions, coupled with a growing global awareness of cybersecurity risks and the potential business and reputational damage of data breaches, are significantly fueling market growth and the demand for advanced solutions.
Obstacles in the Data Exfiltration Industry Market
High implementation costs and a lack of skilled cybersecurity professionals pose significant barriers to entry and adoption, especially for smaller organizations. Supply chain disruptions can impact the availability of critical components, and intense competition among established players can limit margins. Regulatory compliance can also be a challenge for vendors and end-users alike.
Future Opportunities in Data Exfiltration Industry
Emerging technologies such as blockchain, with its potential for enhanced data integrity and audit trails, and quantum computing, which presents both novel threats and defensive opportunities, represent significant future frontiers. Expansion into developing economies with rapidly growing digital infrastructures and the escalating adoption of Internet of Things (IoT) devices, which often present unique security challenges, represent substantial growth avenues for data exfiltration solutions. The persistent and increasing need for more advanced threat intelligence, predictive analytics, and fully automated incident response capabilities creates significant opportunities for specialized service providers and innovative technology developers to offer tailored and cutting-edge solutions to enterprises.
Major Players in the Data Exfiltration Industry Ecosystem
- Check Point Software Technologies
- Sophos Group plc
- Cisco Systems Inc
- Google LLC
- GTB Technologies
- McAfee LLC
- Zscaler
- 7 2 Investment Analysi
- Fortinet
- HP Inc
- Juniper Networks
- NortonLifeLock
- Palo Alto Networks
- Barracuda Networks
- HackerOne Inc
Key Developments in Data Exfiltration Industry Industry
- August 2022: Code42 Software, Inc. partnered with Nullafi to enhance insider risk management and bolster the prevention of sensitive data exfiltration. This strategic collaboration underscores the escalating industry focus on proactively addressing insider threats as a critical component of data security.
- January 2023: EfficientIP launched a free DNS-based Data Exfiltration Application. This initiative empowers organizations to conduct ethical hacking exercises, simulate attack scenarios, and proactively identify vulnerabilities within their networks, reflecting the growing importance of accessible, proactive security testing tools and methods.
Strategic Data Exfiltration Industry Market Forecast
The Data Exfiltration market is poised for continued robust growth, driven by increasing digital transformation, heightened cybersecurity threats, and stringent regulatory requirements. Emerging technologies and expanding adoption in new markets will further accelerate market expansion, presenting significant opportunities for both established players and new entrants. The market's potential for innovation and growth remains substantial over the forecast period.
Data Exfiltration Industry Segmentation
-
1. Organization Size
- 1.1. Small- and Medium-sized Enterprises (SMEs)
- 1.2. Large Enterprise
-
2. Component
- 2.1. Solution
- 2.2. Services
-
3. End-user Vertical
- 3.1. Banking, Financial Services, and Insurance (BFSI)
- 3.2. IT and Telecom
- 3.3. Healthcare and Life Sciences
- 3.4. Government and Defense
- 3.5. Retail and E-commerce
- 3.6. Manufacturing
- 3.7. Other End-user Verticals
Data Exfiltration Industry Segmentation By Geography
-
1. North America
- 1.1. United States
- 1.2. Canada
-
2. Europe
- 2.1. Germany
- 2.2. United Kingdom
- 2.3. France
- 2.4. Rest of Europe
-
3. Asia Pacific
- 3.1. India
- 3.2. China
- 3.3. Japan
- 3.4. Rest of Asia Pacific
-
4. Latin America
- 4.1. Brazil
- 4.2. Argentina
- 4.3. Rest of Latin America
-
5. Middle East and Africa
- 5.1. United Arab Emirates
- 5.2. Saudi Arabia
- 5.3. Rest of Middle East and Africa
Data Exfiltration Industry REPORT HIGHLIGHTS
| Aspects | Details |
|---|---|
| Study Period | 2019-2033 |
| Base Year | 2024 |
| Estimated Year | 2025 |
| Forecast Period | 2025-2033 |
| Historical Period | 2019-2024 |
| Growth Rate | CAGR of 9.38% from 2019-2033 |
| Segmentation |
|
Table of Contents
- 1. Introduction
- 1.1. Research Scope
- 1.2. Market Segmentation
- 1.3. Research Methodology
- 1.4. Definitions and Assumptions
- 2. Executive Summary
- 2.1. Introduction
- 3. Market Dynamics
- 3.1. Introduction
- 3.2. Market Drivers
- 3.2.1. Exponential Growth in the Volumes of Enterprise Data and the Need for Data Exfiltration Prevention Solutions; Strict Regulatory Requirements for Data Protection; Increasing Incidents of Data Loss in the On-Premises Environment
- 3.3. Market Restrains
- 3.3.1. Compatibility Issues Between On-premises Application and the Cloud Environment
- 3.4. Market Trends
- 3.4.1. Healthcare and Life Sciences End User Segment is Expected to Hold Significant Market Share
- 4. Market Factor Analysis
- 4.1. Porters Five Forces
- 4.2. Supply/Value Chain
- 4.3. PESTEL analysis
- 4.4. Market Entropy
- 4.5. Patent/Trademark Analysis
- 5. Global Data Exfiltration Industry Analysis, Insights and Forecast, 2019-2031
- 5.1. Market Analysis, Insights and Forecast - by Organization Size
- 5.1.1. Small- and Medium-sized Enterprises (SMEs)
- 5.1.2. Large Enterprise
- 5.2. Market Analysis, Insights and Forecast - by Component
- 5.2.1. Solution
- 5.2.2. Services
- 5.3. Market Analysis, Insights and Forecast - by End-user Vertical
- 5.3.1. Banking, Financial Services, and Insurance (BFSI)
- 5.3.2. IT and Telecom
- 5.3.3. Healthcare and Life Sciences
- 5.3.4. Government and Defense
- 5.3.5. Retail and E-commerce
- 5.3.6. Manufacturing
- 5.3.7. Other End-user Verticals
- 5.4. Market Analysis, Insights and Forecast - by Region
- 5.4.1. North America
- 5.4.2. Europe
- 5.4.3. Asia Pacific
- 5.4.4. Latin America
- 5.4.5. Middle East and Africa
- 5.1. Market Analysis, Insights and Forecast - by Organization Size
- 6. North America Data Exfiltration Industry Analysis, Insights and Forecast, 2019-2031
- 6.1. Market Analysis, Insights and Forecast - by Organization Size
- 6.1.1. Small- and Medium-sized Enterprises (SMEs)
- 6.1.2. Large Enterprise
- 6.2. Market Analysis, Insights and Forecast - by Component
- 6.2.1. Solution
- 6.2.2. Services
- 6.3. Market Analysis, Insights and Forecast - by End-user Vertical
- 6.3.1. Banking, Financial Services, and Insurance (BFSI)
- 6.3.2. IT and Telecom
- 6.3.3. Healthcare and Life Sciences
- 6.3.4. Government and Defense
- 6.3.5. Retail and E-commerce
- 6.3.6. Manufacturing
- 6.3.7. Other End-user Verticals
- 6.1. Market Analysis, Insights and Forecast - by Organization Size
- 7. Europe Data Exfiltration Industry Analysis, Insights and Forecast, 2019-2031
- 7.1. Market Analysis, Insights and Forecast - by Organization Size
- 7.1.1. Small- and Medium-sized Enterprises (SMEs)
- 7.1.2. Large Enterprise
- 7.2. Market Analysis, Insights and Forecast - by Component
- 7.2.1. Solution
- 7.2.2. Services
- 7.3. Market Analysis, Insights and Forecast - by End-user Vertical
- 7.3.1. Banking, Financial Services, and Insurance (BFSI)
- 7.3.2. IT and Telecom
- 7.3.3. Healthcare and Life Sciences
- 7.3.4. Government and Defense
- 7.3.5. Retail and E-commerce
- 7.3.6. Manufacturing
- 7.3.7. Other End-user Verticals
- 7.1. Market Analysis, Insights and Forecast - by Organization Size
- 8. Asia Pacific Data Exfiltration Industry Analysis, Insights and Forecast, 2019-2031
- 8.1. Market Analysis, Insights and Forecast - by Organization Size
- 8.1.1. Small- and Medium-sized Enterprises (SMEs)
- 8.1.2. Large Enterprise
- 8.2. Market Analysis, Insights and Forecast - by Component
- 8.2.1. Solution
- 8.2.2. Services
- 8.3. Market Analysis, Insights and Forecast - by End-user Vertical
- 8.3.1. Banking, Financial Services, and Insurance (BFSI)
- 8.3.2. IT and Telecom
- 8.3.3. Healthcare and Life Sciences
- 8.3.4. Government and Defense
- 8.3.5. Retail and E-commerce
- 8.3.6. Manufacturing
- 8.3.7. Other End-user Verticals
- 8.1. Market Analysis, Insights and Forecast - by Organization Size
- 9. Latin America Data Exfiltration Industry Analysis, Insights and Forecast, 2019-2031
- 9.1. Market Analysis, Insights and Forecast - by Organization Size
- 9.1.1. Small- and Medium-sized Enterprises (SMEs)
- 9.1.2. Large Enterprise
- 9.2. Market Analysis, Insights and Forecast - by Component
- 9.2.1. Solution
- 9.2.2. Services
- 9.3. Market Analysis, Insights and Forecast - by End-user Vertical
- 9.3.1. Banking, Financial Services, and Insurance (BFSI)
- 9.3.2. IT and Telecom
- 9.3.3. Healthcare and Life Sciences
- 9.3.4. Government and Defense
- 9.3.5. Retail and E-commerce
- 9.3.6. Manufacturing
- 9.3.7. Other End-user Verticals
- 9.1. Market Analysis, Insights and Forecast - by Organization Size
- 10. Middle East and Africa Data Exfiltration Industry Analysis, Insights and Forecast, 2019-2031
- 10.1. Market Analysis, Insights and Forecast - by Organization Size
- 10.1.1. Small- and Medium-sized Enterprises (SMEs)
- 10.1.2. Large Enterprise
- 10.2. Market Analysis, Insights and Forecast - by Component
- 10.2.1. Solution
- 10.2.2. Services
- 10.3. Market Analysis, Insights and Forecast - by End-user Vertical
- 10.3.1. Banking, Financial Services, and Insurance (BFSI)
- 10.3.2. IT and Telecom
- 10.3.3. Healthcare and Life Sciences
- 10.3.4. Government and Defense
- 10.3.5. Retail and E-commerce
- 10.3.6. Manufacturing
- 10.3.7. Other End-user Verticals
- 10.1. Market Analysis, Insights and Forecast - by Organization Size
- 11. North America Data Exfiltration Industry Analysis, Insights and Forecast, 2019-2031
- 11.1. Market Analysis, Insights and Forecast - By Country/Sub-region
- 11.1.1 United States
- 11.1.2 Canada
- 11.1.3 Mexico
- 12. Europe Data Exfiltration Industry Analysis, Insights and Forecast, 2019-2031
- 12.1. Market Analysis, Insights and Forecast - By Country/Sub-region
- 12.1.1 Germany
- 12.1.2 United Kingdom
- 12.1.3 France
- 12.1.4 Spain
- 12.1.5 Italy
- 12.1.6 Spain
- 12.1.7 Belgium
- 12.1.8 Netherland
- 12.1.9 Nordics
- 12.1.10 Rest of Europe
- 13. Asia Pacific Data Exfiltration Industry Analysis, Insights and Forecast, 2019-2031
- 13.1. Market Analysis, Insights and Forecast - By Country/Sub-region
- 13.1.1 China
- 13.1.2 Japan
- 13.1.3 India
- 13.1.4 South Korea
- 13.1.5 Southeast Asia
- 13.1.6 Australia
- 13.1.7 Indonesia
- 13.1.8 Phillipes
- 13.1.9 Singapore
- 13.1.10 Thailandc
- 13.1.11 Rest of Asia Pacific
- 14. South America Data Exfiltration Industry Analysis, Insights and Forecast, 2019-2031
- 14.1. Market Analysis, Insights and Forecast - By Country/Sub-region
- 14.1.1 Brazil
- 14.1.2 Argentina
- 14.1.3 Peru
- 14.1.4 Chile
- 14.1.5 Colombia
- 14.1.6 Ecuador
- 14.1.7 Venezuela
- 14.1.8 Rest of South America
- 15. North America Data Exfiltration Industry Analysis, Insights and Forecast, 2019-2031
- 15.1. Market Analysis, Insights and Forecast - By Country/Sub-region
- 15.1.1 United States
- 15.1.2 Canada
- 15.1.3 Mexico
- 16. MEA Data Exfiltration Industry Analysis, Insights and Forecast, 2019-2031
- 16.1. Market Analysis, Insights and Forecast - By Country/Sub-region
- 16.1.1 United Arab Emirates
- 16.1.2 Saudi Arabia
- 16.1.3 South Africa
- 16.1.4 Rest of Middle East and Africa
- 17. Competitive Analysis
- 17.1. Global Market Share Analysis 2024
- 17.2. Company Profiles
- 17.2.1 Check Point Software Technologies
- 17.2.1.1. Overview
- 17.2.1.2. Products
- 17.2.1.3. SWOT Analysis
- 17.2.1.4. Recent Developments
- 17.2.1.5. Financials (Based on Availability)
- 17.2.2 Sophos Group plc
- 17.2.2.1. Overview
- 17.2.2.2. Products
- 17.2.2.3. SWOT Analysis
- 17.2.2.4. Recent Developments
- 17.2.2.5. Financials (Based on Availability)
- 17.2.3 Cisco Systems inc
- 17.2.3.1. Overview
- 17.2.3.2. Products
- 17.2.3.3. SWOT Analysis
- 17.2.3.4. Recent Developments
- 17.2.3.5. Financials (Based on Availability)
- 17.2.4 Google LLC
- 17.2.4.1. Overview
- 17.2.4.2. Products
- 17.2.4.3. SWOT Analysis
- 17.2.4.4. Recent Developments
- 17.2.4.5. Financials (Based on Availability)
- 17.2.5 GTB Technologies
- 17.2.5.1. Overview
- 17.2.5.2. Products
- 17.2.5.3. SWOT Analysis
- 17.2.5.4. Recent Developments
- 17.2.5.5. Financials (Based on Availability)
- 17.2.6 McAfee LLC
- 17.2.6.1. Overview
- 17.2.6.2. Products
- 17.2.6.3. SWOT Analysis
- 17.2.6.4. Recent Developments
- 17.2.6.5. Financials (Based on Availability)
- 17.2.7 Zscaler*List Not Exhaustive 7 2 Investment Analysi
- 17.2.7.1. Overview
- 17.2.7.2. Products
- 17.2.7.3. SWOT Analysis
- 17.2.7.4. Recent Developments
- 17.2.7.5. Financials (Based on Availability)
- 17.2.8 Fortinet
- 17.2.8.1. Overview
- 17.2.8.2. Products
- 17.2.8.3. SWOT Analysis
- 17.2.8.4. Recent Developments
- 17.2.8.5. Financials (Based on Availability)
- 17.2.9 HP Inc
- 17.2.9.1. Overview
- 17.2.9.2. Products
- 17.2.9.3. SWOT Analysis
- 17.2.9.4. Recent Developments
- 17.2.9.5. Financials (Based on Availability)
- 17.2.10 Juniper Networks
- 17.2.10.1. Overview
- 17.2.10.2. Products
- 17.2.10.3. SWOT Analysis
- 17.2.10.4. Recent Developments
- 17.2.10.5. Financials (Based on Availability)
- 17.2.11 NortonLifeLock
- 17.2.11.1. Overview
- 17.2.11.2. Products
- 17.2.11.3. SWOT Analysis
- 17.2.11.4. Recent Developments
- 17.2.11.5. Financials (Based on Availability)
- 17.2.12 Palo Alto Networks
- 17.2.12.1. Overview
- 17.2.12.2. Products
- 17.2.12.3. SWOT Analysis
- 17.2.12.4. Recent Developments
- 17.2.12.5. Financials (Based on Availability)
- 17.2.13 Barracuda Networks
- 17.2.13.1. Overview
- 17.2.13.2. Products
- 17.2.13.3. SWOT Analysis
- 17.2.13.4. Recent Developments
- 17.2.13.5. Financials (Based on Availability)
- 17.2.14 Hackerone Inc
- 17.2.14.1. Overview
- 17.2.14.2. Products
- 17.2.14.3. SWOT Analysis
- 17.2.14.4. Recent Developments
- 17.2.14.5. Financials (Based on Availability)
- 17.2.1 Check Point Software Technologies
List of Figures
- Figure 1: Global Data Exfiltration Industry Revenue Breakdown (Million, %) by Region 2024 & 2032
- Figure 2: North America Data Exfiltration Industry Revenue (Million), by Country 2024 & 2032
- Figure 3: North America Data Exfiltration Industry Revenue Share (%), by Country 2024 & 2032
- Figure 4: Europe Data Exfiltration Industry Revenue (Million), by Country 2024 & 2032
- Figure 5: Europe Data Exfiltration Industry Revenue Share (%), by Country 2024 & 2032
- Figure 6: Asia Pacific Data Exfiltration Industry Revenue (Million), by Country 2024 & 2032
- Figure 7: Asia Pacific Data Exfiltration Industry Revenue Share (%), by Country 2024 & 2032
- Figure 8: South America Data Exfiltration Industry Revenue (Million), by Country 2024 & 2032
- Figure 9: South America Data Exfiltration Industry Revenue Share (%), by Country 2024 & 2032
- Figure 10: North America Data Exfiltration Industry Revenue (Million), by Country 2024 & 2032
- Figure 11: North America Data Exfiltration Industry Revenue Share (%), by Country 2024 & 2032
- Figure 12: MEA Data Exfiltration Industry Revenue (Million), by Country 2024 & 2032
- Figure 13: MEA Data Exfiltration Industry Revenue Share (%), by Country 2024 & 2032
- Figure 14: North America Data Exfiltration Industry Revenue (Million), by Organization Size 2024 & 2032
- Figure 15: North America Data Exfiltration Industry Revenue Share (%), by Organization Size 2024 & 2032
- Figure 16: North America Data Exfiltration Industry Revenue (Million), by Component 2024 & 2032
- Figure 17: North America Data Exfiltration Industry Revenue Share (%), by Component 2024 & 2032
- Figure 18: North America Data Exfiltration Industry Revenue (Million), by End-user Vertical 2024 & 2032
- Figure 19: North America Data Exfiltration Industry Revenue Share (%), by End-user Vertical 2024 & 2032
- Figure 20: North America Data Exfiltration Industry Revenue (Million), by Country 2024 & 2032
- Figure 21: North America Data Exfiltration Industry Revenue Share (%), by Country 2024 & 2032
- Figure 22: Europe Data Exfiltration Industry Revenue (Million), by Organization Size 2024 & 2032
- Figure 23: Europe Data Exfiltration Industry Revenue Share (%), by Organization Size 2024 & 2032
- Figure 24: Europe Data Exfiltration Industry Revenue (Million), by Component 2024 & 2032
- Figure 25: Europe Data Exfiltration Industry Revenue Share (%), by Component 2024 & 2032
- Figure 26: Europe Data Exfiltration Industry Revenue (Million), by End-user Vertical 2024 & 2032
- Figure 27: Europe Data Exfiltration Industry Revenue Share (%), by End-user Vertical 2024 & 2032
- Figure 28: Europe Data Exfiltration Industry Revenue (Million), by Country 2024 & 2032
- Figure 29: Europe Data Exfiltration Industry Revenue Share (%), by Country 2024 & 2032
- Figure 30: Asia Pacific Data Exfiltration Industry Revenue (Million), by Organization Size 2024 & 2032
- Figure 31: Asia Pacific Data Exfiltration Industry Revenue Share (%), by Organization Size 2024 & 2032
- Figure 32: Asia Pacific Data Exfiltration Industry Revenue (Million), by Component 2024 & 2032
- Figure 33: Asia Pacific Data Exfiltration Industry Revenue Share (%), by Component 2024 & 2032
- Figure 34: Asia Pacific Data Exfiltration Industry Revenue (Million), by End-user Vertical 2024 & 2032
- Figure 35: Asia Pacific Data Exfiltration Industry Revenue Share (%), by End-user Vertical 2024 & 2032
- Figure 36: Asia Pacific Data Exfiltration Industry Revenue (Million), by Country 2024 & 2032
- Figure 37: Asia Pacific Data Exfiltration Industry Revenue Share (%), by Country 2024 & 2032
- Figure 38: Latin America Data Exfiltration Industry Revenue (Million), by Organization Size 2024 & 2032
- Figure 39: Latin America Data Exfiltration Industry Revenue Share (%), by Organization Size 2024 & 2032
- Figure 40: Latin America Data Exfiltration Industry Revenue (Million), by Component 2024 & 2032
- Figure 41: Latin America Data Exfiltration Industry Revenue Share (%), by Component 2024 & 2032
- Figure 42: Latin America Data Exfiltration Industry Revenue (Million), by End-user Vertical 2024 & 2032
- Figure 43: Latin America Data Exfiltration Industry Revenue Share (%), by End-user Vertical 2024 & 2032
- Figure 44: Latin America Data Exfiltration Industry Revenue (Million), by Country 2024 & 2032
- Figure 45: Latin America Data Exfiltration Industry Revenue Share (%), by Country 2024 & 2032
- Figure 46: Middle East and Africa Data Exfiltration Industry Revenue (Million), by Organization Size 2024 & 2032
- Figure 47: Middle East and Africa Data Exfiltration Industry Revenue Share (%), by Organization Size 2024 & 2032
- Figure 48: Middle East and Africa Data Exfiltration Industry Revenue (Million), by Component 2024 & 2032
- Figure 49: Middle East and Africa Data Exfiltration Industry Revenue Share (%), by Component 2024 & 2032
- Figure 50: Middle East and Africa Data Exfiltration Industry Revenue (Million), by End-user Vertical 2024 & 2032
- Figure 51: Middle East and Africa Data Exfiltration Industry Revenue Share (%), by End-user Vertical 2024 & 2032
- Figure 52: Middle East and Africa Data Exfiltration Industry Revenue (Million), by Country 2024 & 2032
- Figure 53: Middle East and Africa Data Exfiltration Industry Revenue Share (%), by Country 2024 & 2032
List of Tables
- Table 1: Global Data Exfiltration Industry Revenue Million Forecast, by Region 2019 & 2032
- Table 2: Global Data Exfiltration Industry Revenue Million Forecast, by Organization Size 2019 & 2032
- Table 3: Global Data Exfiltration Industry Revenue Million Forecast, by Component 2019 & 2032
- Table 4: Global Data Exfiltration Industry Revenue Million Forecast, by End-user Vertical 2019 & 2032
- Table 5: Global Data Exfiltration Industry Revenue Million Forecast, by Region 2019 & 2032
- Table 6: Global Data Exfiltration Industry Revenue Million Forecast, by Country 2019 & 2032
- Table 7: United States Data Exfiltration Industry Revenue (Million) Forecast, by Application 2019 & 2032
- Table 8: Canada Data Exfiltration Industry Revenue (Million) Forecast, by Application 2019 & 2032
- Table 9: Mexico Data Exfiltration Industry Revenue (Million) Forecast, by Application 2019 & 2032
- Table 10: Global Data Exfiltration Industry Revenue Million Forecast, by Country 2019 & 2032
- Table 11: Germany Data Exfiltration Industry Revenue (Million) Forecast, by Application 2019 & 2032
- Table 12: United Kingdom Data Exfiltration Industry Revenue (Million) Forecast, by Application 2019 & 2032
- Table 13: France Data Exfiltration Industry Revenue (Million) Forecast, by Application 2019 & 2032
- Table 14: Spain Data Exfiltration Industry Revenue (Million) Forecast, by Application 2019 & 2032
- Table 15: Italy Data Exfiltration Industry Revenue (Million) Forecast, by Application 2019 & 2032
- Table 16: Spain Data Exfiltration Industry Revenue (Million) Forecast, by Application 2019 & 2032
- Table 17: Belgium Data Exfiltration Industry Revenue (Million) Forecast, by Application 2019 & 2032
- Table 18: Netherland Data Exfiltration Industry Revenue (Million) Forecast, by Application 2019 & 2032
- Table 19: Nordics Data Exfiltration Industry Revenue (Million) Forecast, by Application 2019 & 2032
- Table 20: Rest of Europe Data Exfiltration Industry Revenue (Million) Forecast, by Application 2019 & 2032
- Table 21: Global Data Exfiltration Industry Revenue Million Forecast, by Country 2019 & 2032
- Table 22: China Data Exfiltration Industry Revenue (Million) Forecast, by Application 2019 & 2032
- Table 23: Japan Data Exfiltration Industry Revenue (Million) Forecast, by Application 2019 & 2032
- Table 24: India Data Exfiltration Industry Revenue (Million) Forecast, by Application 2019 & 2032
- Table 25: South Korea Data Exfiltration Industry Revenue (Million) Forecast, by Application 2019 & 2032
- Table 26: Southeast Asia Data Exfiltration Industry Revenue (Million) Forecast, by Application 2019 & 2032
- Table 27: Australia Data Exfiltration Industry Revenue (Million) Forecast, by Application 2019 & 2032
- Table 28: Indonesia Data Exfiltration Industry Revenue (Million) Forecast, by Application 2019 & 2032
- Table 29: Phillipes Data Exfiltration Industry Revenue (Million) Forecast, by Application 2019 & 2032
- Table 30: Singapore Data Exfiltration Industry Revenue (Million) Forecast, by Application 2019 & 2032
- Table 31: Thailandc Data Exfiltration Industry Revenue (Million) Forecast, by Application 2019 & 2032
- Table 32: Rest of Asia Pacific Data Exfiltration Industry Revenue (Million) Forecast, by Application 2019 & 2032
- Table 33: Global Data Exfiltration Industry Revenue Million Forecast, by Country 2019 & 2032
- Table 34: Brazil Data Exfiltration Industry Revenue (Million) Forecast, by Application 2019 & 2032
- Table 35: Argentina Data Exfiltration Industry Revenue (Million) Forecast, by Application 2019 & 2032
- Table 36: Peru Data Exfiltration Industry Revenue (Million) Forecast, by Application 2019 & 2032
- Table 37: Chile Data Exfiltration Industry Revenue (Million) Forecast, by Application 2019 & 2032
- Table 38: Colombia Data Exfiltration Industry Revenue (Million) Forecast, by Application 2019 & 2032
- Table 39: Ecuador Data Exfiltration Industry Revenue (Million) Forecast, by Application 2019 & 2032
- Table 40: Venezuela Data Exfiltration Industry Revenue (Million) Forecast, by Application 2019 & 2032
- Table 41: Rest of South America Data Exfiltration Industry Revenue (Million) Forecast, by Application 2019 & 2032
- Table 42: Global Data Exfiltration Industry Revenue Million Forecast, by Country 2019 & 2032
- Table 43: United States Data Exfiltration Industry Revenue (Million) Forecast, by Application 2019 & 2032
- Table 44: Canada Data Exfiltration Industry Revenue (Million) Forecast, by Application 2019 & 2032
- Table 45: Mexico Data Exfiltration Industry Revenue (Million) Forecast, by Application 2019 & 2032
- Table 46: Global Data Exfiltration Industry Revenue Million Forecast, by Country 2019 & 2032
- Table 47: United Arab Emirates Data Exfiltration Industry Revenue (Million) Forecast, by Application 2019 & 2032
- Table 48: Saudi Arabia Data Exfiltration Industry Revenue (Million) Forecast, by Application 2019 & 2032
- Table 49: South Africa Data Exfiltration Industry Revenue (Million) Forecast, by Application 2019 & 2032
- Table 50: Rest of Middle East and Africa Data Exfiltration Industry Revenue (Million) Forecast, by Application 2019 & 2032
- Table 51: Global Data Exfiltration Industry Revenue Million Forecast, by Organization Size 2019 & 2032
- Table 52: Global Data Exfiltration Industry Revenue Million Forecast, by Component 2019 & 2032
- Table 53: Global Data Exfiltration Industry Revenue Million Forecast, by End-user Vertical 2019 & 2032
- Table 54: Global Data Exfiltration Industry Revenue Million Forecast, by Country 2019 & 2032
- Table 55: United States Data Exfiltration Industry Revenue (Million) Forecast, by Application 2019 & 2032
- Table 56: Canada Data Exfiltration Industry Revenue (Million) Forecast, by Application 2019 & 2032
- Table 57: Global Data Exfiltration Industry Revenue Million Forecast, by Organization Size 2019 & 2032
- Table 58: Global Data Exfiltration Industry Revenue Million Forecast, by Component 2019 & 2032
- Table 59: Global Data Exfiltration Industry Revenue Million Forecast, by End-user Vertical 2019 & 2032
- Table 60: Global Data Exfiltration Industry Revenue Million Forecast, by Country 2019 & 2032
- Table 61: Germany Data Exfiltration Industry Revenue (Million) Forecast, by Application 2019 & 2032
- Table 62: United Kingdom Data Exfiltration Industry Revenue (Million) Forecast, by Application 2019 & 2032
- Table 63: France Data Exfiltration Industry Revenue (Million) Forecast, by Application 2019 & 2032
- Table 64: Rest of Europe Data Exfiltration Industry Revenue (Million) Forecast, by Application 2019 & 2032
- Table 65: Global Data Exfiltration Industry Revenue Million Forecast, by Organization Size 2019 & 2032
- Table 66: Global Data Exfiltration Industry Revenue Million Forecast, by Component 2019 & 2032
- Table 67: Global Data Exfiltration Industry Revenue Million Forecast, by End-user Vertical 2019 & 2032
- Table 68: Global Data Exfiltration Industry Revenue Million Forecast, by Country 2019 & 2032
- Table 69: India Data Exfiltration Industry Revenue (Million) Forecast, by Application 2019 & 2032
- Table 70: China Data Exfiltration Industry Revenue (Million) Forecast, by Application 2019 & 2032
- Table 71: Japan Data Exfiltration Industry Revenue (Million) Forecast, by Application 2019 & 2032
- Table 72: Rest of Asia Pacific Data Exfiltration Industry Revenue (Million) Forecast, by Application 2019 & 2032
- Table 73: Global Data Exfiltration Industry Revenue Million Forecast, by Organization Size 2019 & 2032
- Table 74: Global Data Exfiltration Industry Revenue Million Forecast, by Component 2019 & 2032
- Table 75: Global Data Exfiltration Industry Revenue Million Forecast, by End-user Vertical 2019 & 2032
- Table 76: Global Data Exfiltration Industry Revenue Million Forecast, by Country 2019 & 2032
- Table 77: Brazil Data Exfiltration Industry Revenue (Million) Forecast, by Application 2019 & 2032
- Table 78: Argentina Data Exfiltration Industry Revenue (Million) Forecast, by Application 2019 & 2032
- Table 79: Rest of Latin America Data Exfiltration Industry Revenue (Million) Forecast, by Application 2019 & 2032
- Table 80: Global Data Exfiltration Industry Revenue Million Forecast, by Organization Size 2019 & 2032
- Table 81: Global Data Exfiltration Industry Revenue Million Forecast, by Component 2019 & 2032
- Table 82: Global Data Exfiltration Industry Revenue Million Forecast, by End-user Vertical 2019 & 2032
- Table 83: Global Data Exfiltration Industry Revenue Million Forecast, by Country 2019 & 2032
- Table 84: United Arab Emirates Data Exfiltration Industry Revenue (Million) Forecast, by Application 2019 & 2032
- Table 85: Saudi Arabia Data Exfiltration Industry Revenue (Million) Forecast, by Application 2019 & 2032
- Table 86: Rest of Middle East and Africa Data Exfiltration Industry Revenue (Million) Forecast, by Application 2019 & 2032
Frequently Asked Questions
1. What is the projected Compound Annual Growth Rate (CAGR) of the Data Exfiltration Industry?
The projected CAGR is approximately 9.38%.
2. Which companies are prominent players in the Data Exfiltration Industry?
Key companies in the market include Check Point Software Technologies, Sophos Group plc, Cisco Systems inc, Google LLC, GTB Technologies, McAfee LLC, Zscaler*List Not Exhaustive 7 2 Investment Analysi, Fortinet, HP Inc, Juniper Networks, NortonLifeLock, Palo Alto Networks, Barracuda Networks, Hackerone Inc.
3. What are the main segments of the Data Exfiltration Industry?
The market segments include Organization Size, Component, End-user Vertical.
4. Can you provide details about the market size?
The market size is estimated to be USD 87.94 Million as of 2022.
5. What are some drivers contributing to market growth?
Exponential Growth in the Volumes of Enterprise Data and the Need for Data Exfiltration Prevention Solutions; Strict Regulatory Requirements for Data Protection; Increasing Incidents of Data Loss in the On-Premises Environment.
6. What are the notable trends driving market growth?
Healthcare and Life Sciences End User Segment is Expected to Hold Significant Market Share.
7. Are there any restraints impacting market growth?
Compatibility Issues Between On-premises Application and the Cloud Environment.
8. Can you provide examples of recent developments in the market?
January 2023: EfficientIP, the DDI security and automation specialist (DNS, DHCP, IPAM), announced the availability of its new DNS-based Data Exfiltration Application to partners and organizations for free. The program is intended to be a hands-on online tool that allows enterprises to conduct their own 'ethical hack' on their DNS system and related security defenses to uncover potential network weaknesses that might lead to a data breach.
9. What pricing options are available for accessing the report?
Pricing options include single-user, multi-user, and enterprise licenses priced at USD 4750, USD 5250, and USD 8750 respectively.
10. Is the market size provided in terms of value or volume?
The market size is provided in terms of value, measured in Million.
11. Are there any specific market keywords associated with the report?
Yes, the market keyword associated with the report is "Data Exfiltration Industry," which aids in identifying and referencing the specific market segment covered.
12. How do I determine which pricing option suits my needs best?
The pricing options vary based on user requirements and access needs. Individual users may opt for single-user licenses, while businesses requiring broader access may choose multi-user or enterprise licenses for cost-effective access to the report.
13. Are there any additional resources or data provided in the Data Exfiltration Industry report?
While the report offers comprehensive insights, it's advisable to review the specific contents or supplementary materials provided to ascertain if additional resources or data are available.
14. How can I stay updated on further developments or reports in the Data Exfiltration Industry?
To stay informed about further developments, trends, and reports in the Data Exfiltration Industry, consider subscribing to industry newsletters, following relevant companies and organizations, or regularly checking reputable industry news sources and publications.
Methodology
Step 1 - Identification of Relevant Samples Size from Population Database


Step 2 - Approaches for Defining Global Market Size (Value, Volume* & Price*)

Note*: In applicable scenarios
Step 3 - Data Sources
Primary Research
- Web Analytics
- Survey Reports
- Research Institute
- Latest Research Reports
- Opinion Leaders
Secondary Research
- Annual Reports
- White Paper
- Latest Press Release
- Industry Association
- Paid Database
- Investor Presentations

Step 4 - Data Triangulation
Involves using different sources of information in order to increase the validity of a study
These sources are likely to be stakeholders in a program - participants, other researchers, program staff, other community members, and so on.
Then we put all data in single framework & apply various statistical tools to find out the dynamic on the market.
During the analysis stage, feedback from the stakeholder groups would be compared to determine areas of agreement as well as areas of divergence
