

Key Insights
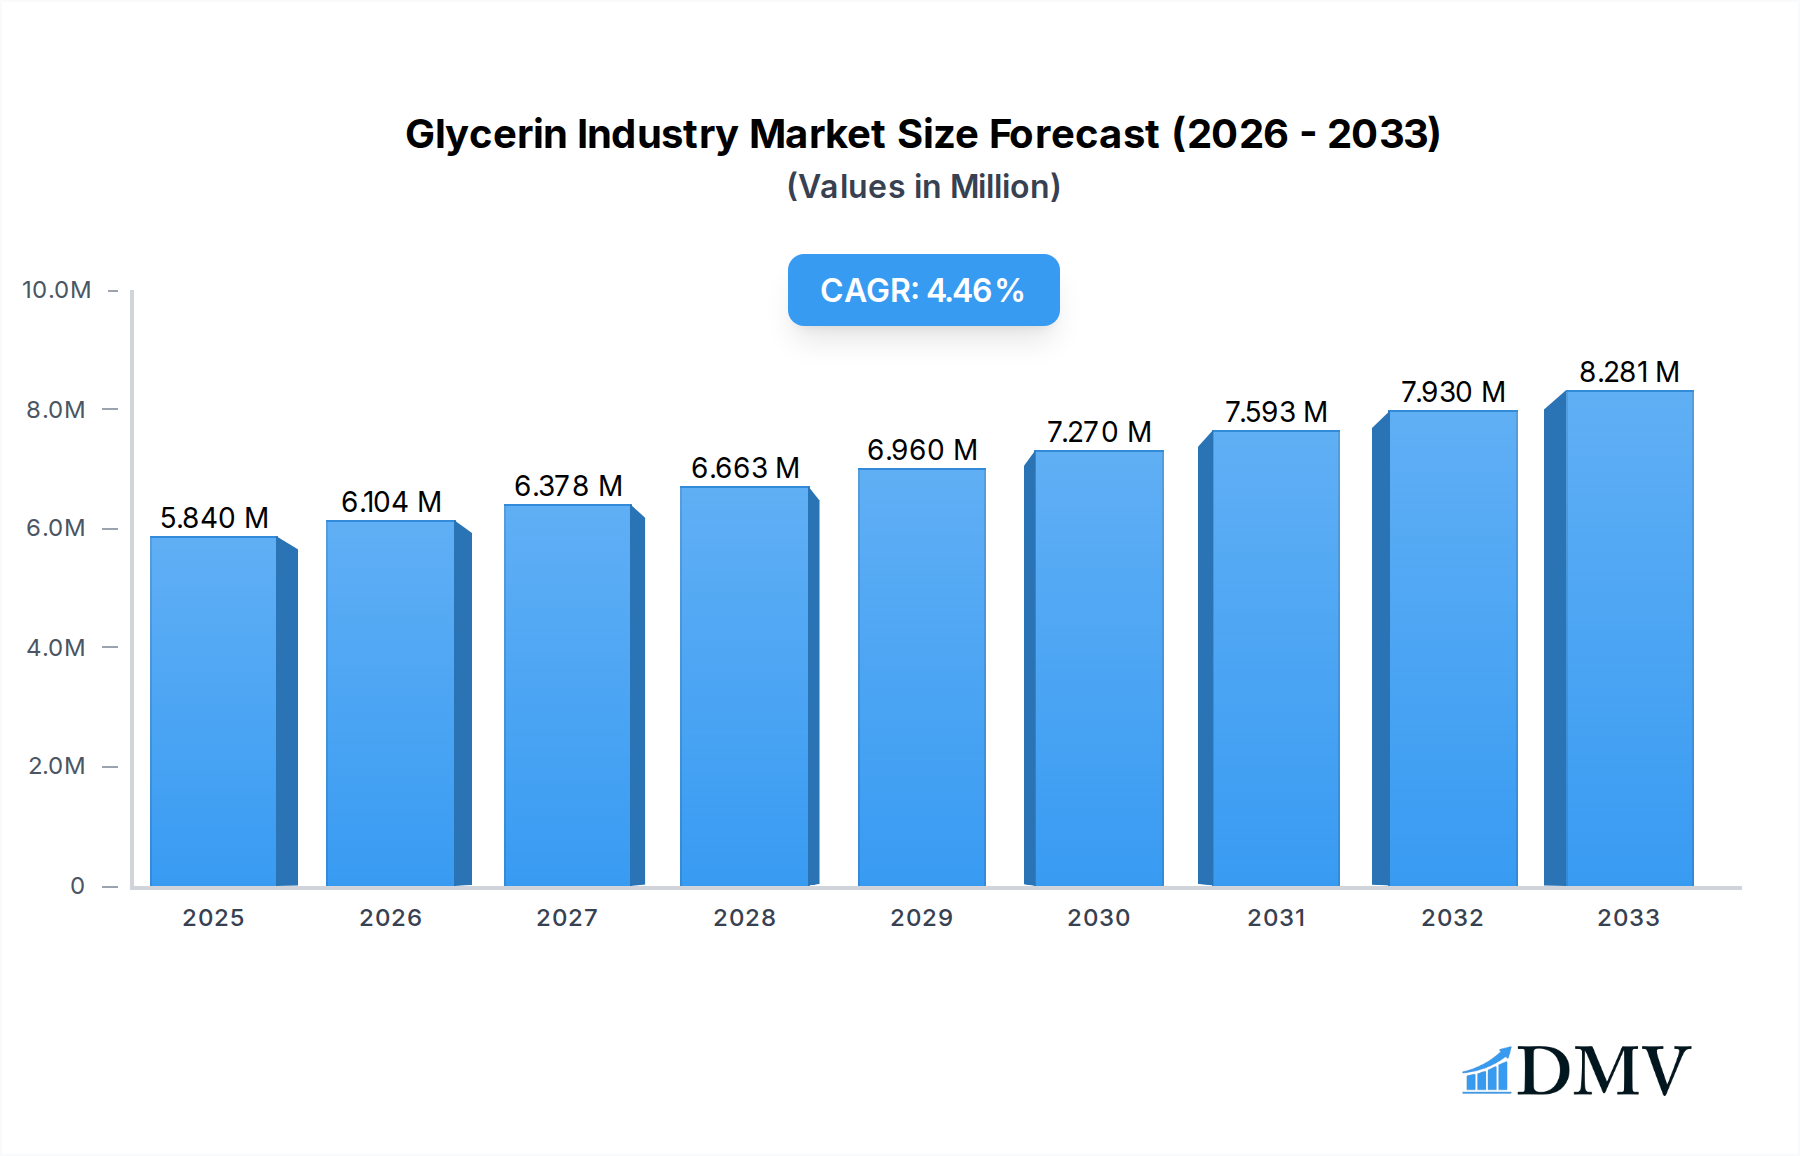
The global Glycerin market is poised for significant expansion, projected to reach $5.84 million in 2025 and grow at a compound annual growth rate (CAGR) of 4.5% through 2033. This robust growth is primarily fueled by the increasing demand from the burgeoning biodiesel industry, where glycerin is a key co-product. The rising global awareness and adoption of cleaner energy sources directly translate into a larger supply of crude glycerin, subsequently driving innovation in refining processes and expanding its applications. Furthermore, the expanding personal care and cosmetics sector, with its increasing use of natural and sustainable ingredients, is a major demand driver, as refined glycerin offers excellent moisturizing and emollient properties. The food and beverage industry also continues to be a stable consumer, leveraging glycerin for its humectant and sweetening qualities.

Glycerin Industry Market Size (In Million)
While the market benefits from strong demand, it also faces certain challenges. The fluctuating prices of raw materials, particularly vegetable oils and animal fats used in the production of fatty acids and biodiesels, can impact glycerin production costs. Additionally, the environmental regulations surrounding the disposal of crude glycerin and the energy-intensive nature of refining processes present operational hurdles. However, the industry is actively addressing these challenges through advancements in purification technologies and the development of higher-value glycerin derivatives. Emerging applications in pharmaceuticals, particularly in the formulation of excipients and active pharmaceutical ingredients, and its role in the production of polyether polyols for various industrial uses, are expected to further diversify the market and contribute to its sustained upward trajectory.
Glycerin Industry Company Market Share
Glycerin Industry Market Composition & Trends
The global Glycerin market is characterized by a dynamic interplay of Crude Glycerin and Refined Glycerin segments, driven by robust demand from diverse applications such as Personal Care and Cosmetics, Pharmaceuticals, and Food and Beverage. The market's composition reveals a significant concentration of key players, including Louis Dreyfus Company, Cargill Incorporated, Wilmar International Ltd, and BASF SE, who collectively hold a substantial market share, estimated to be over 60% in the base year of 2025. Innovation remains a critical catalyst, with ongoing research into novel applications and sustainable production methods, particularly from Biodiesels and Fatty Acids sources. Regulatory landscapes, while varied across regions, increasingly favor sustainable glycerin production and usage. Substitute products, while present in certain niche applications, struggle to match glycerin's versatility and cost-effectiveness. End-user profiles are expanding beyond traditional industries to include advanced materials and bio-based chemicals. Mergers and acquisitions (M&A) activity, totaling approximately USD 500 million in the historical period 2019-2024, signals a trend towards consolidation and strategic expansion. For instance, Oleon's acquisition of a blending plant in Texas for USD 50 million underscores this trend. Market concentration, while high, is expected to see steady growth from emerging players and technological advancements.
Glycerin Industry Industry Evolution
The Glycerin industry has witnessed a remarkable evolution from 2019 to 2033, marked by significant growth trajectories, profound technological advancements, and a noticeable shift in consumer demands. Historically, the market's expansion was primarily fueled by its byproduct status in soap manufacturing and biodiesel production. However, the period between 2019 and 2024 saw an accelerated growth rate, averaging around 4.5% annually, largely driven by the burgeoning biodiesel sector in regions like North America and Europe, which significantly increased the supply of Crude Glycerin. Refined glycerin, on the other hand, experienced a sustained demand from high-value applications, contributing to its consistent growth. Technological advancements have been pivotal in this evolution. The development of more efficient purification techniques for crude glycerin has lowered production costs and improved quality, making it more competitive in a wider array of applications. Furthermore, innovations in catalytic conversion processes have unlocked new pathways for producing high-purity glycerin, enhancing its suitability for the demanding Pharmaceuticals and Food and Beverage sectors. The adoption of these advanced technologies has been steadily increasing, with an estimated 70% of global glycerin production now utilizing advanced refining processes.
Consumer demand has also played a crucial role. A growing awareness of sustainability and the desire for natural ingredients have propelled the demand for glycerin derived from renewable sources, particularly vegetable oils. This trend has benefited producers leveraging Fatty Acids and Fatty Alcohols as feedstocks. The personal care and cosmetics industry, a major consumer of Refined Glycerin, has seen an upward trend in demand for natural and organic products, further solidifying glycerin's position. The forecast period (2025–2033) is projected to witness a sustained growth momentum, with an estimated average annual growth rate of 5.2%. This optimism is underpinned by the increasing utilization of glycerin in Polyether Polyols for polyurethane production, a sector experiencing robust expansion due to the demand for insulation materials and automotive components. Emerging applications in industrial chemicals and pharmaceuticals, coupled with a growing emphasis on bio-based economies, are expected to further diversify and strengthen the market's growth trajectory. The industry's ability to adapt to evolving regulatory frameworks and embrace circular economy principles will be key to its continued success.
Leading Regions, Countries, or Segments in Glycerin Industry
The Glycerin Industry landscape is dominated by key segments and regions that showcase robust growth drivers and strategic advantages. Among the grades, Refined Glycerin holds a commanding position, driven by its critical role in high-value applications. Its dominance is further amplified by the strong performance of the Personal Care and Cosmetics and Pharmaceuticals sectors, which represent over 50% of the total refined glycerin demand.
Dominant Segments:
- Refined Glycerin: This segment is the primary growth engine, owing to its high purity and extensive use in sensitive applications. The Personal Care and Cosmetics application segment alone accounts for an estimated 25% of the global glycerin market, followed closely by Pharmaceuticals at approximately 20%.
- Biodiesels Source: The substantial global production of biodiesel directly translates into a significant supply of Crude Glycerin, making this source pivotal for the overall market dynamics. Regions with strong biodiesel mandates, such as the European Union and the United States, are major contributors.
Dominant Regions:
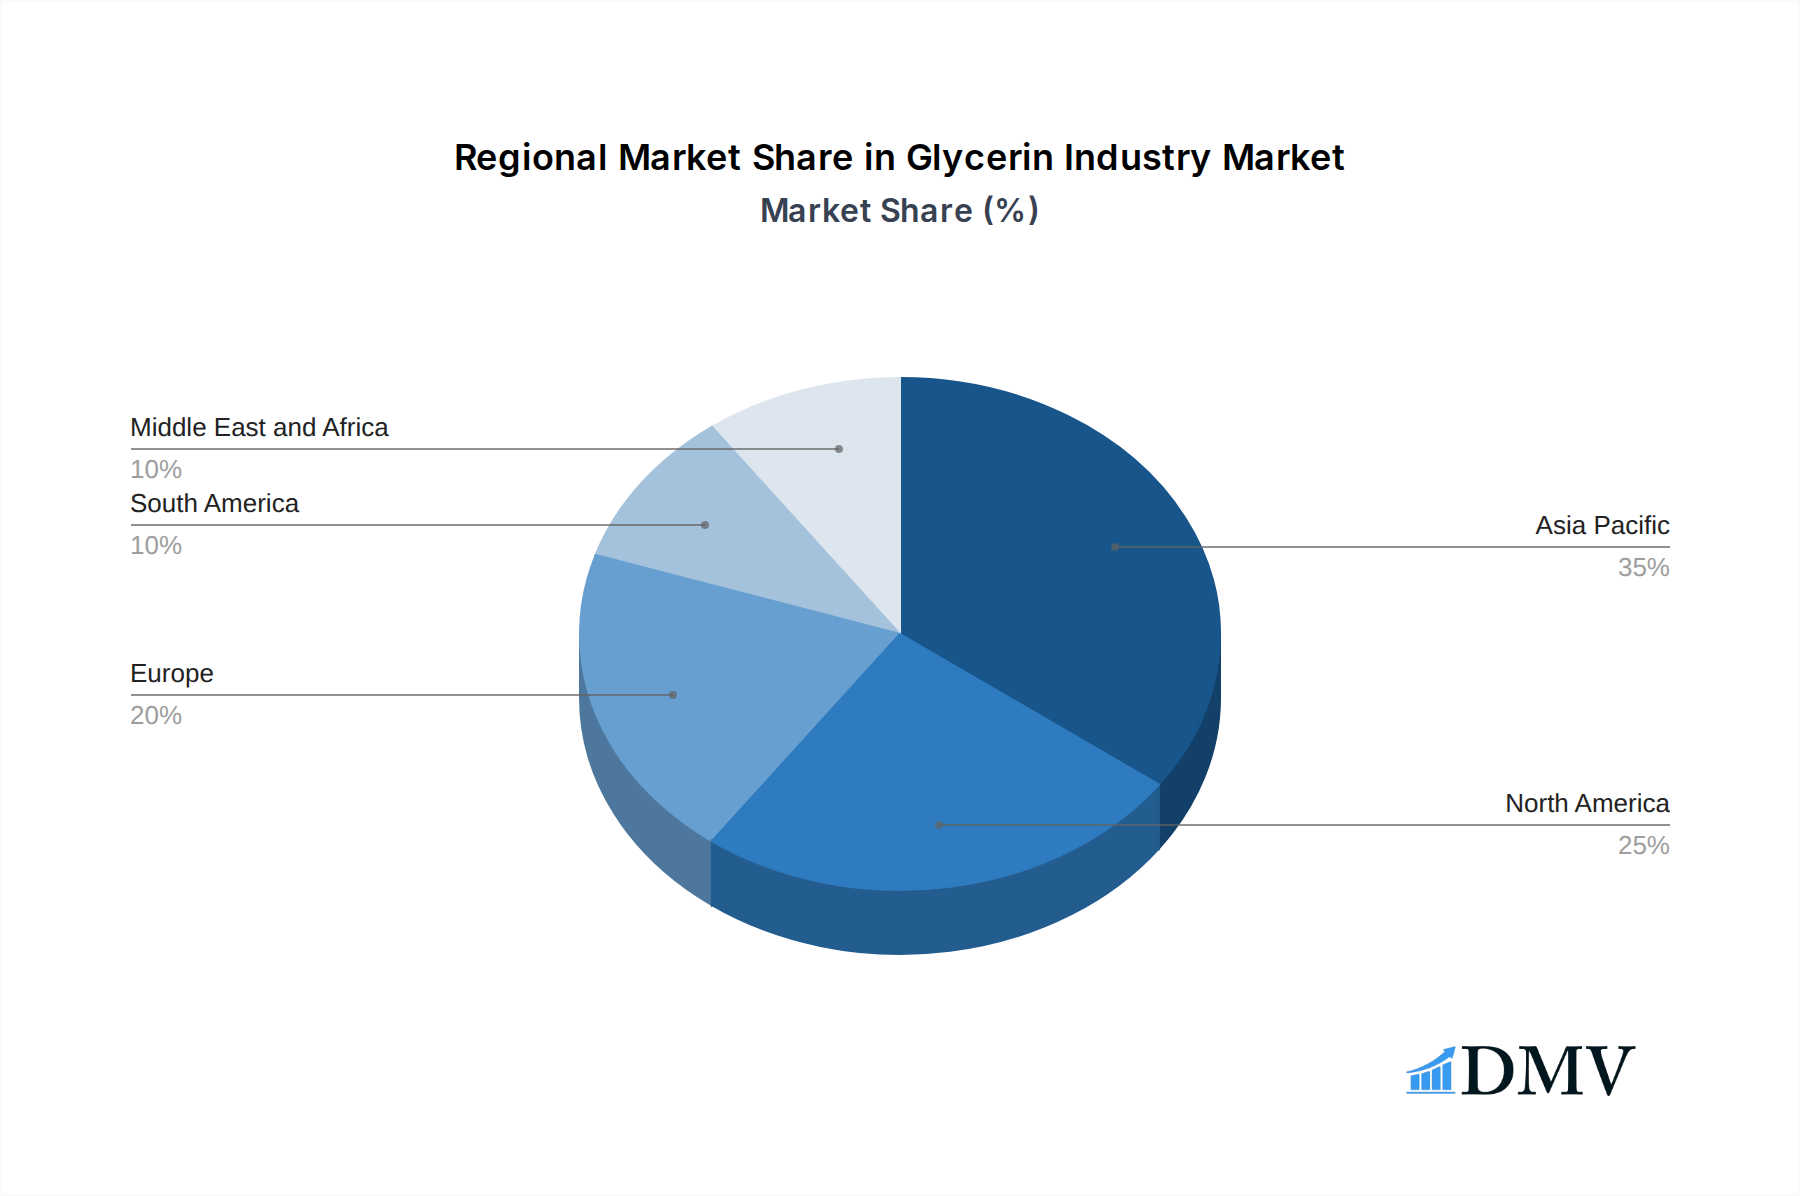
- Asia-Pacific: This region is emerging as a powerhouse, driven by rapid industrialization, a burgeoning middle class, and significant investments in manufacturing capabilities. Countries like China and India are leading the charge, fueled by strong demand in Personal Care and Cosmetics, Food and Beverage, and increasingly in Industrial Chemicals.
- Investment Trends: Substantial investments in oleochemical plants, particularly those utilizing palm and palm kernel oil, are a key driver. The construction of new plants, such as IOI Corporation Berhad's facility in Penang, with a capital expenditure of MYR 220 million, exemplifies this trend.
- Regulatory Support: Favorable government policies promoting domestic manufacturing and export are further bolstering growth.
- North America: This region remains a significant player, with the United States leading in both production and consumption. The strong presence of major chemical manufacturers and a well-established biodiesel industry are key factors.
- Application Dominance: The Food and Beverage and Industrial Chemicals sectors are particularly strong in North America.
- Technological Advancements: Continuous innovation in glycerin purification and its use in emerging applications like Polyether Polyols contribute to sustained demand.
- Asia-Pacific: This region is emerging as a powerhouse, driven by rapid industrialization, a burgeoning middle class, and significant investments in manufacturing capabilities. Countries like China and India are leading the charge, fueled by strong demand in Personal Care and Cosmetics, Food and Beverage, and increasingly in Industrial Chemicals.
Key Application Drivers:
- Personal Care and Cosmetics: The increasing consumer preference for natural ingredients and the demand for moisturizing and emollient properties in skincare and haircare products drive the consumption of refined glycerin.
- Pharmaceuticals: Glycerin's humectant, solvent, and sweetener properties make it indispensable in various pharmaceutical formulations, including syrups, capsules, and suppositories.
- Food and Beverage: Its role as a humectant, sweetener, and solvent in a wide range of food products, from baked goods to beverages, ensures consistent demand.
The interplay of these segments and regions, supported by strategic investments and evolving consumer preferences, dictates the overarching growth and market dynamics of the global glycerin industry.
Glycerin Industry Product Innovations
Product innovation in the glycerin industry centers on enhancing purity, developing novel applications, and improving sustainability. Manufacturers are continuously refining purification processes to achieve ultra-high purity glycerin for sensitive pharmaceutical and food applications. Innovations also focus on creating value-added glycerin derivatives, such as specialized esters and ethers used in advanced industrial chemicals and high-performance polymers. The development of bio-based glycerin from alternative feedstocks and the utilization of waste streams from biorefineries are also gaining traction, aligning with the growing demand for sustainable chemical solutions. These advancements not only expand glycerin's application spectrum but also enhance its performance metrics, offering improved efficacy and environmental benefits.
Propelling Factors for Glycerin Industry Growth
Several key factors are propelling the Glycerin Industry forward. The burgeoning biodiesel production worldwide continues to be a primary source of Crude Glycerin, driving supply and influencing pricing. Increasing demand from the Personal Care and Cosmetics sector, fueled by a consumer preference for natural and organic ingredients, is a significant growth catalyst for Refined Glycerin. Furthermore, the expanding applications of glycerin in Pharmaceuticals, Food and Beverage, and as a key ingredient in Polyether Polyols for polyurethane production are creating new avenues for market expansion. Advancements in refining technologies are enhancing the quality and cost-effectiveness of glycerin, making it more competitive across diverse applications. The global push towards bio-based and sustainable products also favors glycerin as a renewable resource.
Obstacles in the Glycerin Industry Market
Despite its robust growth, the Glycerin Industry faces several obstacles. Fluctuations in the price and availability of primary feedstocks, such as vegetable oils and animal fats, can impact production costs and market stability. The volatile nature of the biodiesel market, which directly influences Crude Glycerin supply, can lead to price unpredictability. Stringent regulatory requirements in the Pharmaceuticals and Food and Beverage sectors necessitate high purity standards, adding to production costs and complexity. Competition from synthetic substitutes, though less prevalent in high-volume applications, can pose a challenge in niche markets. Furthermore, logistical complexities and supply chain disruptions, particularly in the globalized market, can affect timely delivery and overall market efficiency.
Future Opportunities in Glycerin Industry
The Glycerin Industry is poised for significant future opportunities. The growing demand for sustainable and bio-based chemicals presents a substantial avenue for expansion, particularly in emerging markets and for applications in green chemistry. Innovations in advanced materials, such as biodegradable plastics and advanced composites, are creating new markets for glycerin derivatives. The increasing focus on health and wellness is likely to drive further demand in the Pharmaceuticals and Personal Care and Cosmetics sectors, with a potential for higher-value, specialized glycerin products. Furthermore, advancements in biorefinery technologies could unlock new, cost-effective sources of glycerin, enhancing its competitiveness. Exploring novel applications in areas like renewable energy storage and advanced coatings also holds considerable promise for future growth.
Major Players in the Glycerin Industry Ecosystem
- Louis Dreyfus Company
- Biodex-SA
- Musim Mas
- Cargill Incorporated
- Thai Glycerine Co Ltd
- RB FUELS
- Vantage Specialty Chemicals
- KLK OLEO
- Sebacic India Limited
- IOI Corporation Berhad
- Wilmar International Ltd
- P&G Chemicals
- Archer Daniels Midland Company
- Emery Oleochemicals
- BASF SE
- Dow
- Munzer Bioindustrie GmbH
- Godrej Industries Limited
- Oleon NV
- Vance Group Ltd
- Kao Corporation
- Aemetis
Key Developments in Glycerin Industry Industry
- December 2022: Oleochemical producer Oleon announced the acquisition of a blending plant in Conroe, Texas, investing USD 50 million. This strategic move strengthened its oleochemicals division, which includes the production of glycerin.
- October 2021: IOI Corporation Berhad announced the construction of a new 110,000 metric ton (MT) per year oleochemical plant in Prai, Penang, with a capital expenditure of MYR 220 million. The plant is designed to primarily cater to palm and palm kernel-based fatty acids and glycerine, crucial raw materials for the personal care and cosmetic products industry. The plant construction was expected to be completed by the second quarter of 2022.
Strategic Glycerin Industry Market Forecast
The strategic outlook for the Glycerin Industry is overwhelmingly positive, with a projected market expansion driven by a confluence of favorable factors. The increasing global emphasis on sustainability and the transition towards a bio-based economy will continue to elevate the demand for glycerin as a versatile, renewable resource. Significant growth is anticipated in its application for Polyether Polyols, a key component in the manufacturing of polyurethanes, which are essential in construction, automotive, and furniture industries. Furthermore, the consistent demand from the Personal Care and Cosmetics, Pharmaceuticals, and Food and Beverage sectors, driven by evolving consumer preferences for natural ingredients and functional benefits, will provide a stable foundation for growth. Technological advancements in refining and purification processes will further enhance glycerin's cost-competitiveness and broaden its application spectrum, paving the way for new market opportunities and sustained revenue generation.
Glycerin Industry Segmentation
-
1. Grade
- 1.1. Crude Glycerin
- 1.2. Refined Glycerin
-
2. Source
- 2.1. Biodiesels
- 2.2. Fatty Acids
- 2.3. Fatty Alcohols
- 2.4. Other Sources
-
3. Application
- 3.1. Pharmaceuticals
- 3.2. Food and Beverage
- 3.3. Alkyd Resins
- 3.4. Personal Care and Cosmetics
- 3.5. Industrial Chemicals
- 3.6. Polyether Polyols
- 3.7. Tobacco Humectants
- 3.8. Other Applications
Glycerin Industry Segmentation By Geography
-
1. Asia Pacific
- 1.1. China
- 1.2. India
- 1.3. Japan
- 1.4. South Korea
- 1.5. Rest of Asia Pacific
-
2. North America
- 2.1. United States
- 2.2. Canada
- 2.3. Mexico
- 2.4. Rest of North America
-
3. Europe
- 3.1. Germany
- 3.2. United Kingdom
- 3.3. Italy
- 3.4. France
- 3.5. Rest of Europe
-
4. South America
- 4.1. Brazil
- 4.2. Argentina
- 4.3. Rest of South America
-
5. Middle East and Africa
- 5.1. Saudi Arabia
- 5.2. South Africa
- 5.3. United Arab Emirates
- 5.4. Rest of Middle East and Africa
Glycerin Industry Regional Market Share
Geographic Coverage of Glycerin Industry
Glycerin Industry REPORT HIGHLIGHTS
| Aspects | Details |
|---|---|
| Study Period | 2020-2034 |
| Base Year | 2025 |
| Estimated Year | 2026 |
| Forecast Period | 2026-2034 |
| Historical Period | 2020-2025 |
| Growth Rate | CAGR of 4.5% from 2020-2034 |
| Segmentation |
|
Table of Contents
- 1. Introduction
- 1.1. Research Scope
- 1.2. Market Segmentation
- 1.3. Research Objective
- 1.4. Definitions and Assumptions
- 2. Executive Summary
- 2.1. Market Snapshot
- 3. Market Dynamics
- 3.1. Market Drivers
- 3.2. Market Restrains
- 3.3. Market Trends
- 3.4. Market Opportunities
- 4. Market Factor Analysis
- 4.1. Porters Five Forces
- 4.1.1. Bargaining Power of Suppliers
- 4.1.2. Bargaining Power of Buyers
- 4.1.3. Threat of New Entrants
- 4.1.4. Threat of Substitutes
- 4.1.5. Competitive Rivalry
- 4.2. PESTEL analysis
- 4.3. BCG Analysis
- 4.3.1. Stars (High Growth, High Market Share)
- 4.3.2. Cash Cows (Low Growth, High Market Share)
- 4.3.3. Question Mark (High Growth, Low Market Share)
- 4.3.4. Dogs (Low Growth, Low Market Share)
- 4.4. Ansoff Matrix Analysis
- 4.5. Supply Chain Analysis
- 4.6. Regulatory Landscape
- 4.7. Current Market Potential and Opportunity Assessment (TAM–SAM–SOM Framework)
- 4.8. DMV Analyst Note
- 4.1. Porters Five Forces
- 5. Market Analysis, Insights and Forecast 2021-2033
- 5.1. Market Analysis, Insights and Forecast - by Grade
- 5.1.1. Crude Glycerin
- 5.1.2. Refined Glycerin
- 5.2. Market Analysis, Insights and Forecast - by Source
- 5.2.1. Biodiesels
- 5.2.2. Fatty Acids
- 5.2.3. Fatty Alcohols
- 5.2.4. Other Sources
- 5.3. Market Analysis, Insights and Forecast - by Application
- 5.3.1. Pharmaceuticals
- 5.3.2. Food and Beverage
- 5.3.3. Alkyd Resins
- 5.3.4. Personal Care and Cosmetics
- 5.3.5. Industrial Chemicals
- 5.3.6. Polyether Polyols
- 5.3.7. Tobacco Humectants
- 5.3.8. Other Applications
- 5.4. Market Analysis, Insights and Forecast - by Region
- 5.4.1. Asia Pacific
- 5.4.2. North America
- 5.4.3. Europe
- 5.4.4. South America
- 5.4.5. Middle East and Africa
- 5.1. Market Analysis, Insights and Forecast - by Grade
- 6. Global Glycerin Industry Analysis, Insights and Forecast, 2021-2033
- 6.1. Market Analysis, Insights and Forecast - by Grade
- 6.1.1. Crude Glycerin
- 6.1.2. Refined Glycerin
- 6.2. Market Analysis, Insights and Forecast - by Source
- 6.2.1. Biodiesels
- 6.2.2. Fatty Acids
- 6.2.3. Fatty Alcohols
- 6.2.4. Other Sources
- 6.3. Market Analysis, Insights and Forecast - by Application
- 6.3.1. Pharmaceuticals
- 6.3.2. Food and Beverage
- 6.3.3. Alkyd Resins
- 6.3.4. Personal Care and Cosmetics
- 6.3.5. Industrial Chemicals
- 6.3.6. Polyether Polyols
- 6.3.7. Tobacco Humectants
- 6.3.8. Other Applications
- 6.1. Market Analysis, Insights and Forecast - by Grade
- 7. Asia Pacific Glycerin Industry Analysis, Insights and Forecast, 2020-2032
- 7.1. Market Analysis, Insights and Forecast - by Grade
- 7.1.1. Crude Glycerin
- 7.1.2. Refined Glycerin
- 7.2. Market Analysis, Insights and Forecast - by Source
- 7.2.1. Biodiesels
- 7.2.2. Fatty Acids
- 7.2.3. Fatty Alcohols
- 7.2.4. Other Sources
- 7.3. Market Analysis, Insights and Forecast - by Application
- 7.3.1. Pharmaceuticals
- 7.3.2. Food and Beverage
- 7.3.3. Alkyd Resins
- 7.3.4. Personal Care and Cosmetics
- 7.3.5. Industrial Chemicals
- 7.3.6. Polyether Polyols
- 7.3.7. Tobacco Humectants
- 7.3.8. Other Applications
- 7.1. Market Analysis, Insights and Forecast - by Grade
- 8. North America Glycerin Industry Analysis, Insights and Forecast, 2020-2032
- 8.1. Market Analysis, Insights and Forecast - by Grade
- 8.1.1. Crude Glycerin
- 8.1.2. Refined Glycerin
- 8.2. Market Analysis, Insights and Forecast - by Source
- 8.2.1. Biodiesels
- 8.2.2. Fatty Acids
- 8.2.3. Fatty Alcohols
- 8.2.4. Other Sources
- 8.3. Market Analysis, Insights and Forecast - by Application
- 8.3.1. Pharmaceuticals
- 8.3.2. Food and Beverage
- 8.3.3. Alkyd Resins
- 8.3.4. Personal Care and Cosmetics
- 8.3.5. Industrial Chemicals
- 8.3.6. Polyether Polyols
- 8.3.7. Tobacco Humectants
- 8.3.8. Other Applications
- 8.1. Market Analysis, Insights and Forecast - by Grade
- 9. Europe Glycerin Industry Analysis, Insights and Forecast, 2020-2032
- 9.1. Market Analysis, Insights and Forecast - by Grade
- 9.1.1. Crude Glycerin
- 9.1.2. Refined Glycerin
- 9.2. Market Analysis, Insights and Forecast - by Source
- 9.2.1. Biodiesels
- 9.2.2. Fatty Acids
- 9.2.3. Fatty Alcohols
- 9.2.4. Other Sources
- 9.3. Market Analysis, Insights and Forecast - by Application
- 9.3.1. Pharmaceuticals
- 9.3.2. Food and Beverage
- 9.3.3. Alkyd Resins
- 9.3.4. Personal Care and Cosmetics
- 9.3.5. Industrial Chemicals
- 9.3.6. Polyether Polyols
- 9.3.7. Tobacco Humectants
- 9.3.8. Other Applications
- 9.1. Market Analysis, Insights and Forecast - by Grade
- 10. South America Glycerin Industry Analysis, Insights and Forecast, 2020-2032
- 10.1. Market Analysis, Insights and Forecast - by Grade
- 10.1.1. Crude Glycerin
- 10.1.2. Refined Glycerin
- 10.2. Market Analysis, Insights and Forecast - by Source
- 10.2.1. Biodiesels
- 10.2.2. Fatty Acids
- 10.2.3. Fatty Alcohols
- 10.2.4. Other Sources
- 10.3. Market Analysis, Insights and Forecast - by Application
- 10.3.1. Pharmaceuticals
- 10.3.2. Food and Beverage
- 10.3.3. Alkyd Resins
- 10.3.4. Personal Care and Cosmetics
- 10.3.5. Industrial Chemicals
- 10.3.6. Polyether Polyols
- 10.3.7. Tobacco Humectants
- 10.3.8. Other Applications
- 10.1. Market Analysis, Insights and Forecast - by Grade
- 11. Middle East and Africa Glycerin Industry Analysis, Insights and Forecast, 2020-2032
- 11.1. Market Analysis, Insights and Forecast - by Grade
- 11.1.1. Crude Glycerin
- 11.1.2. Refined Glycerin
- 11.2. Market Analysis, Insights and Forecast - by Source
- 11.2.1. Biodiesels
- 11.2.2. Fatty Acids
- 11.2.3. Fatty Alcohols
- 11.2.4. Other Sources
- 11.3. Market Analysis, Insights and Forecast - by Application
- 11.3.1. Pharmaceuticals
- 11.3.2. Food and Beverage
- 11.3.3. Alkyd Resins
- 11.3.4. Personal Care and Cosmetics
- 11.3.5. Industrial Chemicals
- 11.3.6. Polyether Polyols
- 11.3.7. Tobacco Humectants
- 11.3.8. Other Applications
- 11.1. Market Analysis, Insights and Forecast - by Grade
- 12. Competitive Analysis
- 12.1. Company Profiles
- 12.1.1 Louis Dreyfus Company
- 12.1.1.1. Company Overview
- 12.1.1.2. Products
- 12.1.1.3. Company Financials
- 12.1.1.4. SWOT Analysis
- 12.1.2 Biodex-SA
- 12.1.2.1. Company Overview
- 12.1.2.2. Products
- 12.1.2.3. Company Financials
- 12.1.2.4. SWOT Analysis
- 12.1.3 Musim Mas
- 12.1.3.1. Company Overview
- 12.1.3.2. Products
- 12.1.3.3. Company Financials
- 12.1.3.4. SWOT Analysis
- 12.1.4 Cargill Incorporated
- 12.1.4.1. Company Overview
- 12.1.4.2. Products
- 12.1.4.3. Company Financials
- 12.1.4.4. SWOT Analysis
- 12.1.5 Thai Glycerine Co Ltd
- 12.1.5.1. Company Overview
- 12.1.5.2. Products
- 12.1.5.3. Company Financials
- 12.1.5.4. SWOT Analysis
- 12.1.6 RB FUELS
- 12.1.6.1. Company Overview
- 12.1.6.2. Products
- 12.1.6.3. Company Financials
- 12.1.6.4. SWOT Analysis
- 12.1.7 Vantage Specialty Chemicals
- 12.1.7.1. Company Overview
- 12.1.7.2. Products
- 12.1.7.3. Company Financials
- 12.1.7.4. SWOT Analysis
- 12.1.8 KLK OLEO
- 12.1.8.1. Company Overview
- 12.1.8.2. Products
- 12.1.8.3. Company Financials
- 12.1.8.4. SWOT Analysis
- 12.1.9 Sebacic India Limited
- 12.1.9.1. Company Overview
- 12.1.9.2. Products
- 12.1.9.3. Company Financials
- 12.1.9.4. SWOT Analysis
- 12.1.10 IOI Corporation Berhad
- 12.1.10.1. Company Overview
- 12.1.10.2. Products
- 12.1.10.3. Company Financials
- 12.1.10.4. SWOT Analysis
- 12.1.11 Wilmar International Ltd
- 12.1.11.1. Company Overview
- 12.1.11.2. Products
- 12.1.11.3. Company Financials
- 12.1.11.4. SWOT Analysis
- 12.1.12 P&G Chemicals
- 12.1.12.1. Company Overview
- 12.1.12.2. Products
- 12.1.12.3. Company Financials
- 12.1.12.4. SWOT Analysis
- 12.1.13 Archer Daniels Midland Company
- 12.1.13.1. Company Overview
- 12.1.13.2. Products
- 12.1.13.3. Company Financials
- 12.1.13.4. SWOT Analysis
- 12.1.14 Emery Oleochemicals
- 12.1.14.1. Company Overview
- 12.1.14.2. Products
- 12.1.14.3. Company Financials
- 12.1.14.4. SWOT Analysis
- 12.1.15 BASF SE
- 12.1.15.1. Company Overview
- 12.1.15.2. Products
- 12.1.15.3. Company Financials
- 12.1.15.4. SWOT Analysis
- 12.1.16 Dow
- 12.1.16.1. Company Overview
- 12.1.16.2. Products
- 12.1.16.3. Company Financials
- 12.1.16.4. SWOT Analysis
- 12.1.17 Munzer Bioindustrie GmbH
- 12.1.17.1. Company Overview
- 12.1.17.2. Products
- 12.1.17.3. Company Financials
- 12.1.17.4. SWOT Analysis
- 12.1.18 Godrej Industries Limited
- 12.1.18.1. Company Overview
- 12.1.18.2. Products
- 12.1.18.3. Company Financials
- 12.1.18.4. SWOT Analysis
- 12.1.19 Oleon NV
- 12.1.19.1. Company Overview
- 12.1.19.2. Products
- 12.1.19.3. Company Financials
- 12.1.19.4. SWOT Analysis
- 12.1.20 Vance Group Ltd
- 12.1.20.1. Company Overview
- 12.1.20.2. Products
- 12.1.20.3. Company Financials
- 12.1.20.4. SWOT Analysis
- 12.1.21 Kao Corporation
- 12.1.21.1. Company Overview
- 12.1.21.2. Products
- 12.1.21.3. Company Financials
- 12.1.21.4. SWOT Analysis
- 12.1.22 Aemetis
- 12.1.22.1. Company Overview
- 12.1.22.2. Products
- 12.1.22.3. Company Financials
- 12.1.22.4. SWOT Analysis
- 12.1.1 Louis Dreyfus Company
- 12.2. Market Entropy
- 12.2.1 Company's Key Areas Served
- 12.2.2 Recent Developments
- 12.3. Company Market Share Analysis 2025
- 12.3.1 Top 5 Companies Market Share Analysis
- 12.3.2 Top 3 Companies Market Share Analysis
- 12.4. List of Potential Customers
- 13. Research Methodology
List of Figures
- Figure 1: Global Glycerin Industry Revenue Breakdown (million, %) by Region 2025 & 2033
- Figure 2: Global Glycerin Industry Volume Breakdown (K Tons, %) by Region 2025 & 2033
- Figure 3: Asia Pacific Glycerin Industry Revenue (million), by Grade 2025 & 2033
- Figure 4: Asia Pacific Glycerin Industry Volume (K Tons), by Grade 2025 & 2033
- Figure 5: Asia Pacific Glycerin Industry Revenue Share (%), by Grade 2025 & 2033
- Figure 6: Asia Pacific Glycerin Industry Volume Share (%), by Grade 2025 & 2033
- Figure 7: Asia Pacific Glycerin Industry Revenue (million), by Source 2025 & 2033
- Figure 8: Asia Pacific Glycerin Industry Volume (K Tons), by Source 2025 & 2033
- Figure 9: Asia Pacific Glycerin Industry Revenue Share (%), by Source 2025 & 2033
- Figure 10: Asia Pacific Glycerin Industry Volume Share (%), by Source 2025 & 2033
- Figure 11: Asia Pacific Glycerin Industry Revenue (million), by Application 2025 & 2033
- Figure 12: Asia Pacific Glycerin Industry Volume (K Tons), by Application 2025 & 2033
- Figure 13: Asia Pacific Glycerin Industry Revenue Share (%), by Application 2025 & 2033
- Figure 14: Asia Pacific Glycerin Industry Volume Share (%), by Application 2025 & 2033
- Figure 15: Asia Pacific Glycerin Industry Revenue (million), by Country 2025 & 2033
- Figure 16: Asia Pacific Glycerin Industry Volume (K Tons), by Country 2025 & 2033
- Figure 17: Asia Pacific Glycerin Industry Revenue Share (%), by Country 2025 & 2033
- Figure 18: Asia Pacific Glycerin Industry Volume Share (%), by Country 2025 & 2033
- Figure 19: North America Glycerin Industry Revenue (million), by Grade 2025 & 2033
- Figure 20: North America Glycerin Industry Volume (K Tons), by Grade 2025 & 2033
- Figure 21: North America Glycerin Industry Revenue Share (%), by Grade 2025 & 2033
- Figure 22: North America Glycerin Industry Volume Share (%), by Grade 2025 & 2033
- Figure 23: North America Glycerin Industry Revenue (million), by Source 2025 & 2033
- Figure 24: North America Glycerin Industry Volume (K Tons), by Source 2025 & 2033
- Figure 25: North America Glycerin Industry Revenue Share (%), by Source 2025 & 2033
- Figure 26: North America Glycerin Industry Volume Share (%), by Source 2025 & 2033
- Figure 27: North America Glycerin Industry Revenue (million), by Application 2025 & 2033
- Figure 28: North America Glycerin Industry Volume (K Tons), by Application 2025 & 2033
- Figure 29: North America Glycerin Industry Revenue Share (%), by Application 2025 & 2033
- Figure 30: North America Glycerin Industry Volume Share (%), by Application 2025 & 2033
- Figure 31: North America Glycerin Industry Revenue (million), by Country 2025 & 2033
- Figure 32: North America Glycerin Industry Volume (K Tons), by Country 2025 & 2033
- Figure 33: North America Glycerin Industry Revenue Share (%), by Country 2025 & 2033
- Figure 34: North America Glycerin Industry Volume Share (%), by Country 2025 & 2033
- Figure 35: Europe Glycerin Industry Revenue (million), by Grade 2025 & 2033
- Figure 36: Europe Glycerin Industry Volume (K Tons), by Grade 2025 & 2033
- Figure 37: Europe Glycerin Industry Revenue Share (%), by Grade 2025 & 2033
- Figure 38: Europe Glycerin Industry Volume Share (%), by Grade 2025 & 2033
- Figure 39: Europe Glycerin Industry Revenue (million), by Source 2025 & 2033
- Figure 40: Europe Glycerin Industry Volume (K Tons), by Source 2025 & 2033
- Figure 41: Europe Glycerin Industry Revenue Share (%), by Source 2025 & 2033
- Figure 42: Europe Glycerin Industry Volume Share (%), by Source 2025 & 2033
- Figure 43: Europe Glycerin Industry Revenue (million), by Application 2025 & 2033
- Figure 44: Europe Glycerin Industry Volume (K Tons), by Application 2025 & 2033
- Figure 45: Europe Glycerin Industry Revenue Share (%), by Application 2025 & 2033
- Figure 46: Europe Glycerin Industry Volume Share (%), by Application 2025 & 2033
- Figure 47: Europe Glycerin Industry Revenue (million), by Country 2025 & 2033
- Figure 48: Europe Glycerin Industry Volume (K Tons), by Country 2025 & 2033
- Figure 49: Europe Glycerin Industry Revenue Share (%), by Country 2025 & 2033
- Figure 50: Europe Glycerin Industry Volume Share (%), by Country 2025 & 2033
- Figure 51: South America Glycerin Industry Revenue (million), by Grade 2025 & 2033
- Figure 52: South America Glycerin Industry Volume (K Tons), by Grade 2025 & 2033
- Figure 53: South America Glycerin Industry Revenue Share (%), by Grade 2025 & 2033
- Figure 54: South America Glycerin Industry Volume Share (%), by Grade 2025 & 2033
- Figure 55: South America Glycerin Industry Revenue (million), by Source 2025 & 2033
- Figure 56: South America Glycerin Industry Volume (K Tons), by Source 2025 & 2033
- Figure 57: South America Glycerin Industry Revenue Share (%), by Source 2025 & 2033
- Figure 58: South America Glycerin Industry Volume Share (%), by Source 2025 & 2033
- Figure 59: South America Glycerin Industry Revenue (million), by Application 2025 & 2033
- Figure 60: South America Glycerin Industry Volume (K Tons), by Application 2025 & 2033
- Figure 61: South America Glycerin Industry Revenue Share (%), by Application 2025 & 2033
- Figure 62: South America Glycerin Industry Volume Share (%), by Application 2025 & 2033
- Figure 63: South America Glycerin Industry Revenue (million), by Country 2025 & 2033
- Figure 64: South America Glycerin Industry Volume (K Tons), by Country 2025 & 2033
- Figure 65: South America Glycerin Industry Revenue Share (%), by Country 2025 & 2033
- Figure 66: South America Glycerin Industry Volume Share (%), by Country 2025 & 2033
- Figure 67: Middle East and Africa Glycerin Industry Revenue (million), by Grade 2025 & 2033
- Figure 68: Middle East and Africa Glycerin Industry Volume (K Tons), by Grade 2025 & 2033
- Figure 69: Middle East and Africa Glycerin Industry Revenue Share (%), by Grade 2025 & 2033
- Figure 70: Middle East and Africa Glycerin Industry Volume Share (%), by Grade 2025 & 2033
- Figure 71: Middle East and Africa Glycerin Industry Revenue (million), by Source 2025 & 2033
- Figure 72: Middle East and Africa Glycerin Industry Volume (K Tons), by Source 2025 & 2033
- Figure 73: Middle East and Africa Glycerin Industry Revenue Share (%), by Source 2025 & 2033
- Figure 74: Middle East and Africa Glycerin Industry Volume Share (%), by Source 2025 & 2033
- Figure 75: Middle East and Africa Glycerin Industry Revenue (million), by Application 2025 & 2033
- Figure 76: Middle East and Africa Glycerin Industry Volume (K Tons), by Application 2025 & 2033
- Figure 77: Middle East and Africa Glycerin Industry Revenue Share (%), by Application 2025 & 2033
- Figure 78: Middle East and Africa Glycerin Industry Volume Share (%), by Application 2025 & 2033
- Figure 79: Middle East and Africa Glycerin Industry Revenue (million), by Country 2025 & 2033
- Figure 80: Middle East and Africa Glycerin Industry Volume (K Tons), by Country 2025 & 2033
- Figure 81: Middle East and Africa Glycerin Industry Revenue Share (%), by Country 2025 & 2033
- Figure 82: Middle East and Africa Glycerin Industry Volume Share (%), by Country 2025 & 2033
List of Tables
- Table 1: Global Glycerin Industry Revenue million Forecast, by Grade 2020 & 2033
- Table 2: Global Glycerin Industry Volume K Tons Forecast, by Grade 2020 & 2033
- Table 3: Global Glycerin Industry Revenue million Forecast, by Source 2020 & 2033
- Table 4: Global Glycerin Industry Volume K Tons Forecast, by Source 2020 & 2033
- Table 5: Global Glycerin Industry Revenue million Forecast, by Application 2020 & 2033
- Table 6: Global Glycerin Industry Volume K Tons Forecast, by Application 2020 & 2033
- Table 7: Global Glycerin Industry Revenue million Forecast, by Region 2020 & 2033
- Table 8: Global Glycerin Industry Volume K Tons Forecast, by Region 2020 & 2033
- Table 9: Global Glycerin Industry Revenue million Forecast, by Grade 2020 & 2033
- Table 10: Global Glycerin Industry Volume K Tons Forecast, by Grade 2020 & 2033
- Table 11: Global Glycerin Industry Revenue million Forecast, by Source 2020 & 2033
- Table 12: Global Glycerin Industry Volume K Tons Forecast, by Source 2020 & 2033
- Table 13: Global Glycerin Industry Revenue million Forecast, by Application 2020 & 2033
- Table 14: Global Glycerin Industry Volume K Tons Forecast, by Application 2020 & 2033
- Table 15: Global Glycerin Industry Revenue million Forecast, by Country 2020 & 2033
- Table 16: Global Glycerin Industry Volume K Tons Forecast, by Country 2020 & 2033
- Table 17: China Glycerin Industry Revenue (million) Forecast, by Application 2020 & 2033
- Table 18: China Glycerin Industry Volume (K Tons) Forecast, by Application 2020 & 2033
- Table 19: India Glycerin Industry Revenue (million) Forecast, by Application 2020 & 2033
- Table 20: India Glycerin Industry Volume (K Tons) Forecast, by Application 2020 & 2033
- Table 21: Japan Glycerin Industry Revenue (million) Forecast, by Application 2020 & 2033
- Table 22: Japan Glycerin Industry Volume (K Tons) Forecast, by Application 2020 & 2033
- Table 23: South Korea Glycerin Industry Revenue (million) Forecast, by Application 2020 & 2033
- Table 24: South Korea Glycerin Industry Volume (K Tons) Forecast, by Application 2020 & 2033
- Table 25: Rest of Asia Pacific Glycerin Industry Revenue (million) Forecast, by Application 2020 & 2033
- Table 26: Rest of Asia Pacific Glycerin Industry Volume (K Tons) Forecast, by Application 2020 & 2033
- Table 27: Global Glycerin Industry Revenue million Forecast, by Grade 2020 & 2033
- Table 28: Global Glycerin Industry Volume K Tons Forecast, by Grade 2020 & 2033
- Table 29: Global Glycerin Industry Revenue million Forecast, by Source 2020 & 2033
- Table 30: Global Glycerin Industry Volume K Tons Forecast, by Source 2020 & 2033
- Table 31: Global Glycerin Industry Revenue million Forecast, by Application 2020 & 2033
- Table 32: Global Glycerin Industry Volume K Tons Forecast, by Application 2020 & 2033
- Table 33: Global Glycerin Industry Revenue million Forecast, by Country 2020 & 2033
- Table 34: Global Glycerin Industry Volume K Tons Forecast, by Country 2020 & 2033
- Table 35: United States Glycerin Industry Revenue (million) Forecast, by Application 2020 & 2033
- Table 36: United States Glycerin Industry Volume (K Tons) Forecast, by Application 2020 & 2033
- Table 37: Canada Glycerin Industry Revenue (million) Forecast, by Application 2020 & 2033
- Table 38: Canada Glycerin Industry Volume (K Tons) Forecast, by Application 2020 & 2033
- Table 39: Mexico Glycerin Industry Revenue (million) Forecast, by Application 2020 & 2033
- Table 40: Mexico Glycerin Industry Volume (K Tons) Forecast, by Application 2020 & 2033
- Table 41: Rest of North America Glycerin Industry Revenue (million) Forecast, by Application 2020 & 2033
- Table 42: Rest of North America Glycerin Industry Volume (K Tons) Forecast, by Application 2020 & 2033
- Table 43: Global Glycerin Industry Revenue million Forecast, by Grade 2020 & 2033
- Table 44: Global Glycerin Industry Volume K Tons Forecast, by Grade 2020 & 2033
- Table 45: Global Glycerin Industry Revenue million Forecast, by Source 2020 & 2033
- Table 46: Global Glycerin Industry Volume K Tons Forecast, by Source 2020 & 2033
- Table 47: Global Glycerin Industry Revenue million Forecast, by Application 2020 & 2033
- Table 48: Global Glycerin Industry Volume K Tons Forecast, by Application 2020 & 2033
- Table 49: Global Glycerin Industry Revenue million Forecast, by Country 2020 & 2033
- Table 50: Global Glycerin Industry Volume K Tons Forecast, by Country 2020 & 2033
- Table 51: Germany Glycerin Industry Revenue (million) Forecast, by Application 2020 & 2033
- Table 52: Germany Glycerin Industry Volume (K Tons) Forecast, by Application 2020 & 2033
- Table 53: United Kingdom Glycerin Industry Revenue (million) Forecast, by Application 2020 & 2033
- Table 54: United Kingdom Glycerin Industry Volume (K Tons) Forecast, by Application 2020 & 2033
- Table 55: Italy Glycerin Industry Revenue (million) Forecast, by Application 2020 & 2033
- Table 56: Italy Glycerin Industry Volume (K Tons) Forecast, by Application 2020 & 2033
- Table 57: France Glycerin Industry Revenue (million) Forecast, by Application 2020 & 2033
- Table 58: France Glycerin Industry Volume (K Tons) Forecast, by Application 2020 & 2033
- Table 59: Rest of Europe Glycerin Industry Revenue (million) Forecast, by Application 2020 & 2033
- Table 60: Rest of Europe Glycerin Industry Volume (K Tons) Forecast, by Application 2020 & 2033
- Table 61: Global Glycerin Industry Revenue million Forecast, by Grade 2020 & 2033
- Table 62: Global Glycerin Industry Volume K Tons Forecast, by Grade 2020 & 2033
- Table 63: Global Glycerin Industry Revenue million Forecast, by Source 2020 & 2033
- Table 64: Global Glycerin Industry Volume K Tons Forecast, by Source 2020 & 2033
- Table 65: Global Glycerin Industry Revenue million Forecast, by Application 2020 & 2033
- Table 66: Global Glycerin Industry Volume K Tons Forecast, by Application 2020 & 2033
- Table 67: Global Glycerin Industry Revenue million Forecast, by Country 2020 & 2033
- Table 68: Global Glycerin Industry Volume K Tons Forecast, by Country 2020 & 2033
- Table 69: Brazil Glycerin Industry Revenue (million) Forecast, by Application 2020 & 2033
- Table 70: Brazil Glycerin Industry Volume (K Tons) Forecast, by Application 2020 & 2033
- Table 71: Argentina Glycerin Industry Revenue (million) Forecast, by Application 2020 & 2033
- Table 72: Argentina Glycerin Industry Volume (K Tons) Forecast, by Application 2020 & 2033
- Table 73: Rest of South America Glycerin Industry Revenue (million) Forecast, by Application 2020 & 2033
- Table 74: Rest of South America Glycerin Industry Volume (K Tons) Forecast, by Application 2020 & 2033
- Table 75: Global Glycerin Industry Revenue million Forecast, by Grade 2020 & 2033
- Table 76: Global Glycerin Industry Volume K Tons Forecast, by Grade 2020 & 2033
- Table 77: Global Glycerin Industry Revenue million Forecast, by Source 2020 & 2033
- Table 78: Global Glycerin Industry Volume K Tons Forecast, by Source 2020 & 2033
- Table 79: Global Glycerin Industry Revenue million Forecast, by Application 2020 & 2033
- Table 80: Global Glycerin Industry Volume K Tons Forecast, by Application 2020 & 2033
- Table 81: Global Glycerin Industry Revenue million Forecast, by Country 2020 & 2033
- Table 82: Global Glycerin Industry Volume K Tons Forecast, by Country 2020 & 2033
- Table 83: Saudi Arabia Glycerin Industry Revenue (million) Forecast, by Application 2020 & 2033
- Table 84: Saudi Arabia Glycerin Industry Volume (K Tons) Forecast, by Application 2020 & 2033
- Table 85: South Africa Glycerin Industry Revenue (million) Forecast, by Application 2020 & 2033
- Table 86: South Africa Glycerin Industry Volume (K Tons) Forecast, by Application 2020 & 2033
- Table 87: United Arab Emirates Glycerin Industry Revenue (million) Forecast, by Application 2020 & 2033
- Table 88: United Arab Emirates Glycerin Industry Volume (K Tons) Forecast, by Application 2020 & 2033
- Table 89: Rest of Middle East and Africa Glycerin Industry Revenue (million) Forecast, by Application 2020 & 2033
- Table 90: Rest of Middle East and Africa Glycerin Industry Volume (K Tons) Forecast, by Application 2020 & 2033
Frequently Asked Questions
1. What is the projected Compound Annual Growth Rate (CAGR) of the Glycerin Industry?
The projected CAGR is approximately 4.5%.
2. Which companies are prominent players in the Glycerin Industry?
Key companies in the market include Louis Dreyfus Company, Biodex-SA, Musim Mas, Cargill Incorporated, Thai Glycerine Co Ltd, RB FUELS, Vantage Specialty Chemicals, KLK OLEO, Sebacic India Limited, IOI Corporation Berhad, Wilmar International Ltd, P&G Chemicals, Archer Daniels Midland Company, Emery Oleochemicals, BASF SE, Dow, Munzer Bioindustrie GmbH, Godrej Industries Limited, Oleon NV, Vance Group Ltd, Kao Corporation, Aemetis.
3. What are the main segments of the Glycerin Industry?
The market segments include Grade, Source, Application.
4. Can you provide details about the market size?
The market size is estimated to be USD 4.78 million as of 2022.
5. What are some drivers contributing to market growth?
Strong Demand from the Pharmaceutical Industry; Increasing Use in the Personal Care and Cosmetics Industries.
6. What are the notable trends driving market growth?
Personal Care and Cosmetics Application to Dominate the Market Growth.
7. Are there any restraints impacting market growth?
Availability of Substitutes; Other Restraints.
8. Can you provide examples of recent developments in the market?
In December 2022, Oleochemical producer Oleon announced the acquisition of a blending plant in Conroe, Texas, by investing USD 50 million. The company strengthened its oleochemicals division which includes the production of glycerin.
9. What pricing options are available for accessing the report?
Pricing options include single-user, multi-user, and enterprise licenses priced at USD 4750, USD 5250, and USD 8750 respectively.
10. Is the market size provided in terms of value or volume?
The market size is provided in terms of value, measured in million and volume, measured in K Tons.
11. Are there any specific market keywords associated with the report?
Yes, the market keyword associated with the report is "Glycerin Industry," which aids in identifying and referencing the specific market segment covered.
12. How do I determine which pricing option suits my needs best?
The pricing options vary based on user requirements and access needs. Individual users may opt for single-user licenses, while businesses requiring broader access may choose multi-user or enterprise licenses for cost-effective access to the report.
13. Are there any additional resources or data provided in the Glycerin Industry report?
While the report offers comprehensive insights, it's advisable to review the specific contents or supplementary materials provided to ascertain if additional resources or data are available.
14. How can I stay updated on further developments or reports in the Glycerin Industry?
To stay informed about further developments, trends, and reports in the Glycerin Industry, consider subscribing to industry newsletters, following relevant companies and organizations, or regularly checking reputable industry news sources and publications.
Methodology
Step 1 - Identification of Relevant Samples Size from Population Database


Step 2 - Approaches for Defining Global Market Size (Value, Volume* & Price*)

Note*: In applicable scenarios
Step 3 - Data Sources
Primary Research
- Web Analytics
- Survey Reports
- Research Institute
- Latest Research Reports
- Opinion Leaders
Secondary Research
- Annual Reports
- White Paper
- Latest Press Release
- Industry Association
- Paid Database
- Investor Presentations

Step 4 - Data Triangulation
Involves using different sources of information in order to increase the validity of a study
These sources are likely to be stakeholders in a program - participants, other researchers, program staff, other community members, and so on.
Then we put all data in single framework & apply various statistical tools to find out the dynamic on the market.
During the analysis stage, feedback from the stakeholder groups would be compared to determine areas of agreement as well as areas of divergence