

Key Insights
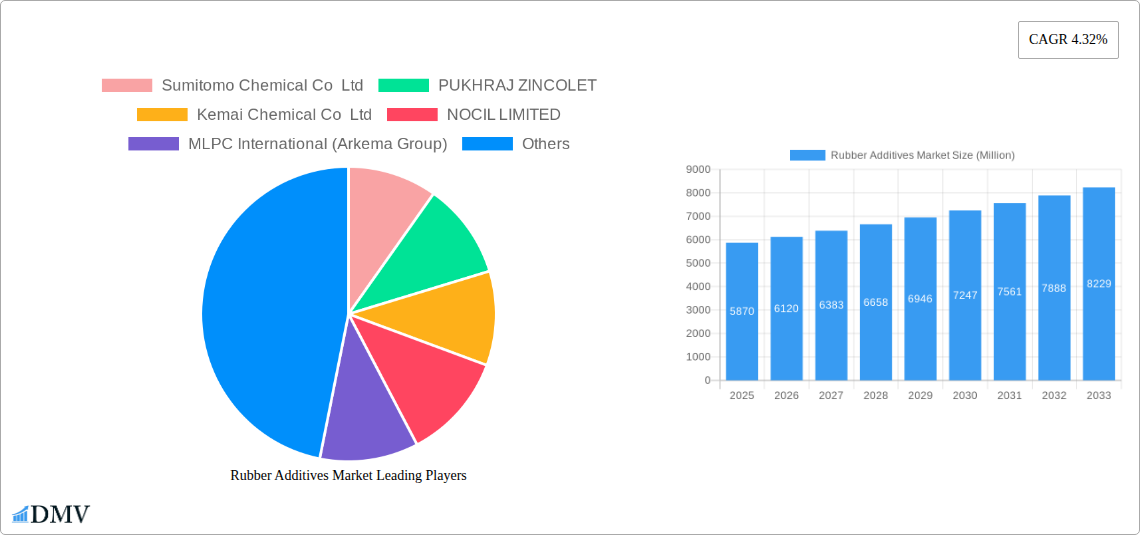
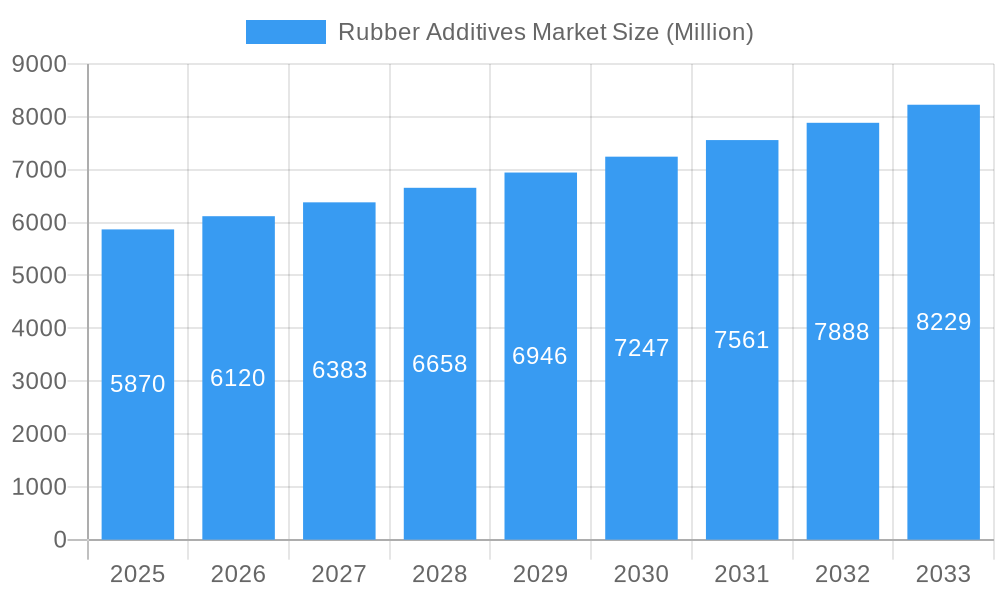
The global rubber additives market, valued at $5.87 billion in 2025, is projected to experience robust growth, driven by the burgeoning automotive and construction industries. A compound annual growth rate (CAGR) of 4.32% from 2025 to 2033 indicates a significant expansion, reaching an estimated value exceeding $8 billion by 2033. Key drivers include increasing demand for high-performance tires with enhanced durability and fuel efficiency, a rise in infrastructure development projects necessitating durable conveyor belts and other rubber products, and the growing adoption of electric vehicles, which rely on specialized rubber components for insulation and protection. Market segmentation reveals strong performance across various additive types, with activators, vulcanization inhibitors, and plasticizers leading the way. Similarly, applications such as tires, conveyor belts, and electric cables dominate market share. The use of fillers like carbon black, calcium carbonate, and silica further contributes to market growth. Geographical analysis indicates strong growth in the Asia-Pacific region, particularly in China and India, fueled by rapid industrialization and increased manufacturing activities. However, factors such as fluctuating raw material prices and stringent environmental regulations present challenges to sustained market expansion. Leading players, including Sumitomo Chemical, BASF, and Lanxess, are actively engaged in research and development to introduce innovative products and strengthen their market positions. The competitive landscape is characterized by both established multinational corporations and regional players, driving innovation and price competitiveness.
Rubber Additives Market Market Size (In Billion)
The market's future trajectory is influenced by several factors. Continued technological advancements in rubber compounding techniques, along with increased focus on sustainable and eco-friendly additives, are likely to shape future growth. Furthermore, the rising demand for specialized rubber products in emerging economies presents significant growth opportunities. Companies are increasingly focusing on strategic partnerships, mergers, and acquisitions to expand their product portfolio and geographical reach. Government initiatives promoting sustainable manufacturing practices and investments in infrastructure projects are also expected to contribute to market expansion. Despite potential challenges from economic fluctuations and supply chain disruptions, the long-term outlook for the rubber additives market remains positive, with strong growth potential across diverse segments and geographical regions.
Rubber Additives Market Company Market Share
Rubber Additives Market: A Comprehensive Report (2019-2033)
This insightful report provides a detailed analysis of the global Rubber Additives Market, offering a comprehensive overview of market trends, leading players, and future growth prospects. The study period covers 2019-2033, with 2025 as the base and estimated year. The report is essential for stakeholders seeking to understand the market dynamics and make informed business decisions. The market is projected to reach xx Million by 2033, exhibiting a CAGR of xx% during the forecast period (2025-2033).
Rubber Additives Market Composition & Trends
This section delves into the intricate composition of the Rubber Additives Market, analyzing its concentration, innovation drivers, regulatory environment, substitute products, end-user profiles, and mergers & acquisitions (M&A) activities. The market exhibits a moderately fragmented landscape, with key players such as Sumitomo Chemical Co Ltd, BASF SE, and Lanxess holding significant market share, although the exact distribution is complex and varies by segment. Innovation is driven by the demand for enhanced tire performance, stricter environmental regulations, and the push towards sustainable materials. The regulatory landscape is constantly evolving, impacting product formulations and manufacturing processes. Competition from substitute materials is present, particularly in specific applications. End-users include tire manufacturers, conveyor belt producers, and cable manufacturers. M&A activity in recent years has been moderate, with deal values ranging from xx Million to xx Million, primarily focused on expanding product portfolios and geographic reach.
- Market Share Distribution: Sumitomo Chemical Co Ltd holds an estimated xx% market share in 2025. BASF SE accounts for approximately xx%, while Lanxess holds around xx%. The remaining share is distributed among numerous smaller players.
- M&A Activity: Between 2019 and 2024, approximately xx M&A deals occurred, with a total estimated value of xx Million. These deals mostly involved smaller players being acquired by larger companies.
- Innovation Catalysts: Stringent fuel efficiency regulations and increasing demand for high-performance tires are pushing innovation in rubber additives.
- Substitute Products: Bio-based alternatives and recycled materials pose a competitive threat to conventional rubber additives.
Rubber Additives Market Industry Evolution
This section analyzes the Rubber Additives Market's evolution, tracing its growth trajectory, technological advancements, and evolving consumer demands from 2019 to 2024. The market experienced significant growth in the historical period (2019-2024), fueled by the expansion of the automotive and construction industries. Technological advancements, particularly in the development of sustainable and high-performance additives, have played a pivotal role in shaping market trends. Shifting consumer preferences towards fuel-efficient vehicles and environmentally friendly products have further influenced market dynamics. The market has seen a CAGR of approximately xx% during this period, driven primarily by increasing demand from the tire industry. Technological advancements include the introduction of nanomaterials for improved reinforcement and bio-based additives for reduced environmental impact.
Leading Regions, Countries, or Segments in Rubber Additives Market
This section identifies the dominant regions, countries, and segments within the Rubber Additives Market. Analysis is done across Type (Activators, Vulcanization Inhibitors, Plasticizers, Other Types), Application (Tires, Conveyor Belts, Electric Cables, Other Applications), and Fillers (Carbon Black, Calcium Carbonate, Silica, Other Fillers).
- Dominant Region: Asia-Pacific, driven by robust automotive production and infrastructure development.
- Dominant Country: China, due to its large manufacturing base and growing demand for rubber products.
- Dominant Type: Activators, due to their widespread use in various rubber applications.
- Dominant Application: Tires, due to the massive volume of tire production globally.
- Dominant Filler: Carbon Black, owing to its superior reinforcing properties.
Key Drivers:
- Asia-Pacific: Strong economic growth, increasing automotive production, and expanding infrastructure projects fuel market demand.
- China: Large manufacturing sector, robust automotive industry, and government support for infrastructure development.
- Activators: Essential for efficient vulcanization, enhancing the performance characteristics of rubber products.
- Tires: The dominant application, driven by rising vehicle ownership and tire replacement cycles.
- Carbon Black: Superior reinforcement properties, cost-effectiveness, and widespread availability.
Rubber Additives Market Product Innovations
Recent years have witnessed significant product innovations within the rubber additives market. Companies are focusing on developing sustainable, high-performance additives with improved properties such as enhanced durability, reduced rolling resistance, and improved grip. For example, the launch of Evonik's POLYVEST eCO, a sustainable liquid polybutadiene, highlights the growing focus on eco-friendly materials. These innovations are aimed at meeting the stringent requirements of the automotive and other industries.
Propelling Factors for Rubber Additives Market Growth
Several factors are propelling the growth of the rubber additives market. The automotive industry's expansion, particularly in emerging economies, is a primary driver. Technological advancements, such as the development of high-performance additives, are further stimulating market expansion. Government regulations promoting fuel efficiency and environmental sustainability are also boosting demand for eco-friendly rubber additives. Increasing investment in infrastructure projects further contributes to the market's growth.
Obstacles in the Rubber Additives Market
The rubber additives market faces challenges, including fluctuating raw material prices and supply chain disruptions. Stringent environmental regulations increase manufacturing costs and pose compliance challenges. Intense competition among established and emerging players also limits profit margins.
Future Opportunities in Rubber Additives Market
The future of the rubber additives market looks promising. Emerging economies present untapped opportunities, with rising demand for vehicles and infrastructure. The increasing focus on sustainable materials opens avenues for bio-based and recycled rubber additives. Technological advancements in nanomaterials and other advanced additives provide growth potential.
Major Players in the Rubber Additives Market Ecosystem
- Sumitomo Chemical Co Ltd
- PUKHRAJ ZINCOLET
- Kemai Chemical Co Ltd
- NOCIL LIMITED
- MLPC International (Arkema Group)
- Emery Oleochemicals
- BASF SE
- China Sunsine Chemical Holdings Limited
- Thomas Swan & Co Ltd
- Eastman Chemical Company
- Behn Meyer
- Rhein Chemie (Lanxess)
- China Petrochemical Corporation (SINOPEC)
Key Developments in Rubber Additives Market Industry
- February 2023: Yokohama Rubber Co., Ltd. expands passenger car tire production capacity in India by 60%, reaching 4.5 Million units annually. This significantly boosts demand for rubber additives in the region.
- July 2022: Birch Chemicals establishes a new entity in India, capitalizing on the growing Asian market demand for curing activators and desiccants. This expands the supply of crucial rubber additives in a key region.
- June 2022: Evonik launches POLYVEST eCO, a sustainable liquid polybutadiene for tire manufacturing, addressing the growing need for environmentally friendly additives. This introduction reflects the shift toward sustainability within the industry.
Strategic Rubber Additives Market Forecast
The Rubber Additives Market is poised for continued growth, driven by the expanding automotive sector, infrastructure development, and the increasing adoption of sustainable materials. Technological advancements and favorable government policies will further contribute to market expansion. The Asia-Pacific region, particularly China and India, will remain key growth markets. The focus on sustainability will drive innovation and create new opportunities for eco-friendly rubber additives.
Rubber Additives Market Segmentation
-
1. Type
- 1.1. Activators
- 1.2. Vulcanization Inhibitors
- 1.3. Plasticizers
- 1.4. Other Types
-
2. Application
- 2.1. Tires
- 2.2. Conveyor Belts
- 2.3. Electric Cables
- 2.4. Other Applications
-
3. Fillers
- 3.1. Carbon Black
- 3.2. Calcium Carbonate
- 3.3. Silica
- 3.4. Other Fillers
Rubber Additives Market Segmentation By Geography
-
1. Asia Pacific
- 1.1. China
- 1.2. India
- 1.3. Japan
- 1.4. South Korea
- 1.5. Rest of Asia Pacific
-
2. North America
- 2.1. United States
- 2.2. Canada
- 2.3. Mexico
-
3. Europe
- 3.1. Germany
- 3.2. United Kingdom
- 3.3. France
- 3.4. Italy
- 3.5. Rest of Europe
-
4. South America
- 4.1. Brazil
- 4.2. Argentina
- 4.3. Rest of South America
-
5. Middle East and Africa
- 5.1. Saudi Arabia
- 5.2. South Africa
- 5.3. Rest of Middle East and Africa
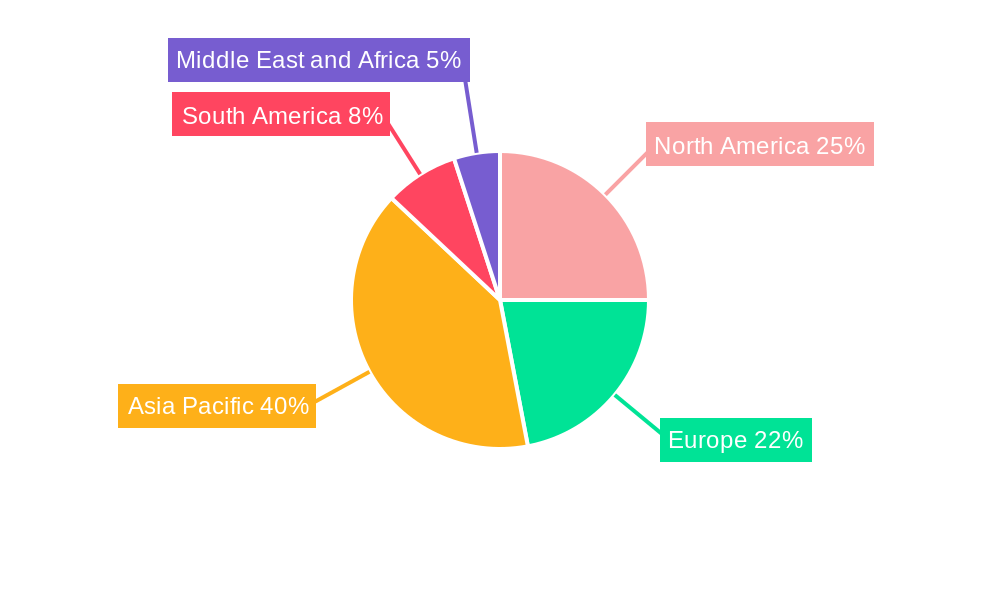
Rubber Additives Market Regional Market Share
Geographic Coverage of Rubber Additives Market
Rubber Additives Market REPORT HIGHLIGHTS
| Aspects | Details |
|---|---|
| Study Period | 2020-2034 |
| Base Year | 2025 |
| Estimated Year | 2026 |
| Forecast Period | 2026-2034 |
| Historical Period | 2020-2025 |
| Growth Rate | CAGR of 4.32% from 2020-2034 |
| Segmentation |
|
Table of Contents
- 1. Introduction
- 1.1. Research Scope
- 1.2. Market Segmentation
- 1.3. Research Objective
- 1.4. Definitions and Assumptions
- 2. Executive Summary
- 2.1. Market Snapshot
- 3. Market Dynamics
- 3.1. Market Drivers
- 3.2. Market Restrains
- 3.3. Market Trends
- 3.4. Market Opportunities
- 4. Market Factor Analysis
- 4.1. Porters Five Forces
- 4.1.1. Bargaining Power of Suppliers
- 4.1.2. Bargaining Power of Buyers
- 4.1.3. Threat of New Entrants
- 4.1.4. Threat of Substitutes
- 4.1.5. Competitive Rivalry
- 4.2. PESTEL analysis
- 4.3. BCG Analysis
- 4.3.1. Stars (High Growth, High Market Share)
- 4.3.2. Cash Cows (Low Growth, High Market Share)
- 4.3.3. Question Mark (High Growth, Low Market Share)
- 4.3.4. Dogs (Low Growth, Low Market Share)
- 4.4. Ansoff Matrix Analysis
- 4.5. Supply Chain Analysis
- 4.6. Regulatory Landscape
- 4.7. Current Market Potential and Opportunity Assessment (TAM–SAM–SOM Framework)
- 4.8. DMV Analyst Note
- 4.1. Porters Five Forces
- 5. Market Analysis, Insights and Forecast 2021-2033
- 5.1. Market Analysis, Insights and Forecast - by Type
- 5.1.1. Activators
- 5.1.2. Vulcanization Inhibitors
- 5.1.3. Plasticizers
- 5.1.4. Other Types
- 5.2. Market Analysis, Insights and Forecast - by Application
- 5.2.1. Tires
- 5.2.2. Conveyor Belts
- 5.2.3. Electric Cables
- 5.2.4. Other Applications
- 5.3. Market Analysis, Insights and Forecast - by Fillers
- 5.3.1. Carbon Black
- 5.3.2. Calcium Carbonate
- 5.3.3. Silica
- 5.3.4. Other Fillers
- 5.4. Market Analysis, Insights and Forecast - by Region
- 5.4.1. Asia Pacific
- 5.4.2. North America
- 5.4.3. Europe
- 5.4.4. South America
- 5.4.5. Middle East and Africa
- 5.1. Market Analysis, Insights and Forecast - by Type
- 6. Global Rubber Additives Market Analysis, Insights and Forecast, 2021-2033
- 6.1. Market Analysis, Insights and Forecast - by Type
- 6.1.1. Activators
- 6.1.2. Vulcanization Inhibitors
- 6.1.3. Plasticizers
- 6.1.4. Other Types
- 6.2. Market Analysis, Insights and Forecast - by Application
- 6.2.1. Tires
- 6.2.2. Conveyor Belts
- 6.2.3. Electric Cables
- 6.2.4. Other Applications
- 6.3. Market Analysis, Insights and Forecast - by Fillers
- 6.3.1. Carbon Black
- 6.3.2. Calcium Carbonate
- 6.3.3. Silica
- 6.3.4. Other Fillers
- 6.1. Market Analysis, Insights and Forecast - by Type
- 7. Asia Pacific Rubber Additives Market Analysis, Insights and Forecast, 2020-2032
- 7.1. Market Analysis, Insights and Forecast - by Type
- 7.1.1. Activators
- 7.1.2. Vulcanization Inhibitors
- 7.1.3. Plasticizers
- 7.1.4. Other Types
- 7.2. Market Analysis, Insights and Forecast - by Application
- 7.2.1. Tires
- 7.2.2. Conveyor Belts
- 7.2.3. Electric Cables
- 7.2.4. Other Applications
- 7.3. Market Analysis, Insights and Forecast - by Fillers
- 7.3.1. Carbon Black
- 7.3.2. Calcium Carbonate
- 7.3.3. Silica
- 7.3.4. Other Fillers
- 7.1. Market Analysis, Insights and Forecast - by Type
- 8. North America Rubber Additives Market Analysis, Insights and Forecast, 2020-2032
- 8.1. Market Analysis, Insights and Forecast - by Type
- 8.1.1. Activators
- 8.1.2. Vulcanization Inhibitors
- 8.1.3. Plasticizers
- 8.1.4. Other Types
- 8.2. Market Analysis, Insights and Forecast - by Application
- 8.2.1. Tires
- 8.2.2. Conveyor Belts
- 8.2.3. Electric Cables
- 8.2.4. Other Applications
- 8.3. Market Analysis, Insights and Forecast - by Fillers
- 8.3.1. Carbon Black
- 8.3.2. Calcium Carbonate
- 8.3.3. Silica
- 8.3.4. Other Fillers
- 8.1. Market Analysis, Insights and Forecast - by Type
- 9. Europe Rubber Additives Market Analysis, Insights and Forecast, 2020-2032
- 9.1. Market Analysis, Insights and Forecast - by Type
- 9.1.1. Activators
- 9.1.2. Vulcanization Inhibitors
- 9.1.3. Plasticizers
- 9.1.4. Other Types
- 9.2. Market Analysis, Insights and Forecast - by Application
- 9.2.1. Tires
- 9.2.2. Conveyor Belts
- 9.2.3. Electric Cables
- 9.2.4. Other Applications
- 9.3. Market Analysis, Insights and Forecast - by Fillers
- 9.3.1. Carbon Black
- 9.3.2. Calcium Carbonate
- 9.3.3. Silica
- 9.3.4. Other Fillers
- 9.1. Market Analysis, Insights and Forecast - by Type
- 10. South America Rubber Additives Market Analysis, Insights and Forecast, 2020-2032
- 10.1. Market Analysis, Insights and Forecast - by Type
- 10.1.1. Activators
- 10.1.2. Vulcanization Inhibitors
- 10.1.3. Plasticizers
- 10.1.4. Other Types
- 10.2. Market Analysis, Insights and Forecast - by Application
- 10.2.1. Tires
- 10.2.2. Conveyor Belts
- 10.2.3. Electric Cables
- 10.2.4. Other Applications
- 10.3. Market Analysis, Insights and Forecast - by Fillers
- 10.3.1. Carbon Black
- 10.3.2. Calcium Carbonate
- 10.3.3. Silica
- 10.3.4. Other Fillers
- 10.1. Market Analysis, Insights and Forecast - by Type
- 11. Middle East and Africa Rubber Additives Market Analysis, Insights and Forecast, 2020-2032
- 11.1. Market Analysis, Insights and Forecast - by Type
- 11.1.1. Activators
- 11.1.2. Vulcanization Inhibitors
- 11.1.3. Plasticizers
- 11.1.4. Other Types
- 11.2. Market Analysis, Insights and Forecast - by Application
- 11.2.1. Tires
- 11.2.2. Conveyor Belts
- 11.2.3. Electric Cables
- 11.2.4. Other Applications
- 11.3. Market Analysis, Insights and Forecast - by Fillers
- 11.3.1. Carbon Black
- 11.3.2. Calcium Carbonate
- 11.3.3. Silica
- 11.3.4. Other Fillers
- 11.1. Market Analysis, Insights and Forecast - by Type
- 12. Competitive Analysis
- 12.1. Company Profiles
- 12.1.1 Sumitomo Chemical Co Ltd
- 12.1.1.1. Company Overview
- 12.1.1.2. Products
- 12.1.1.3. Company Financials
- 12.1.1.4. SWOT Analysis
- 12.1.2 PUKHRAJ ZINCOLET
- 12.1.2.1. Company Overview
- 12.1.2.2. Products
- 12.1.2.3. Company Financials
- 12.1.2.4. SWOT Analysis
- 12.1.3 Kemai Chemical Co Ltd
- 12.1.3.1. Company Overview
- 12.1.3.2. Products
- 12.1.3.3. Company Financials
- 12.1.3.4. SWOT Analysis
- 12.1.4 NOCIL LIMITED
- 12.1.4.1. Company Overview
- 12.1.4.2. Products
- 12.1.4.3. Company Financials
- 12.1.4.4. SWOT Analysis
- 12.1.5 MLPC International (Arkema Group)
- 12.1.5.1. Company Overview
- 12.1.5.2. Products
- 12.1.5.3. Company Financials
- 12.1.5.4. SWOT Analysis
- 12.1.6 Emery Oleochemicals
- 12.1.6.1. Company Overview
- 12.1.6.2. Products
- 12.1.6.3. Company Financials
- 12.1.6.4. SWOT Analysis
- 12.1.7 BASF SE
- 12.1.7.1. Company Overview
- 12.1.7.2. Products
- 12.1.7.3. Company Financials
- 12.1.7.4. SWOT Analysis
- 12.1.8 China Sunsine Chemical Holdings Limited
- 12.1.8.1. Company Overview
- 12.1.8.2. Products
- 12.1.8.3. Company Financials
- 12.1.8.4. SWOT Analysis
- 12.1.9 Thomas Swan & Co Ltd*List Not Exhaustive
- 12.1.9.1. Company Overview
- 12.1.9.2. Products
- 12.1.9.3. Company Financials
- 12.1.9.4. SWOT Analysis
- 12.1.10 Eastman Chemical Company
- 12.1.10.1. Company Overview
- 12.1.10.2. Products
- 12.1.10.3. Company Financials
- 12.1.10.4. SWOT Analysis
- 12.1.11 Behn Meyer
- 12.1.11.1. Company Overview
- 12.1.11.2. Products
- 12.1.11.3. Company Financials
- 12.1.11.4. SWOT Analysis
- 12.1.12 Rhein Chemie (Lanxess)
- 12.1.12.1. Company Overview
- 12.1.12.2. Products
- 12.1.12.3. Company Financials
- 12.1.12.4. SWOT Analysis
- 12.1.13 China Petrochemical Corporation (SINOPEC)
- 12.1.13.1. Company Overview
- 12.1.13.2. Products
- 12.1.13.3. Company Financials
- 12.1.13.4. SWOT Analysis
- 12.1.1 Sumitomo Chemical Co Ltd
- 12.2. Market Entropy
- 12.2.1 Company's Key Areas Served
- 12.2.2 Recent Developments
- 12.3. Company Market Share Analysis 2025
- 12.3.1 Top 5 Companies Market Share Analysis
- 12.3.2 Top 3 Companies Market Share Analysis
- 12.4. List of Potential Customers
- 13. Research Methodology
List of Figures
- Figure 1: Global Rubber Additives Market Revenue Breakdown (Million, %) by Region 2025 & 2033
- Figure 2: Asia Pacific Rubber Additives Market Revenue (Million), by Type 2025 & 2033
- Figure 3: Asia Pacific Rubber Additives Market Revenue Share (%), by Type 2025 & 2033
- Figure 4: Asia Pacific Rubber Additives Market Revenue (Million), by Application 2025 & 2033
- Figure 5: Asia Pacific Rubber Additives Market Revenue Share (%), by Application 2025 & 2033
- Figure 6: Asia Pacific Rubber Additives Market Revenue (Million), by Fillers 2025 & 2033
- Figure 7: Asia Pacific Rubber Additives Market Revenue Share (%), by Fillers 2025 & 2033
- Figure 8: Asia Pacific Rubber Additives Market Revenue (Million), by Country 2025 & 2033
- Figure 9: Asia Pacific Rubber Additives Market Revenue Share (%), by Country 2025 & 2033
- Figure 10: North America Rubber Additives Market Revenue (Million), by Type 2025 & 2033
- Figure 11: North America Rubber Additives Market Revenue Share (%), by Type 2025 & 2033
- Figure 12: North America Rubber Additives Market Revenue (Million), by Application 2025 & 2033
- Figure 13: North America Rubber Additives Market Revenue Share (%), by Application 2025 & 2033
- Figure 14: North America Rubber Additives Market Revenue (Million), by Fillers 2025 & 2033
- Figure 15: North America Rubber Additives Market Revenue Share (%), by Fillers 2025 & 2033
- Figure 16: North America Rubber Additives Market Revenue (Million), by Country 2025 & 2033
- Figure 17: North America Rubber Additives Market Revenue Share (%), by Country 2025 & 2033
- Figure 18: Europe Rubber Additives Market Revenue (Million), by Type 2025 & 2033
- Figure 19: Europe Rubber Additives Market Revenue Share (%), by Type 2025 & 2033
- Figure 20: Europe Rubber Additives Market Revenue (Million), by Application 2025 & 2033
- Figure 21: Europe Rubber Additives Market Revenue Share (%), by Application 2025 & 2033
- Figure 22: Europe Rubber Additives Market Revenue (Million), by Fillers 2025 & 2033
- Figure 23: Europe Rubber Additives Market Revenue Share (%), by Fillers 2025 & 2033
- Figure 24: Europe Rubber Additives Market Revenue (Million), by Country 2025 & 2033
- Figure 25: Europe Rubber Additives Market Revenue Share (%), by Country 2025 & 2033
- Figure 26: South America Rubber Additives Market Revenue (Million), by Type 2025 & 2033
- Figure 27: South America Rubber Additives Market Revenue Share (%), by Type 2025 & 2033
- Figure 28: South America Rubber Additives Market Revenue (Million), by Application 2025 & 2033
- Figure 29: South America Rubber Additives Market Revenue Share (%), by Application 2025 & 2033
- Figure 30: South America Rubber Additives Market Revenue (Million), by Fillers 2025 & 2033
- Figure 31: South America Rubber Additives Market Revenue Share (%), by Fillers 2025 & 2033
- Figure 32: South America Rubber Additives Market Revenue (Million), by Country 2025 & 2033
- Figure 33: South America Rubber Additives Market Revenue Share (%), by Country 2025 & 2033
- Figure 34: Middle East and Africa Rubber Additives Market Revenue (Million), by Type 2025 & 2033
- Figure 35: Middle East and Africa Rubber Additives Market Revenue Share (%), by Type 2025 & 2033
- Figure 36: Middle East and Africa Rubber Additives Market Revenue (Million), by Application 2025 & 2033
- Figure 37: Middle East and Africa Rubber Additives Market Revenue Share (%), by Application 2025 & 2033
- Figure 38: Middle East and Africa Rubber Additives Market Revenue (Million), by Fillers 2025 & 2033
- Figure 39: Middle East and Africa Rubber Additives Market Revenue Share (%), by Fillers 2025 & 2033
- Figure 40: Middle East and Africa Rubber Additives Market Revenue (Million), by Country 2025 & 2033
- Figure 41: Middle East and Africa Rubber Additives Market Revenue Share (%), by Country 2025 & 2033
List of Tables
- Table 1: Global Rubber Additives Market Revenue Million Forecast, by Type 2020 & 2033
- Table 2: Global Rubber Additives Market Revenue Million Forecast, by Application 2020 & 2033
- Table 3: Global Rubber Additives Market Revenue Million Forecast, by Fillers 2020 & 2033
- Table 4: Global Rubber Additives Market Revenue Million Forecast, by Region 2020 & 2033
- Table 5: Global Rubber Additives Market Revenue Million Forecast, by Type 2020 & 2033
- Table 6: Global Rubber Additives Market Revenue Million Forecast, by Application 2020 & 2033
- Table 7: Global Rubber Additives Market Revenue Million Forecast, by Fillers 2020 & 2033
- Table 8: Global Rubber Additives Market Revenue Million Forecast, by Country 2020 & 2033
- Table 9: China Rubber Additives Market Revenue (Million) Forecast, by Application 2020 & 2033
- Table 10: India Rubber Additives Market Revenue (Million) Forecast, by Application 2020 & 2033
- Table 11: Japan Rubber Additives Market Revenue (Million) Forecast, by Application 2020 & 2033
- Table 12: South Korea Rubber Additives Market Revenue (Million) Forecast, by Application 2020 & 2033
- Table 13: Rest of Asia Pacific Rubber Additives Market Revenue (Million) Forecast, by Application 2020 & 2033
- Table 14: Global Rubber Additives Market Revenue Million Forecast, by Type 2020 & 2033
- Table 15: Global Rubber Additives Market Revenue Million Forecast, by Application 2020 & 2033
- Table 16: Global Rubber Additives Market Revenue Million Forecast, by Fillers 2020 & 2033
- Table 17: Global Rubber Additives Market Revenue Million Forecast, by Country 2020 & 2033
- Table 18: United States Rubber Additives Market Revenue (Million) Forecast, by Application 2020 & 2033
- Table 19: Canada Rubber Additives Market Revenue (Million) Forecast, by Application 2020 & 2033
- Table 20: Mexico Rubber Additives Market Revenue (Million) Forecast, by Application 2020 & 2033
- Table 21: Global Rubber Additives Market Revenue Million Forecast, by Type 2020 & 2033
- Table 22: Global Rubber Additives Market Revenue Million Forecast, by Application 2020 & 2033
- Table 23: Global Rubber Additives Market Revenue Million Forecast, by Fillers 2020 & 2033
- Table 24: Global Rubber Additives Market Revenue Million Forecast, by Country 2020 & 2033
- Table 25: Germany Rubber Additives Market Revenue (Million) Forecast, by Application 2020 & 2033
- Table 26: United Kingdom Rubber Additives Market Revenue (Million) Forecast, by Application 2020 & 2033
- Table 27: France Rubber Additives Market Revenue (Million) Forecast, by Application 2020 & 2033
- Table 28: Italy Rubber Additives Market Revenue (Million) Forecast, by Application 2020 & 2033
- Table 29: Rest of Europe Rubber Additives Market Revenue (Million) Forecast, by Application 2020 & 2033
- Table 30: Global Rubber Additives Market Revenue Million Forecast, by Type 2020 & 2033
- Table 31: Global Rubber Additives Market Revenue Million Forecast, by Application 2020 & 2033
- Table 32: Global Rubber Additives Market Revenue Million Forecast, by Fillers 2020 & 2033
- Table 33: Global Rubber Additives Market Revenue Million Forecast, by Country 2020 & 2033
- Table 34: Brazil Rubber Additives Market Revenue (Million) Forecast, by Application 2020 & 2033
- Table 35: Argentina Rubber Additives Market Revenue (Million) Forecast, by Application 2020 & 2033
- Table 36: Rest of South America Rubber Additives Market Revenue (Million) Forecast, by Application 2020 & 2033
- Table 37: Global Rubber Additives Market Revenue Million Forecast, by Type 2020 & 2033
- Table 38: Global Rubber Additives Market Revenue Million Forecast, by Application 2020 & 2033
- Table 39: Global Rubber Additives Market Revenue Million Forecast, by Fillers 2020 & 2033
- Table 40: Global Rubber Additives Market Revenue Million Forecast, by Country 2020 & 2033
- Table 41: Saudi Arabia Rubber Additives Market Revenue (Million) Forecast, by Application 2020 & 2033
- Table 42: South Africa Rubber Additives Market Revenue (Million) Forecast, by Application 2020 & 2033
- Table 43: Rest of Middle East and Africa Rubber Additives Market Revenue (Million) Forecast, by Application 2020 & 2033
Frequently Asked Questions
1. What is the projected Compound Annual Growth Rate (CAGR) of the Rubber Additives Market?
The projected CAGR is approximately 4.32%.
2. Which companies are prominent players in the Rubber Additives Market?
Key companies in the market include Sumitomo Chemical Co Ltd, PUKHRAJ ZINCOLET, Kemai Chemical Co Ltd, NOCIL LIMITED, MLPC International (Arkema Group), Emery Oleochemicals, BASF SE, China Sunsine Chemical Holdings Limited, Thomas Swan & Co Ltd*List Not Exhaustive, Eastman Chemical Company, Behn Meyer, Rhein Chemie (Lanxess), China Petrochemical Corporation (SINOPEC).
3. What are the main segments of the Rubber Additives Market?
The market segments include Type, Application, Fillers.
4. Can you provide details about the market size?
The market size is estimated to be USD 5.87 Million as of 2022.
5. What are some drivers contributing to market growth?
Growth in the Tire and Rubber Industry; Growing Demand from the Non-Tire Segment in the Construction Industry; Other Drivers.
6. What are the notable trends driving market growth?
Tire Segment to Dominate the Market.
7. Are there any restraints impacting market growth?
Environmental Constraints Pertaining to Rubber Chemicals; Other Restraints.
8. Can you provide examples of recent developments in the market?
In February 2023, The Yokohama Rubber Co., Ltd. (YRC) announced details of its 2023 expansion program following the completion of its ongoing medium-term business plan Under Yokohama Transformation 2023 (YX2023). The project includes an expansion of passenger car tire production capacity in India, increasing the Group's production by 60% to 4.5 million units per year.
9. What pricing options are available for accessing the report?
Pricing options include single-user, multi-user, and enterprise licenses priced at USD 4750, USD 5250, and USD 8750 respectively.
10. Is the market size provided in terms of value or volume?
The market size is provided in terms of value, measured in Million.
11. Are there any specific market keywords associated with the report?
Yes, the market keyword associated with the report is "Rubber Additives Market," which aids in identifying and referencing the specific market segment covered.
12. How do I determine which pricing option suits my needs best?
The pricing options vary based on user requirements and access needs. Individual users may opt for single-user licenses, while businesses requiring broader access may choose multi-user or enterprise licenses for cost-effective access to the report.
13. Are there any additional resources or data provided in the Rubber Additives Market report?
While the report offers comprehensive insights, it's advisable to review the specific contents or supplementary materials provided to ascertain if additional resources or data are available.
14. How can I stay updated on further developments or reports in the Rubber Additives Market?
To stay informed about further developments, trends, and reports in the Rubber Additives Market, consider subscribing to industry newsletters, following relevant companies and organizations, or regularly checking reputable industry news sources and publications.
Methodology
Step 1 - Identification of Relevant Samples Size from Population Database


Step 2 - Approaches for Defining Global Market Size (Value, Volume* & Price*)

Note*: In applicable scenarios
Step 3 - Data Sources
Primary Research
- Web Analytics
- Survey Reports
- Research Institute
- Latest Research Reports
- Opinion Leaders
Secondary Research
- Annual Reports
- White Paper
- Latest Press Release
- Industry Association
- Paid Database
- Investor Presentations

Step 4 - Data Triangulation
Involves using different sources of information in order to increase the validity of a study
These sources are likely to be stakeholders in a program - participants, other researchers, program staff, other community members, and so on.
Then we put all data in single framework & apply various statistical tools to find out the dynamic on the market.
During the analysis stage, feedback from the stakeholder groups would be compared to determine areas of agreement as well as areas of divergence