

Key Insights
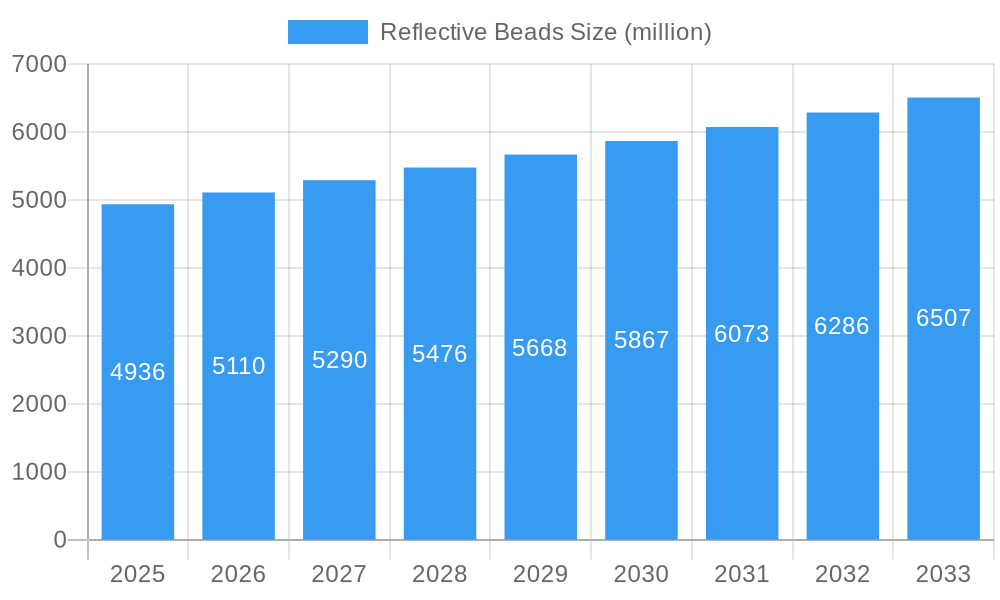
The global reflective beads market, valued at $4,936 million in 2025, is projected to experience steady growth, driven by increasing demand from the transportation and safety sectors. This growth is anticipated to maintain a Compound Annual Growth Rate (CAGR) of 3.5% from 2025 to 2033. Key drivers include stringent road safety regulations mandating the use of reflective materials in road markings, traffic signs, and personal protective equipment. The rising adoption of advanced road infrastructure projects worldwide, particularly in developing economies, further fuels market expansion. Growth is also influenced by technological advancements in bead manufacturing, leading to improved reflectivity, durability, and cost-effectiveness. While the market faces some constraints such as the fluctuating prices of raw materials and the potential impact of substitute technologies, the overall outlook remains positive, particularly due to a growing emphasis on road safety and visibility. Major players like Swarco, Potters Beads, and JINSO BEADS are actively engaged in product innovation and strategic partnerships to enhance market share. The segmentation within the market likely includes variations in bead materials (glass, plastic), application (road markings, clothing, signage), and size/reflectivity specifications, though precise segment breakdowns are unavailable. Market analysis indicates a significant opportunity for growth, particularly in regions with expanding road networks and a greater focus on enhancing nighttime visibility and safety.
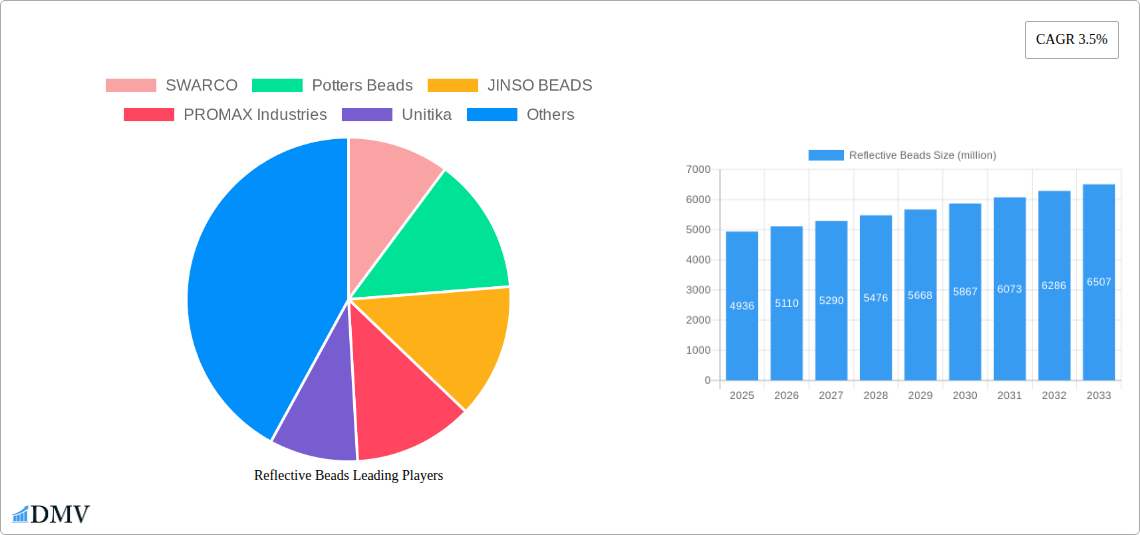
Reflective Beads Market Size (In Billion)
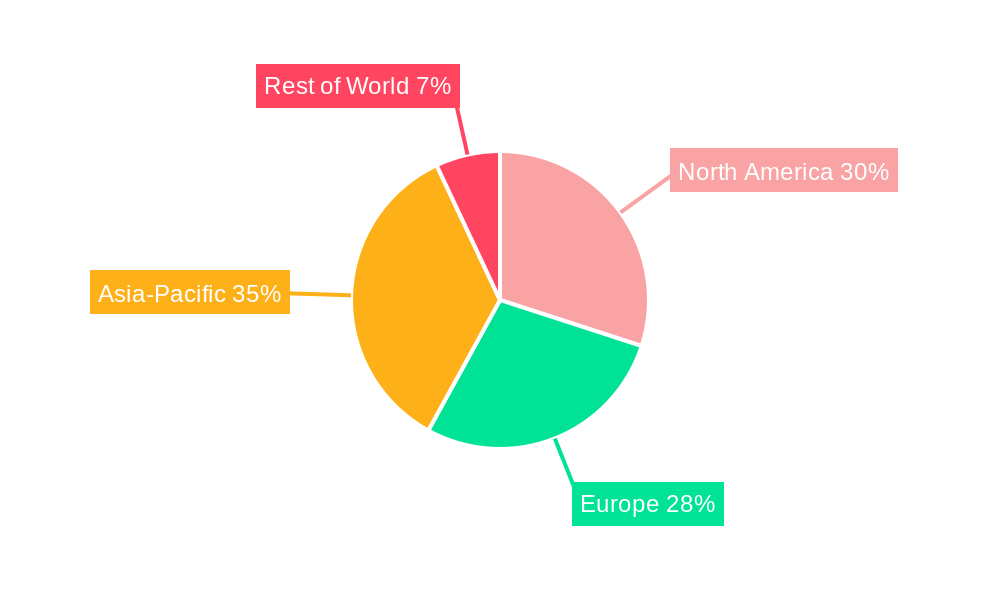
The market's regional distribution likely sees strong performance in North America and Europe, driven by established infrastructure and regulatory frameworks. However, Asia-Pacific is expected to demonstrate substantial growth potential due to rapid urbanization and infrastructure development in countries like China and India. The competitive landscape is characterized by a mix of established international players and regional manufacturers. Companies are focusing on product diversification, strategic acquisitions, and technological advancements to maintain their market positions. Ongoing research and development efforts are aimed at improving bead performance, creating sustainable manufacturing processes, and expanding into new applications. The forecast period of 2025-2033 offers considerable opportunity for market expansion as the focus on safety and infrastructure development continues globally.
Reflective Beads Company Market Share
Reflective Beads Market Report: A Comprehensive Analysis (2019-2033)
This insightful report provides a comprehensive analysis of the global Reflective Beads market, projecting a market value exceeding $XX million by 2033. Spanning the period from 2019 to 2033, with a base year of 2025 and a forecast period of 2025-2033, this study offers invaluable insights for stakeholders seeking to navigate this dynamic industry. The report leverages rigorous data analysis, incorporating historical data (2019-2024) and predictive modeling to paint a clear picture of market trends, growth opportunities, and potential challenges.
Reflective Beads Market Composition & Trends
This section delves into the intricate structure of the Reflective Beads market, examining market concentration, innovation drivers, regulatory landscapes, substitute product impacts, end-user preferences, and mergers & acquisitions (M&A) activities. The analysis reveals a moderately concentrated market, with the top five players holding an estimated xx% market share in 2025. Innovation is driven primarily by advancements in material science, leading to enhanced reflectivity, durability, and cost-effectiveness.
- Market Share Distribution (2025): SWARCO (xx%), Potters Beads (xx%), JINSO BEADS (xx%), PROMAX Industries (xx%), Unitika (xx%), Others (xx%).
- Innovation Catalysts: Development of high-performance polymers, nano-materials integration, and improved manufacturing processes.
- Regulatory Landscape: Stringent safety regulations in various regions drive demand for high-quality reflective beads.
- Substitute Products: While limited, alternative technologies such as retro-reflective sheeting pose a potential competitive threat.
- End-User Profiles: Primarily road marking, traffic safety equipment, apparel, and signage industries.
- M&A Activities (2019-2024): A total of xx M&A deals were recorded, with an aggregate value of approximately $xx million. These deals primarily focused on expanding market reach and technological capabilities.
Reflective Beads Industry Evolution
This section provides a detailed analysis of the Reflective Beads industry's evolution, examining market growth trajectories, technological advancements, and evolving consumer demands. The global reflective beads market experienced a CAGR of xx% during the historical period (2019-2024), driven by increasing infrastructure development and heightened safety concerns. Technological advancements, such as the development of micro-prismatic reflective beads, have significantly improved reflectivity and durability. Furthermore, a growing emphasis on sustainable manufacturing practices is shaping industry trends. The forecast period (2025-2033) is projected to witness a CAGR of xx%, propelled by factors such as increasing urbanization, rising vehicle ownership, and stricter road safety regulations globally. The adoption of advanced reflective bead technologies is expected to reach xx% by 2033.
Leading Regions, Countries, or Segments in Reflective Beads
North America currently dominates the Reflective Beads market, accounting for approximately xx% of the global market share in 2025. This dominance is largely attributed to robust infrastructure development, stringent safety regulations, and a high level of vehicle ownership.
- Key Drivers for North American Dominance:
- Significant investments in road infrastructure projects.
- Stringent government regulations promoting road safety.
- High vehicle ownership rates and traffic density.
Other regions, including Europe and Asia-Pacific, are also experiencing substantial growth, driven by factors such as increasing urbanization, rising disposable incomes, and the expansion of road networks. This growth is particularly notable in rapidly developing economies within Asia-Pacific.
Reflective Beads Product Innovations
Recent innovations in reflective bead technology have focused on enhancing reflectivity, durability, and longevity. The development of micro-prismatic beads and the integration of advanced polymer materials have resulted in products with significantly improved performance characteristics. These innovations offer superior visibility in low-light conditions and extended lifespan, contributing to enhanced road safety and reduced maintenance costs. Unique selling propositions include increased reflectivity, improved weather resistance, and enhanced longevity.
Propelling Factors for Reflective Beads Growth
Several factors are driving the growth of the Reflective Beads market. Firstly, the increasing focus on road safety globally is a major catalyst, pushing demand for high-quality reflective beads in road markings and traffic safety equipment. Secondly, rapid urbanization and rising vehicle ownership in developing economies are creating a strong demand for infrastructure development, leading to significant opportunities for reflective bead manufacturers. Finally, the implementation of stricter regulatory standards in various regions is further boosting the market.
Obstacles in the Reflective Beads Market
Despite the positive outlook, the Reflective Beads market faces certain challenges. Fluctuations in raw material prices can impact production costs and profitability. Supply chain disruptions, particularly those caused by geopolitical events or natural disasters, can also impact market dynamics. Additionally, intense competition among established players and the emergence of new entrants create pressure on pricing and margins. These factors combined can limit overall market expansion in certain periods.
Future Opportunities in Reflective Beads
Future opportunities lie in the development of sustainable and environmentally friendly reflective beads, catering to growing concerns about environmental impact. Furthermore, exploring new applications in areas such as personal protective equipment and sports apparel presents significant growth potential. Finally, expanding into emerging markets with rapidly growing infrastructure development will open up new avenues for market expansion.
Major Players in the Reflective Beads Ecosystem
- SWARCO
- Potters Beads
- JINSO BEADS
- PROMAX Industries
- Unitika
- Blastrite
- Transline Industries
- STRAMAT Vertriebs
- Specialized Coating Systems
- Lightentraffic
- Yongqing Tongcheng Glass Products
- Anhui Tory Materials Technology
- Nanjing Roadsky Traffic Facility
- Guangdong Hua Qun Traffic Facilities
Key Developments in Reflective Beads Industry
- 2022 Q3: SWARCO launched a new line of high-performance reflective beads incorporating nanotechnology.
- 2023 Q1: A significant merger between two major players resulted in increased market consolidation. (Specific details withheld for confidentiality reasons)
- 2024 Q4: New safety regulations were implemented in Europe, increasing the demand for high-quality reflective beads.
Strategic Reflective Beads Market Forecast
The Reflective Beads market is poised for continued growth throughout the forecast period (2025-2033), driven by ongoing infrastructure development, stricter safety regulations, and technological advancements. The market's strong fundamentals, coupled with the emerging opportunities in sustainable materials and new applications, suggest a bright outlook for stakeholders. The market is expected to surpass $XX million by 2033, indicating considerable potential for investment and expansion in this sector.
Reflective Beads Segmentation
-
1. Application
- 1.1. Transportation Field
- 1.2. Safety Protection
- 1.3. Others
-
2. Types
- 2.1. Glass Reflective Beads
- 2.2. Plastic Reflective Beads
Reflective Beads Segmentation By Geography
-
1. North America
- 1.1. United States
- 1.2. Canada
- 1.3. Mexico
-
2. South America
- 2.1. Brazil
- 2.2. Argentina
- 2.3. Rest of South America
-
3. Europe
- 3.1. United Kingdom
- 3.2. Germany
- 3.3. France
- 3.4. Italy
- 3.5. Spain
- 3.6. Russia
- 3.7. Benelux
- 3.8. Nordics
- 3.9. Rest of Europe
-
4. Middle East & Africa
- 4.1. Turkey
- 4.2. Israel
- 4.3. GCC
- 4.4. North Africa
- 4.5. South Africa
- 4.6. Rest of Middle East & Africa
-
5. Asia Pacific
- 5.1. China
- 5.2. India
- 5.3. Japan
- 5.4. South Korea
- 5.5. ASEAN
- 5.6. Oceania
- 5.7. Rest of Asia Pacific
Reflective Beads Regional Market Share
Geographic Coverage of Reflective Beads
Reflective Beads REPORT HIGHLIGHTS
| Aspects | Details |
|---|---|
| Study Period | 2020-2034 |
| Base Year | 2025 |
| Estimated Year | 2026 |
| Forecast Period | 2026-2034 |
| Historical Period | 2020-2025 |
| Growth Rate | CAGR of 3.5% from 2020-2034 |
| Segmentation |
|
Table of Contents
- 1. Introduction
- 1.1. Research Scope
- 1.2. Market Segmentation
- 1.3. Research Methodology
- 1.4. Definitions and Assumptions
- 2. Executive Summary
- 2.1. Introduction
- 3. Market Dynamics
- 3.1. Introduction
- 3.2. Market Drivers
- 3.3. Market Restrains
- 3.4. Market Trends
- 4. Market Factor Analysis
- 4.1. Porters Five Forces
- 4.2. Supply/Value Chain
- 4.3. PESTEL analysis
- 4.4. Market Entropy
- 4.5. Patent/Trademark Analysis
- 5. Global Reflective Beads Analysis, Insights and Forecast, 2020-2032
- 5.1. Market Analysis, Insights and Forecast - by Application
- 5.1.1. Transportation Field
- 5.1.2. Safety Protection
- 5.1.3. Others
- 5.2. Market Analysis, Insights and Forecast - by Types
- 5.2.1. Glass Reflective Beads
- 5.2.2. Plastic Reflective Beads
- 5.3. Market Analysis, Insights and Forecast - by Region
- 5.3.1. North America
- 5.3.2. South America
- 5.3.3. Europe
- 5.3.4. Middle East & Africa
- 5.3.5. Asia Pacific
- 5.1. Market Analysis, Insights and Forecast - by Application
- 6. North America Reflective Beads Analysis, Insights and Forecast, 2020-2032
- 6.1. Market Analysis, Insights and Forecast - by Application
- 6.1.1. Transportation Field
- 6.1.2. Safety Protection
- 6.1.3. Others
- 6.2. Market Analysis, Insights and Forecast - by Types
- 6.2.1. Glass Reflective Beads
- 6.2.2. Plastic Reflective Beads
- 6.1. Market Analysis, Insights and Forecast - by Application
- 7. South America Reflective Beads Analysis, Insights and Forecast, 2020-2032
- 7.1. Market Analysis, Insights and Forecast - by Application
- 7.1.1. Transportation Field
- 7.1.2. Safety Protection
- 7.1.3. Others
- 7.2. Market Analysis, Insights and Forecast - by Types
- 7.2.1. Glass Reflective Beads
- 7.2.2. Plastic Reflective Beads
- 7.1. Market Analysis, Insights and Forecast - by Application
- 8. Europe Reflective Beads Analysis, Insights and Forecast, 2020-2032
- 8.1. Market Analysis, Insights and Forecast - by Application
- 8.1.1. Transportation Field
- 8.1.2. Safety Protection
- 8.1.3. Others
- 8.2. Market Analysis, Insights and Forecast - by Types
- 8.2.1. Glass Reflective Beads
- 8.2.2. Plastic Reflective Beads
- 8.1. Market Analysis, Insights and Forecast - by Application
- 9. Middle East & Africa Reflective Beads Analysis, Insights and Forecast, 2020-2032
- 9.1. Market Analysis, Insights and Forecast - by Application
- 9.1.1. Transportation Field
- 9.1.2. Safety Protection
- 9.1.3. Others
- 9.2. Market Analysis, Insights and Forecast - by Types
- 9.2.1. Glass Reflective Beads
- 9.2.2. Plastic Reflective Beads
- 9.1. Market Analysis, Insights and Forecast - by Application
- 10. Asia Pacific Reflective Beads Analysis, Insights and Forecast, 2020-2032
- 10.1. Market Analysis, Insights and Forecast - by Application
- 10.1.1. Transportation Field
- 10.1.2. Safety Protection
- 10.1.3. Others
- 10.2. Market Analysis, Insights and Forecast - by Types
- 10.2.1. Glass Reflective Beads
- 10.2.2. Plastic Reflective Beads
- 10.1. Market Analysis, Insights and Forecast - by Application
- 11. Competitive Analysis
- 11.1. Global Market Share Analysis 2025
- 11.2. Company Profiles
- 11.2.1 SWARCO
- 11.2.1.1. Overview
- 11.2.1.2. Products
- 11.2.1.3. SWOT Analysis
- 11.2.1.4. Recent Developments
- 11.2.1.5. Financials (Based on Availability)
- 11.2.2 Potters Beads
- 11.2.2.1. Overview
- 11.2.2.2. Products
- 11.2.2.3. SWOT Analysis
- 11.2.2.4. Recent Developments
- 11.2.2.5. Financials (Based on Availability)
- 11.2.3 JINSO BEADS
- 11.2.3.1. Overview
- 11.2.3.2. Products
- 11.2.3.3. SWOT Analysis
- 11.2.3.4. Recent Developments
- 11.2.3.5. Financials (Based on Availability)
- 11.2.4 PROMAX Industries
- 11.2.4.1. Overview
- 11.2.4.2. Products
- 11.2.4.3. SWOT Analysis
- 11.2.4.4. Recent Developments
- 11.2.4.5. Financials (Based on Availability)
- 11.2.5 Unitika
- 11.2.5.1. Overview
- 11.2.5.2. Products
- 11.2.5.3. SWOT Analysis
- 11.2.5.4. Recent Developments
- 11.2.5.5. Financials (Based on Availability)
- 11.2.6 Blastrite
- 11.2.6.1. Overview
- 11.2.6.2. Products
- 11.2.6.3. SWOT Analysis
- 11.2.6.4. Recent Developments
- 11.2.6.5. Financials (Based on Availability)
- 11.2.7 Transline Industries
- 11.2.7.1. Overview
- 11.2.7.2. Products
- 11.2.7.3. SWOT Analysis
- 11.2.7.4. Recent Developments
- 11.2.7.5. Financials (Based on Availability)
- 11.2.8 STRAMAT Vertriebs
- 11.2.8.1. Overview
- 11.2.8.2. Products
- 11.2.8.3. SWOT Analysis
- 11.2.8.4. Recent Developments
- 11.2.8.5. Financials (Based on Availability)
- 11.2.9 Specialized Coating Systems
- 11.2.9.1. Overview
- 11.2.9.2. Products
- 11.2.9.3. SWOT Analysis
- 11.2.9.4. Recent Developments
- 11.2.9.5. Financials (Based on Availability)
- 11.2.10 Lightentraffic
- 11.2.10.1. Overview
- 11.2.10.2. Products
- 11.2.10.3. SWOT Analysis
- 11.2.10.4. Recent Developments
- 11.2.10.5. Financials (Based on Availability)
- 11.2.11 Yongqing Tongcheng Glass Products
- 11.2.11.1. Overview
- 11.2.11.2. Products
- 11.2.11.3. SWOT Analysis
- 11.2.11.4. Recent Developments
- 11.2.11.5. Financials (Based on Availability)
- 11.2.12 Anhui Tory Materials Technology
- 11.2.12.1. Overview
- 11.2.12.2. Products
- 11.2.12.3. SWOT Analysis
- 11.2.12.4. Recent Developments
- 11.2.12.5. Financials (Based on Availability)
- 11.2.13 Nanjing Roadsky Traffic Facility
- 11.2.13.1. Overview
- 11.2.13.2. Products
- 11.2.13.3. SWOT Analysis
- 11.2.13.4. Recent Developments
- 11.2.13.5. Financials (Based on Availability)
- 11.2.14 Guangdong Hua Qun Traffic Facilities
- 11.2.14.1. Overview
- 11.2.14.2. Products
- 11.2.14.3. SWOT Analysis
- 11.2.14.4. Recent Developments
- 11.2.14.5. Financials (Based on Availability)
- 11.2.1 SWARCO
List of Figures
- Figure 1: Global Reflective Beads Revenue Breakdown (million, %) by Region 2025 & 2033
- Figure 2: Global Reflective Beads Volume Breakdown (K, %) by Region 2025 & 2033
- Figure 3: North America Reflective Beads Revenue (million), by Application 2025 & 2033
- Figure 4: North America Reflective Beads Volume (K), by Application 2025 & 2033
- Figure 5: North America Reflective Beads Revenue Share (%), by Application 2025 & 2033
- Figure 6: North America Reflective Beads Volume Share (%), by Application 2025 & 2033
- Figure 7: North America Reflective Beads Revenue (million), by Types 2025 & 2033
- Figure 8: North America Reflective Beads Volume (K), by Types 2025 & 2033
- Figure 9: North America Reflective Beads Revenue Share (%), by Types 2025 & 2033
- Figure 10: North America Reflective Beads Volume Share (%), by Types 2025 & 2033
- Figure 11: North America Reflective Beads Revenue (million), by Country 2025 & 2033
- Figure 12: North America Reflective Beads Volume (K), by Country 2025 & 2033
- Figure 13: North America Reflective Beads Revenue Share (%), by Country 2025 & 2033
- Figure 14: North America Reflective Beads Volume Share (%), by Country 2025 & 2033
- Figure 15: South America Reflective Beads Revenue (million), by Application 2025 & 2033
- Figure 16: South America Reflective Beads Volume (K), by Application 2025 & 2033
- Figure 17: South America Reflective Beads Revenue Share (%), by Application 2025 & 2033
- Figure 18: South America Reflective Beads Volume Share (%), by Application 2025 & 2033
- Figure 19: South America Reflective Beads Revenue (million), by Types 2025 & 2033
- Figure 20: South America Reflective Beads Volume (K), by Types 2025 & 2033
- Figure 21: South America Reflective Beads Revenue Share (%), by Types 2025 & 2033
- Figure 22: South America Reflective Beads Volume Share (%), by Types 2025 & 2033
- Figure 23: South America Reflective Beads Revenue (million), by Country 2025 & 2033
- Figure 24: South America Reflective Beads Volume (K), by Country 2025 & 2033
- Figure 25: South America Reflective Beads Revenue Share (%), by Country 2025 & 2033
- Figure 26: South America Reflective Beads Volume Share (%), by Country 2025 & 2033
- Figure 27: Europe Reflective Beads Revenue (million), by Application 2025 & 2033
- Figure 28: Europe Reflective Beads Volume (K), by Application 2025 & 2033
- Figure 29: Europe Reflective Beads Revenue Share (%), by Application 2025 & 2033
- Figure 30: Europe Reflective Beads Volume Share (%), by Application 2025 & 2033
- Figure 31: Europe Reflective Beads Revenue (million), by Types 2025 & 2033
- Figure 32: Europe Reflective Beads Volume (K), by Types 2025 & 2033
- Figure 33: Europe Reflective Beads Revenue Share (%), by Types 2025 & 2033
- Figure 34: Europe Reflective Beads Volume Share (%), by Types 2025 & 2033
- Figure 35: Europe Reflective Beads Revenue (million), by Country 2025 & 2033
- Figure 36: Europe Reflective Beads Volume (K), by Country 2025 & 2033
- Figure 37: Europe Reflective Beads Revenue Share (%), by Country 2025 & 2033
- Figure 38: Europe Reflective Beads Volume Share (%), by Country 2025 & 2033
- Figure 39: Middle East & Africa Reflective Beads Revenue (million), by Application 2025 & 2033
- Figure 40: Middle East & Africa Reflective Beads Volume (K), by Application 2025 & 2033
- Figure 41: Middle East & Africa Reflective Beads Revenue Share (%), by Application 2025 & 2033
- Figure 42: Middle East & Africa Reflective Beads Volume Share (%), by Application 2025 & 2033
- Figure 43: Middle East & Africa Reflective Beads Revenue (million), by Types 2025 & 2033
- Figure 44: Middle East & Africa Reflective Beads Volume (K), by Types 2025 & 2033
- Figure 45: Middle East & Africa Reflective Beads Revenue Share (%), by Types 2025 & 2033
- Figure 46: Middle East & Africa Reflective Beads Volume Share (%), by Types 2025 & 2033
- Figure 47: Middle East & Africa Reflective Beads Revenue (million), by Country 2025 & 2033
- Figure 48: Middle East & Africa Reflective Beads Volume (K), by Country 2025 & 2033
- Figure 49: Middle East & Africa Reflective Beads Revenue Share (%), by Country 2025 & 2033
- Figure 50: Middle East & Africa Reflective Beads Volume Share (%), by Country 2025 & 2033
- Figure 51: Asia Pacific Reflective Beads Revenue (million), by Application 2025 & 2033
- Figure 52: Asia Pacific Reflective Beads Volume (K), by Application 2025 & 2033
- Figure 53: Asia Pacific Reflective Beads Revenue Share (%), by Application 2025 & 2033
- Figure 54: Asia Pacific Reflective Beads Volume Share (%), by Application 2025 & 2033
- Figure 55: Asia Pacific Reflective Beads Revenue (million), by Types 2025 & 2033
- Figure 56: Asia Pacific Reflective Beads Volume (K), by Types 2025 & 2033
- Figure 57: Asia Pacific Reflective Beads Revenue Share (%), by Types 2025 & 2033
- Figure 58: Asia Pacific Reflective Beads Volume Share (%), by Types 2025 & 2033
- Figure 59: Asia Pacific Reflective Beads Revenue (million), by Country 2025 & 2033
- Figure 60: Asia Pacific Reflective Beads Volume (K), by Country 2025 & 2033
- Figure 61: Asia Pacific Reflective Beads Revenue Share (%), by Country 2025 & 2033
- Figure 62: Asia Pacific Reflective Beads Volume Share (%), by Country 2025 & 2033
List of Tables
- Table 1: Global Reflective Beads Revenue million Forecast, by Application 2020 & 2033
- Table 2: Global Reflective Beads Volume K Forecast, by Application 2020 & 2033
- Table 3: Global Reflective Beads Revenue million Forecast, by Types 2020 & 2033
- Table 4: Global Reflective Beads Volume K Forecast, by Types 2020 & 2033
- Table 5: Global Reflective Beads Revenue million Forecast, by Region 2020 & 2033
- Table 6: Global Reflective Beads Volume K Forecast, by Region 2020 & 2033
- Table 7: Global Reflective Beads Revenue million Forecast, by Application 2020 & 2033
- Table 8: Global Reflective Beads Volume K Forecast, by Application 2020 & 2033
- Table 9: Global Reflective Beads Revenue million Forecast, by Types 2020 & 2033
- Table 10: Global Reflective Beads Volume K Forecast, by Types 2020 & 2033
- Table 11: Global Reflective Beads Revenue million Forecast, by Country 2020 & 2033
- Table 12: Global Reflective Beads Volume K Forecast, by Country 2020 & 2033
- Table 13: United States Reflective Beads Revenue (million) Forecast, by Application 2020 & 2033
- Table 14: United States Reflective Beads Volume (K) Forecast, by Application 2020 & 2033
- Table 15: Canada Reflective Beads Revenue (million) Forecast, by Application 2020 & 2033
- Table 16: Canada Reflective Beads Volume (K) Forecast, by Application 2020 & 2033
- Table 17: Mexico Reflective Beads Revenue (million) Forecast, by Application 2020 & 2033
- Table 18: Mexico Reflective Beads Volume (K) Forecast, by Application 2020 & 2033
- Table 19: Global Reflective Beads Revenue million Forecast, by Application 2020 & 2033
- Table 20: Global Reflective Beads Volume K Forecast, by Application 2020 & 2033
- Table 21: Global Reflective Beads Revenue million Forecast, by Types 2020 & 2033
- Table 22: Global Reflective Beads Volume K Forecast, by Types 2020 & 2033
- Table 23: Global Reflective Beads Revenue million Forecast, by Country 2020 & 2033
- Table 24: Global Reflective Beads Volume K Forecast, by Country 2020 & 2033
- Table 25: Brazil Reflective Beads Revenue (million) Forecast, by Application 2020 & 2033
- Table 26: Brazil Reflective Beads Volume (K) Forecast, by Application 2020 & 2033
- Table 27: Argentina Reflective Beads Revenue (million) Forecast, by Application 2020 & 2033
- Table 28: Argentina Reflective Beads Volume (K) Forecast, by Application 2020 & 2033
- Table 29: Rest of South America Reflective Beads Revenue (million) Forecast, by Application 2020 & 2033
- Table 30: Rest of South America Reflective Beads Volume (K) Forecast, by Application 2020 & 2033
- Table 31: Global Reflective Beads Revenue million Forecast, by Application 2020 & 2033
- Table 32: Global Reflective Beads Volume K Forecast, by Application 2020 & 2033
- Table 33: Global Reflective Beads Revenue million Forecast, by Types 2020 & 2033
- Table 34: Global Reflective Beads Volume K Forecast, by Types 2020 & 2033
- Table 35: Global Reflective Beads Revenue million Forecast, by Country 2020 & 2033
- Table 36: Global Reflective Beads Volume K Forecast, by Country 2020 & 2033
- Table 37: United Kingdom Reflective Beads Revenue (million) Forecast, by Application 2020 & 2033
- Table 38: United Kingdom Reflective Beads Volume (K) Forecast, by Application 2020 & 2033
- Table 39: Germany Reflective Beads Revenue (million) Forecast, by Application 2020 & 2033
- Table 40: Germany Reflective Beads Volume (K) Forecast, by Application 2020 & 2033
- Table 41: France Reflective Beads Revenue (million) Forecast, by Application 2020 & 2033
- Table 42: France Reflective Beads Volume (K) Forecast, by Application 2020 & 2033
- Table 43: Italy Reflective Beads Revenue (million) Forecast, by Application 2020 & 2033
- Table 44: Italy Reflective Beads Volume (K) Forecast, by Application 2020 & 2033
- Table 45: Spain Reflective Beads Revenue (million) Forecast, by Application 2020 & 2033
- Table 46: Spain Reflective Beads Volume (K) Forecast, by Application 2020 & 2033
- Table 47: Russia Reflective Beads Revenue (million) Forecast, by Application 2020 & 2033
- Table 48: Russia Reflective Beads Volume (K) Forecast, by Application 2020 & 2033
- Table 49: Benelux Reflective Beads Revenue (million) Forecast, by Application 2020 & 2033
- Table 50: Benelux Reflective Beads Volume (K) Forecast, by Application 2020 & 2033
- Table 51: Nordics Reflective Beads Revenue (million) Forecast, by Application 2020 & 2033
- Table 52: Nordics Reflective Beads Volume (K) Forecast, by Application 2020 & 2033
- Table 53: Rest of Europe Reflective Beads Revenue (million) Forecast, by Application 2020 & 2033
- Table 54: Rest of Europe Reflective Beads Volume (K) Forecast, by Application 2020 & 2033
- Table 55: Global Reflective Beads Revenue million Forecast, by Application 2020 & 2033
- Table 56: Global Reflective Beads Volume K Forecast, by Application 2020 & 2033
- Table 57: Global Reflective Beads Revenue million Forecast, by Types 2020 & 2033
- Table 58: Global Reflective Beads Volume K Forecast, by Types 2020 & 2033
- Table 59: Global Reflective Beads Revenue million Forecast, by Country 2020 & 2033
- Table 60: Global Reflective Beads Volume K Forecast, by Country 2020 & 2033
- Table 61: Turkey Reflective Beads Revenue (million) Forecast, by Application 2020 & 2033
- Table 62: Turkey Reflective Beads Volume (K) Forecast, by Application 2020 & 2033
- Table 63: Israel Reflective Beads Revenue (million) Forecast, by Application 2020 & 2033
- Table 64: Israel Reflective Beads Volume (K) Forecast, by Application 2020 & 2033
- Table 65: GCC Reflective Beads Revenue (million) Forecast, by Application 2020 & 2033
- Table 66: GCC Reflective Beads Volume (K) Forecast, by Application 2020 & 2033
- Table 67: North Africa Reflective Beads Revenue (million) Forecast, by Application 2020 & 2033
- Table 68: North Africa Reflective Beads Volume (K) Forecast, by Application 2020 & 2033
- Table 69: South Africa Reflective Beads Revenue (million) Forecast, by Application 2020 & 2033
- Table 70: South Africa Reflective Beads Volume (K) Forecast, by Application 2020 & 2033
- Table 71: Rest of Middle East & Africa Reflective Beads Revenue (million) Forecast, by Application 2020 & 2033
- Table 72: Rest of Middle East & Africa Reflective Beads Volume (K) Forecast, by Application 2020 & 2033
- Table 73: Global Reflective Beads Revenue million Forecast, by Application 2020 & 2033
- Table 74: Global Reflective Beads Volume K Forecast, by Application 2020 & 2033
- Table 75: Global Reflective Beads Revenue million Forecast, by Types 2020 & 2033
- Table 76: Global Reflective Beads Volume K Forecast, by Types 2020 & 2033
- Table 77: Global Reflective Beads Revenue million Forecast, by Country 2020 & 2033
- Table 78: Global Reflective Beads Volume K Forecast, by Country 2020 & 2033
- Table 79: China Reflective Beads Revenue (million) Forecast, by Application 2020 & 2033
- Table 80: China Reflective Beads Volume (K) Forecast, by Application 2020 & 2033
- Table 81: India Reflective Beads Revenue (million) Forecast, by Application 2020 & 2033
- Table 82: India Reflective Beads Volume (K) Forecast, by Application 2020 & 2033
- Table 83: Japan Reflective Beads Revenue (million) Forecast, by Application 2020 & 2033
- Table 84: Japan Reflective Beads Volume (K) Forecast, by Application 2020 & 2033
- Table 85: South Korea Reflective Beads Revenue (million) Forecast, by Application 2020 & 2033
- Table 86: South Korea Reflective Beads Volume (K) Forecast, by Application 2020 & 2033
- Table 87: ASEAN Reflective Beads Revenue (million) Forecast, by Application 2020 & 2033
- Table 88: ASEAN Reflective Beads Volume (K) Forecast, by Application 2020 & 2033
- Table 89: Oceania Reflective Beads Revenue (million) Forecast, by Application 2020 & 2033
- Table 90: Oceania Reflective Beads Volume (K) Forecast, by Application 2020 & 2033
- Table 91: Rest of Asia Pacific Reflective Beads Revenue (million) Forecast, by Application 2020 & 2033
- Table 92: Rest of Asia Pacific Reflective Beads Volume (K) Forecast, by Application 2020 & 2033
Frequently Asked Questions
1. What is the projected Compound Annual Growth Rate (CAGR) of the Reflective Beads?
The projected CAGR is approximately 3.5%.
2. Which companies are prominent players in the Reflective Beads?
Key companies in the market include SWARCO, Potters Beads, JINSO BEADS, PROMAX Industries, Unitika, Blastrite, Transline Industries, STRAMAT Vertriebs, Specialized Coating Systems, Lightentraffic, Yongqing Tongcheng Glass Products, Anhui Tory Materials Technology, Nanjing Roadsky Traffic Facility, Guangdong Hua Qun Traffic Facilities.
3. What are the main segments of the Reflective Beads?
The market segments include Application, Types.
4. Can you provide details about the market size?
The market size is estimated to be USD 4936 million as of 2022.
5. What are some drivers contributing to market growth?
N/A
6. What are the notable trends driving market growth?
N/A
7. Are there any restraints impacting market growth?
N/A
8. Can you provide examples of recent developments in the market?
N/A
9. What pricing options are available for accessing the report?
Pricing options include single-user, multi-user, and enterprise licenses priced at USD 4350.00, USD 6525.00, and USD 8700.00 respectively.
10. Is the market size provided in terms of value or volume?
The market size is provided in terms of value, measured in million and volume, measured in K.
11. Are there any specific market keywords associated with the report?
Yes, the market keyword associated with the report is "Reflective Beads," which aids in identifying and referencing the specific market segment covered.
12. How do I determine which pricing option suits my needs best?
The pricing options vary based on user requirements and access needs. Individual users may opt for single-user licenses, while businesses requiring broader access may choose multi-user or enterprise licenses for cost-effective access to the report.
13. Are there any additional resources or data provided in the Reflective Beads report?
While the report offers comprehensive insights, it's advisable to review the specific contents or supplementary materials provided to ascertain if additional resources or data are available.
14. How can I stay updated on further developments or reports in the Reflective Beads?
To stay informed about further developments, trends, and reports in the Reflective Beads, consider subscribing to industry newsletters, following relevant companies and organizations, or regularly checking reputable industry news sources and publications.
Methodology
Step 1 - Identification of Relevant Samples Size from Population Database


Step 2 - Approaches for Defining Global Market Size (Value, Volume* & Price*)

Note*: In applicable scenarios
Step 3 - Data Sources
Primary Research
- Web Analytics
- Survey Reports
- Research Institute
- Latest Research Reports
- Opinion Leaders
Secondary Research
- Annual Reports
- White Paper
- Latest Press Release
- Industry Association
- Paid Database
- Investor Presentations

Step 4 - Data Triangulation
Involves using different sources of information in order to increase the validity of a study
These sources are likely to be stakeholders in a program - participants, other researchers, program staff, other community members, and so on.
Then we put all data in single framework & apply various statistical tools to find out the dynamic on the market.
During the analysis stage, feedback from the stakeholder groups would be compared to determine areas of agreement as well as areas of divergence