

Key Insights
The Oil and Gas Magnetic Ranging Market is projected for significant expansion, driven by the imperative for precise wellbore placement and directional drilling in both onshore and offshore oil and gas operations. This growth is underpinned by the ongoing demand for enhanced operational efficiency, cost reduction, and elevated safety standards in hydrocarbon extraction. Continuous innovation in magnetic ranging technologies, delivering superior accuracy and real-time data capabilities, is a key catalyst for market acceleration. Furthermore, the escalating exploration and production activities in unconventional reserves, such as shale gas and tight oil, significantly contribute to market demand. Despite potential regulatory challenges and environmental considerations, the market outlook remains exceptionally strong. The market is anticipated to achieve a Compound Annual Growth Rate (CAGR) of 8.8%, reaching a market size of 580 million by 2024. Geographically, North America and Europe currently lead market share, benefiting from mature oil and gas infrastructure and sustained exploration initiatives. However, the Asia-Pacific region is poised for substantial growth, propelled by rapid industrialization and escalating energy requirements. Leading industry participants, including Halliburton, Weatherford, and Schlumberger, are strategically investing in research and development and pursuing acquisitions to solidify their market dominance. The onshore segment currently represents a larger share, with both onshore and offshore sectors expected to exhibit consistent growth, reflecting the universal need for accurate wellbore navigation across diverse drilling environments.
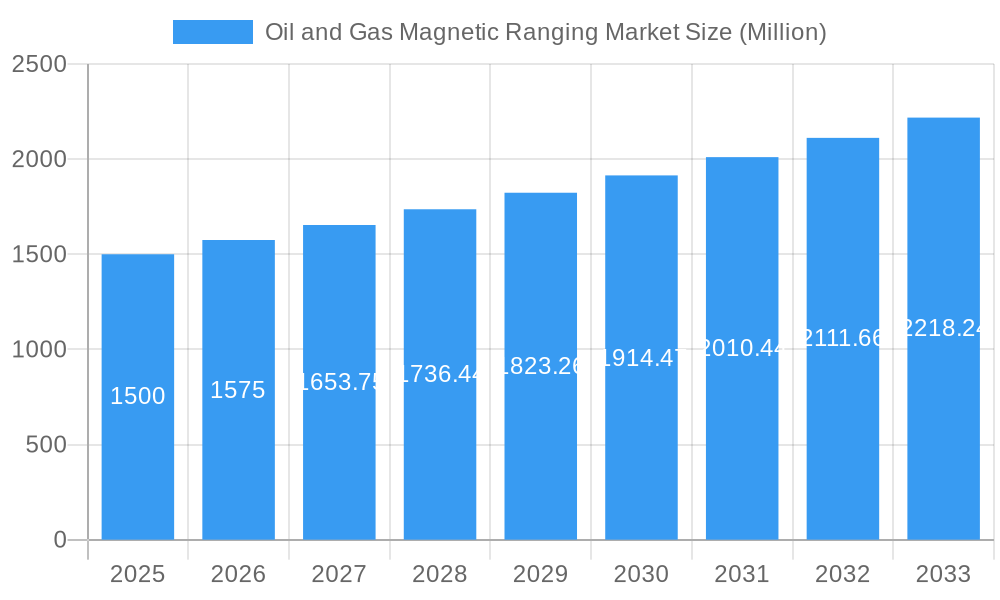
Oil and Gas Magnetic Ranging Market Market Size (In Million)
The competitive arena is defined by a blend of established global corporations and specialized service providers, all offering a comprehensive suite of magnetic ranging solutions encompassing hardware, software, and associated services. Competition centers on technological superiority, competitive pricing, and the capacity to deliver bespoke, end-to-end solutions. Future market trajectory will be shaped by ongoing technological advancements in magnetic ranging, the discovery and development of new hydrocarbon reserves, and the overall vitality of the global energy sector. A persistent commitment to improving drilling efficiency and minimizing environmental impact will be paramount in defining the future trajectory of the Oil and Gas Magnetic Ranging Market.
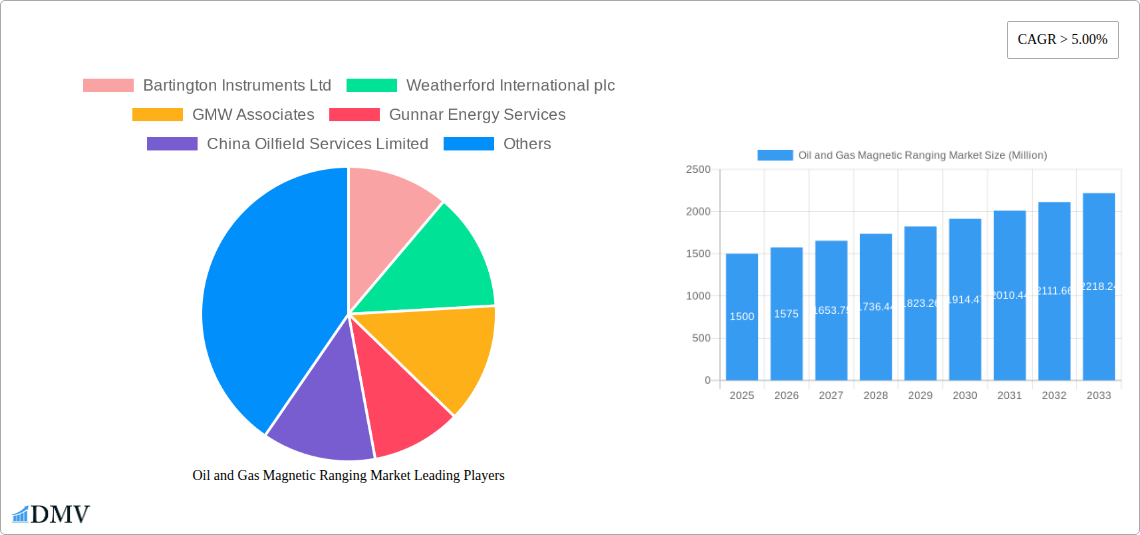
Oil and Gas Magnetic Ranging Market Company Market Share
Oil and Gas Magnetic Ranging Market: A Comprehensive Analysis (2019-2033)
This insightful report provides a detailed analysis of the Oil and Gas Magnetic Ranging Market, offering a comprehensive overview of market trends, leading players, and future growth prospects. Covering the period from 2019 to 2033, with a base year of 2025 and a forecast period of 2025-2033, this report is an essential resource for stakeholders seeking to understand and capitalize on opportunities within this dynamic sector. The market is valued at xx Million in 2025 and is projected to reach xx Million by 2033, exhibiting a CAGR of xx% during the forecast period.
Oil and Gas Magnetic Ranging Market Composition & Trends
This section delves into the intricate dynamics of the Oil and Gas Magnetic Ranging Market. We examine market concentration, revealing a moderately fragmented landscape with key players like Bartington Instruments Ltd, Weatherford International plc, and Halliburton Company holding significant but not dominant market share. We estimate that the top 5 players account for approximately xx% of the market share in 2025. Innovation within the sector is driven primarily by the demand for enhanced accuracy, efficiency, and reduced operational costs in drilling and well completion. Stringent safety regulations and environmental concerns also shape the market trajectory. Substitute technologies, while present, currently lack the precision and reliability offered by magnetic ranging systems.
- Market Share Distribution (2025): Top 5 players: xx%, Others: xx%
- M&A Activity (2019-2024): xx deals totaling approximately xx Million in value, primarily focused on technology integration and geographic expansion.
- End-User Profiles: Primarily oil and gas exploration and production companies, with increasing adoption by service providers.
- Regulatory Landscape: Stringent safety and environmental regulations influence technology adoption and operational practices.
Oil and Gas Magnetic Ranging Market Industry Evolution
The Oil and Gas Magnetic Ranging Market has witnessed significant evolution since 2019. Driven by technological advancements, particularly in sensor technology and data analytics, the market has experienced periods of growth and contraction mirroring the overall oil and gas sector's performance. The historical period (2019-2024) saw fluctuating growth rates, influenced by oil price volatility and global economic conditions. The adoption of advanced magnetic ranging systems, offering enhanced precision and real-time data processing, is accelerating, particularly in offshore operations. Consumer demand is geared towards systems that offer improved reliability, reduced downtime, and enhanced safety features. The forecast period (2025-2033) anticipates sustained growth driven by increasing exploration and production activities, particularly in regions with challenging geological conditions.
- Growth Rate (2019-2024): xx% CAGR (fluctuating annually)
- Growth Rate (2025-2033): Projected xx% CAGR
- Adoption Rate of Advanced Systems (2025): xx%
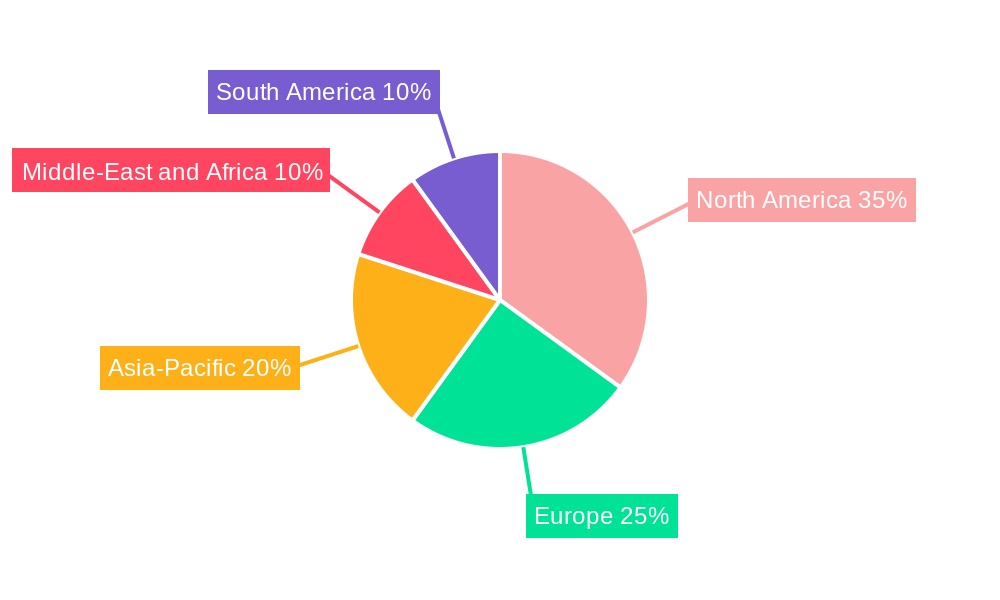
Leading Regions, Countries, or Segments in Oil and Gas Magnetic Ranging Market
North America currently holds the largest market share, driven by significant oil and gas exploration and production activities and a robust technological ecosystem. However, the Asia-Pacific region is poised for substantial growth due to significant investments in oil and gas infrastructure development. Offshore deployments command a higher price point than onshore applications and are driving premium market segment growth.
Key Drivers:
- North America: High level of exploration and production activity, presence of major market players, and robust technological innovation.
- Asia-Pacific: Significant investments in oil and gas infrastructure, growing energy demand, and favorable government policies.
- Offshore Segment: Demand for enhanced accuracy and reliability in challenging marine environments justifies higher cost of systems.
Dominance Factors: The dominance of North America is attributed to a combination of established technological expertise, strong regulatory frameworks supporting innovation, and substantial investments in oil and gas exploration. The Asia-Pacific region's potential lies in its rapidly developing energy infrastructure and increasing demand for advanced technologies.
Oil and Gas Magnetic Ranging Market Product Innovations
Recent innovations have focused on improving the accuracy, reliability, and efficiency of magnetic ranging systems. Miniaturization of sensors, the incorporation of advanced data processing algorithms, and improved integration with other drilling and completion technologies are key features. These innovations translate to reduced operational costs, enhanced safety, and increased productivity for oil and gas operators. Unique selling propositions often center around real-time data visualization, improved sensor accuracy in challenging environments, and robust data analytics capabilities.
Propelling Factors for Oil and Gas Magnetic Ranging Market Growth
Several factors are driving market growth. Technological advancements, particularly in sensor technology and data analytics, are continuously improving the accuracy, efficiency, and reliability of magnetic ranging systems. The increasing demand for efficient and safe drilling operations, especially in complex geological environments, creates a strong impetus for adoption. Government regulations promoting safety and environmental protection also play a crucial role.
Obstacles in the Oil and Gas Magnetic Ranging Market
The market faces challenges including the volatility of oil prices, which can impact investment decisions. Supply chain disruptions and the availability of critical components can also affect production and delivery. Intense competition among established players and new entrants presents another significant barrier.
Future Opportunities in Oil and Gas Magnetic Ranging Market
Emerging opportunities include the expansion into new geographic markets, particularly in developing economies with growing energy demands. Further technological advancements, such as the development of more robust and cost-effective sensors and the integration of artificial intelligence for improved data interpretation, present significant growth avenues.
Major Players in the Oil and Gas Magnetic Ranging Market Ecosystem
- Bartington Instruments Ltd
- Weatherford International plc
- GMW Associates
- Gunnar Energy Services
- China Oilfield Services Limited
- Halliburton Company
- Prime Horizontal Group of Companies
- Scientific Drilling International Inc
Key Developments in Oil and Gas Magnetic Ranging Market Industry
- 2022 Q3: Halliburton Company launched a new generation of magnetic ranging system with enhanced accuracy.
- 2023 Q1: Weatherford International plc announced a strategic partnership to expand its geographic reach.
- 2024 Q2: Bartington Instruments Ltd. secured a significant contract for offshore operations.
Strategic Oil and Gas Magnetic Ranging Market Forecast
The Oil and Gas Magnetic Ranging Market is poised for substantial growth over the forecast period. Technological advancements, coupled with increasing demand for efficient and safe drilling operations, will drive market expansion. New market entries and strategic partnerships will further contribute to the growth trajectory. The market's future is bright, with significant opportunities for innovation and expansion.
Oil and Gas Magnetic Ranging Market Segmentation
-
1. Location of Deployment
- 1.1. Offshore
- 1.2. Onshore
-
2. Geogrpahy
- 2.1. North America
- 2.2. Europe
- 2.3. Asia-Pacific
- 2.4. Middle-East and Africa
- 2.5. South America
Oil and Gas Magnetic Ranging Market Segmentation By Geography
-
1. North America
- 1.1. United States
- 1.2. Canada
- 1.3. Mexico
-
2. South America
- 2.1. Brazil
- 2.2. Argentina
- 2.3. Rest of South America
-
3. Europe
- 3.1. United Kingdom
- 3.2. Germany
- 3.3. France
- 3.4. Italy
- 3.5. Spain
- 3.6. Russia
- 3.7. Benelux
- 3.8. Nordics
- 3.9. Rest of Europe
-
4. Middle East & Africa
- 4.1. Turkey
- 4.2. Israel
- 4.3. GCC
- 4.4. North Africa
- 4.5. South Africa
- 4.6. Rest of Middle East & Africa
-
5. Asia Pacific
- 5.1. China
- 5.2. India
- 5.3. Japan
- 5.4. South Korea
- 5.5. ASEAN
- 5.6. Oceania
- 5.7. Rest of Asia Pacific
Oil and Gas Magnetic Ranging Market Regional Market Share
Geographic Coverage of Oil and Gas Magnetic Ranging Market
Oil and Gas Magnetic Ranging Market REPORT HIGHLIGHTS
| Aspects | Details |
|---|---|
| Study Period | 2020-2034 |
| Base Year | 2025 |
| Estimated Year | 2026 |
| Forecast Period | 2026-2034 |
| Historical Period | 2020-2025 |
| Growth Rate | CAGR of 8.8% from 2020-2034 |
| Segmentation |
|
Table of Contents
- 1. Introduction
- 1.1. Research Scope
- 1.2. Market Segmentation
- 1.3. Research Objective
- 1.4. Definitions and Assumptions
- 2. Executive Summary
- 2.1. Market Snapshot
- 3. Market Dynamics
- 3.1. Market Drivers
- 3.2. Market Restrains
- 3.3. Market Trends
- 3.4. Market Opportunities
- 4. Market Factor Analysis
- 4.1. Porters Five Forces
- 4.1.1. Bargaining Power of Suppliers
- 4.1.2. Bargaining Power of Buyers
- 4.1.3. Threat of New Entrants
- 4.1.4. Threat of Substitutes
- 4.1.5. Competitive Rivalry
- 4.2. PESTEL analysis
- 4.3. BCG Analysis
- 4.3.1. Stars (High Growth, High Market Share)
- 4.3.2. Cash Cows (Low Growth, High Market Share)
- 4.3.3. Question Mark (High Growth, Low Market Share)
- 4.3.4. Dogs (Low Growth, Low Market Share)
- 4.4. Ansoff Matrix Analysis
- 4.5. Supply Chain Analysis
- 4.6. Regulatory Landscape
- 4.7. Current Market Potential and Opportunity Assessment (TAM–SAM–SOM Framework)
- 4.8. DMV Analyst Note
- 4.1. Porters Five Forces
- 5. Market Analysis, Insights and Forecast 2021-2033
- 5.1. Market Analysis, Insights and Forecast - by Location of Deployment
- 5.1.1. Offshore
- 5.1.2. Onshore
- 5.2. Market Analysis, Insights and Forecast - by Geogrpahy
- 5.2.1. North America
- 5.2.2. Europe
- 5.2.3. Asia-Pacific
- 5.2.4. Middle-East and Africa
- 5.2.5. South America
- 5.3. Market Analysis, Insights and Forecast - by Region
- 5.3.1. North America
- 5.3.2. South America
- 5.3.3. Europe
- 5.3.4. Middle East & Africa
- 5.3.5. Asia Pacific
- 5.1. Market Analysis, Insights and Forecast - by Location of Deployment
- 6. Global Oil and Gas Magnetic Ranging Market Analysis, Insights and Forecast, 2021-2033
- 6.1. Market Analysis, Insights and Forecast - by Location of Deployment
- 6.1.1. Offshore
- 6.1.2. Onshore
- 6.2. Market Analysis, Insights and Forecast - by Geogrpahy
- 6.2.1. North America
- 6.2.2. Europe
- 6.2.3. Asia-Pacific
- 6.2.4. Middle-East and Africa
- 6.2.5. South America
- 6.1. Market Analysis, Insights and Forecast - by Location of Deployment
- 7. North America Oil and Gas Magnetic Ranging Market Analysis, Insights and Forecast, 2020-2032
- 7.1. Market Analysis, Insights and Forecast - by Location of Deployment
- 7.1.1. Offshore
- 7.1.2. Onshore
- 7.2. Market Analysis, Insights and Forecast - by Geogrpahy
- 7.2.1. North America
- 7.2.2. Europe
- 7.2.3. Asia-Pacific
- 7.2.4. Middle-East and Africa
- 7.2.5. South America
- 7.1. Market Analysis, Insights and Forecast - by Location of Deployment
- 8. South America Oil and Gas Magnetic Ranging Market Analysis, Insights and Forecast, 2020-2032
- 8.1. Market Analysis, Insights and Forecast - by Location of Deployment
- 8.1.1. Offshore
- 8.1.2. Onshore
- 8.2. Market Analysis, Insights and Forecast - by Geogrpahy
- 8.2.1. North America
- 8.2.2. Europe
- 8.2.3. Asia-Pacific
- 8.2.4. Middle-East and Africa
- 8.2.5. South America
- 8.1. Market Analysis, Insights and Forecast - by Location of Deployment
- 9. Europe Oil and Gas Magnetic Ranging Market Analysis, Insights and Forecast, 2020-2032
- 9.1. Market Analysis, Insights and Forecast - by Location of Deployment
- 9.1.1. Offshore
- 9.1.2. Onshore
- 9.2. Market Analysis, Insights and Forecast - by Geogrpahy
- 9.2.1. North America
- 9.2.2. Europe
- 9.2.3. Asia-Pacific
- 9.2.4. Middle-East and Africa
- 9.2.5. South America
- 9.1. Market Analysis, Insights and Forecast - by Location of Deployment
- 10. Middle East & Africa Oil and Gas Magnetic Ranging Market Analysis, Insights and Forecast, 2020-2032
- 10.1. Market Analysis, Insights and Forecast - by Location of Deployment
- 10.1.1. Offshore
- 10.1.2. Onshore
- 10.2. Market Analysis, Insights and Forecast - by Geogrpahy
- 10.2.1. North America
- 10.2.2. Europe
- 10.2.3. Asia-Pacific
- 10.2.4. Middle-East and Africa
- 10.2.5. South America
- 10.1. Market Analysis, Insights and Forecast - by Location of Deployment
- 11. Asia Pacific Oil and Gas Magnetic Ranging Market Analysis, Insights and Forecast, 2020-2032
- 11.1. Market Analysis, Insights and Forecast - by Location of Deployment
- 11.1.1. Offshore
- 11.1.2. Onshore
- 11.2. Market Analysis, Insights and Forecast - by Geogrpahy
- 11.2.1. North America
- 11.2.2. Europe
- 11.2.3. Asia-Pacific
- 11.2.4. Middle-East and Africa
- 11.2.5. South America
- 11.1. Market Analysis, Insights and Forecast - by Location of Deployment
- 12. Competitive Analysis
- 12.1. Company Profiles
- 12.1.1 Bartington Instruments Ltd
- 12.1.1.1. Company Overview
- 12.1.1.2. Products
- 12.1.1.3. Company Financials
- 12.1.1.4. SWOT Analysis
- 12.1.2 Weatherford International plc
- 12.1.2.1. Company Overview
- 12.1.2.2. Products
- 12.1.2.3. Company Financials
- 12.1.2.4. SWOT Analysis
- 12.1.3 GMW Associates
- 12.1.3.1. Company Overview
- 12.1.3.2. Products
- 12.1.3.3. Company Financials
- 12.1.3.4. SWOT Analysis
- 12.1.4 Gunnar Energy Services
- 12.1.4.1. Company Overview
- 12.1.4.2. Products
- 12.1.4.3. Company Financials
- 12.1.4.4. SWOT Analysis
- 12.1.5 China Oilfield Services Limited
- 12.1.5.1. Company Overview
- 12.1.5.2. Products
- 12.1.5.3. Company Financials
- 12.1.5.4. SWOT Analysis
- 12.1.6 Halliburton Company
- 12.1.6.1. Company Overview
- 12.1.6.2. Products
- 12.1.6.3. Company Financials
- 12.1.6.4. SWOT Analysis
- 12.1.7 Prime Horizontal Group of Companies
- 12.1.7.1. Company Overview
- 12.1.7.2. Products
- 12.1.7.3. Company Financials
- 12.1.7.4. SWOT Analysis
- 12.1.8 Scientific Drilling International Inc
- 12.1.8.1. Company Overview
- 12.1.8.2. Products
- 12.1.8.3. Company Financials
- 12.1.8.4. SWOT Analysis
- 12.1.1 Bartington Instruments Ltd
- 12.2. Market Entropy
- 12.2.1 Company's Key Areas Served
- 12.2.2 Recent Developments
- 12.3. Company Market Share Analysis 2025
- 12.3.1 Top 5 Companies Market Share Analysis
- 12.3.2 Top 3 Companies Market Share Analysis
- 12.4. List of Potential Customers
- 13. Research Methodology
List of Figures
- Figure 1: Global Oil and Gas Magnetic Ranging Market Revenue Breakdown (million, %) by Region 2025 & 2033
- Figure 2: North America Oil and Gas Magnetic Ranging Market Revenue (million), by Location of Deployment 2025 & 2033
- Figure 3: North America Oil and Gas Magnetic Ranging Market Revenue Share (%), by Location of Deployment 2025 & 2033
- Figure 4: North America Oil and Gas Magnetic Ranging Market Revenue (million), by Geogrpahy 2025 & 2033
- Figure 5: North America Oil and Gas Magnetic Ranging Market Revenue Share (%), by Geogrpahy 2025 & 2033
- Figure 6: North America Oil and Gas Magnetic Ranging Market Revenue (million), by Country 2025 & 2033
- Figure 7: North America Oil and Gas Magnetic Ranging Market Revenue Share (%), by Country 2025 & 2033
- Figure 8: South America Oil and Gas Magnetic Ranging Market Revenue (million), by Location of Deployment 2025 & 2033
- Figure 9: South America Oil and Gas Magnetic Ranging Market Revenue Share (%), by Location of Deployment 2025 & 2033
- Figure 10: South America Oil and Gas Magnetic Ranging Market Revenue (million), by Geogrpahy 2025 & 2033
- Figure 11: South America Oil and Gas Magnetic Ranging Market Revenue Share (%), by Geogrpahy 2025 & 2033
- Figure 12: South America Oil and Gas Magnetic Ranging Market Revenue (million), by Country 2025 & 2033
- Figure 13: South America Oil and Gas Magnetic Ranging Market Revenue Share (%), by Country 2025 & 2033
- Figure 14: Europe Oil and Gas Magnetic Ranging Market Revenue (million), by Location of Deployment 2025 & 2033
- Figure 15: Europe Oil and Gas Magnetic Ranging Market Revenue Share (%), by Location of Deployment 2025 & 2033
- Figure 16: Europe Oil and Gas Magnetic Ranging Market Revenue (million), by Geogrpahy 2025 & 2033
- Figure 17: Europe Oil and Gas Magnetic Ranging Market Revenue Share (%), by Geogrpahy 2025 & 2033
- Figure 18: Europe Oil and Gas Magnetic Ranging Market Revenue (million), by Country 2025 & 2033
- Figure 19: Europe Oil and Gas Magnetic Ranging Market Revenue Share (%), by Country 2025 & 2033
- Figure 20: Middle East & Africa Oil and Gas Magnetic Ranging Market Revenue (million), by Location of Deployment 2025 & 2033
- Figure 21: Middle East & Africa Oil and Gas Magnetic Ranging Market Revenue Share (%), by Location of Deployment 2025 & 2033
- Figure 22: Middle East & Africa Oil and Gas Magnetic Ranging Market Revenue (million), by Geogrpahy 2025 & 2033
- Figure 23: Middle East & Africa Oil and Gas Magnetic Ranging Market Revenue Share (%), by Geogrpahy 2025 & 2033
- Figure 24: Middle East & Africa Oil and Gas Magnetic Ranging Market Revenue (million), by Country 2025 & 2033
- Figure 25: Middle East & Africa Oil and Gas Magnetic Ranging Market Revenue Share (%), by Country 2025 & 2033
- Figure 26: Asia Pacific Oil and Gas Magnetic Ranging Market Revenue (million), by Location of Deployment 2025 & 2033
- Figure 27: Asia Pacific Oil and Gas Magnetic Ranging Market Revenue Share (%), by Location of Deployment 2025 & 2033
- Figure 28: Asia Pacific Oil and Gas Magnetic Ranging Market Revenue (million), by Geogrpahy 2025 & 2033
- Figure 29: Asia Pacific Oil and Gas Magnetic Ranging Market Revenue Share (%), by Geogrpahy 2025 & 2033
- Figure 30: Asia Pacific Oil and Gas Magnetic Ranging Market Revenue (million), by Country 2025 & 2033
- Figure 31: Asia Pacific Oil and Gas Magnetic Ranging Market Revenue Share (%), by Country 2025 & 2033
List of Tables
- Table 1: Global Oil and Gas Magnetic Ranging Market Revenue million Forecast, by Location of Deployment 2020 & 2033
- Table 2: Global Oil and Gas Magnetic Ranging Market Revenue million Forecast, by Geogrpahy 2020 & 2033
- Table 3: Global Oil and Gas Magnetic Ranging Market Revenue million Forecast, by Region 2020 & 2033
- Table 4: Global Oil and Gas Magnetic Ranging Market Revenue million Forecast, by Location of Deployment 2020 & 2033
- Table 5: Global Oil and Gas Magnetic Ranging Market Revenue million Forecast, by Geogrpahy 2020 & 2033
- Table 6: Global Oil and Gas Magnetic Ranging Market Revenue million Forecast, by Country 2020 & 2033
- Table 7: United States Oil and Gas Magnetic Ranging Market Revenue (million) Forecast, by Application 2020 & 2033
- Table 8: Canada Oil and Gas Magnetic Ranging Market Revenue (million) Forecast, by Application 2020 & 2033
- Table 9: Mexico Oil and Gas Magnetic Ranging Market Revenue (million) Forecast, by Application 2020 & 2033
- Table 10: Global Oil and Gas Magnetic Ranging Market Revenue million Forecast, by Location of Deployment 2020 & 2033
- Table 11: Global Oil and Gas Magnetic Ranging Market Revenue million Forecast, by Geogrpahy 2020 & 2033
- Table 12: Global Oil and Gas Magnetic Ranging Market Revenue million Forecast, by Country 2020 & 2033
- Table 13: Brazil Oil and Gas Magnetic Ranging Market Revenue (million) Forecast, by Application 2020 & 2033
- Table 14: Argentina Oil and Gas Magnetic Ranging Market Revenue (million) Forecast, by Application 2020 & 2033
- Table 15: Rest of South America Oil and Gas Magnetic Ranging Market Revenue (million) Forecast, by Application 2020 & 2033
- Table 16: Global Oil and Gas Magnetic Ranging Market Revenue million Forecast, by Location of Deployment 2020 & 2033
- Table 17: Global Oil and Gas Magnetic Ranging Market Revenue million Forecast, by Geogrpahy 2020 & 2033
- Table 18: Global Oil and Gas Magnetic Ranging Market Revenue million Forecast, by Country 2020 & 2033
- Table 19: United Kingdom Oil and Gas Magnetic Ranging Market Revenue (million) Forecast, by Application 2020 & 2033
- Table 20: Germany Oil and Gas Magnetic Ranging Market Revenue (million) Forecast, by Application 2020 & 2033
- Table 21: France Oil and Gas Magnetic Ranging Market Revenue (million) Forecast, by Application 2020 & 2033
- Table 22: Italy Oil and Gas Magnetic Ranging Market Revenue (million) Forecast, by Application 2020 & 2033
- Table 23: Spain Oil and Gas Magnetic Ranging Market Revenue (million) Forecast, by Application 2020 & 2033
- Table 24: Russia Oil and Gas Magnetic Ranging Market Revenue (million) Forecast, by Application 2020 & 2033
- Table 25: Benelux Oil and Gas Magnetic Ranging Market Revenue (million) Forecast, by Application 2020 & 2033
- Table 26: Nordics Oil and Gas Magnetic Ranging Market Revenue (million) Forecast, by Application 2020 & 2033
- Table 27: Rest of Europe Oil and Gas Magnetic Ranging Market Revenue (million) Forecast, by Application 2020 & 2033
- Table 28: Global Oil and Gas Magnetic Ranging Market Revenue million Forecast, by Location of Deployment 2020 & 2033
- Table 29: Global Oil and Gas Magnetic Ranging Market Revenue million Forecast, by Geogrpahy 2020 & 2033
- Table 30: Global Oil and Gas Magnetic Ranging Market Revenue million Forecast, by Country 2020 & 2033
- Table 31: Turkey Oil and Gas Magnetic Ranging Market Revenue (million) Forecast, by Application 2020 & 2033
- Table 32: Israel Oil and Gas Magnetic Ranging Market Revenue (million) Forecast, by Application 2020 & 2033
- Table 33: GCC Oil and Gas Magnetic Ranging Market Revenue (million) Forecast, by Application 2020 & 2033
- Table 34: North Africa Oil and Gas Magnetic Ranging Market Revenue (million) Forecast, by Application 2020 & 2033
- Table 35: South Africa Oil and Gas Magnetic Ranging Market Revenue (million) Forecast, by Application 2020 & 2033
- Table 36: Rest of Middle East & Africa Oil and Gas Magnetic Ranging Market Revenue (million) Forecast, by Application 2020 & 2033
- Table 37: Global Oil and Gas Magnetic Ranging Market Revenue million Forecast, by Location of Deployment 2020 & 2033
- Table 38: Global Oil and Gas Magnetic Ranging Market Revenue million Forecast, by Geogrpahy 2020 & 2033
- Table 39: Global Oil and Gas Magnetic Ranging Market Revenue million Forecast, by Country 2020 & 2033
- Table 40: China Oil and Gas Magnetic Ranging Market Revenue (million) Forecast, by Application 2020 & 2033
- Table 41: India Oil and Gas Magnetic Ranging Market Revenue (million) Forecast, by Application 2020 & 2033
- Table 42: Japan Oil and Gas Magnetic Ranging Market Revenue (million) Forecast, by Application 2020 & 2033
- Table 43: South Korea Oil and Gas Magnetic Ranging Market Revenue (million) Forecast, by Application 2020 & 2033
- Table 44: ASEAN Oil and Gas Magnetic Ranging Market Revenue (million) Forecast, by Application 2020 & 2033
- Table 45: Oceania Oil and Gas Magnetic Ranging Market Revenue (million) Forecast, by Application 2020 & 2033
- Table 46: Rest of Asia Pacific Oil and Gas Magnetic Ranging Market Revenue (million) Forecast, by Application 2020 & 2033
Frequently Asked Questions
1. What is the projected Compound Annual Growth Rate (CAGR) of the Oil and Gas Magnetic Ranging Market?
The projected CAGR is approximately 8.8%.
2. Which companies are prominent players in the Oil and Gas Magnetic Ranging Market?
Key companies in the market include Bartington Instruments Ltd, Weatherford International plc, GMW Associates, Gunnar Energy Services, China Oilfield Services Limited, Halliburton Company, Prime Horizontal Group of Companies, Scientific Drilling International Inc.
3. What are the main segments of the Oil and Gas Magnetic Ranging Market?
The market segments include Location of Deployment, Geogrpahy.
4. Can you provide details about the market size?
The market size is estimated to be USD 580 million as of 2022.
5. What are some drivers contributing to market growth?
4.; Increasing Production from Unconventional Sources4.; Growing Energy Demand in the Region.
6. What are the notable trends driving market growth?
Onshore Segment to Dominate the Demand.
7. Are there any restraints impacting market growth?
4.; Environmental Concerns.
8. Can you provide examples of recent developments in the market?
N/A
9. What pricing options are available for accessing the report?
Pricing options include single-user, multi-user, and enterprise licenses priced at USD 4750, USD 5250, and USD 8750 respectively.
10. Is the market size provided in terms of value or volume?
The market size is provided in terms of value, measured in million.
11. Are there any specific market keywords associated with the report?
Yes, the market keyword associated with the report is "Oil and Gas Magnetic Ranging Market," which aids in identifying and referencing the specific market segment covered.
12. How do I determine which pricing option suits my needs best?
The pricing options vary based on user requirements and access needs. Individual users may opt for single-user licenses, while businesses requiring broader access may choose multi-user or enterprise licenses for cost-effective access to the report.
13. Are there any additional resources or data provided in the Oil and Gas Magnetic Ranging Market report?
While the report offers comprehensive insights, it's advisable to review the specific contents or supplementary materials provided to ascertain if additional resources or data are available.
14. How can I stay updated on further developments or reports in the Oil and Gas Magnetic Ranging Market?
To stay informed about further developments, trends, and reports in the Oil and Gas Magnetic Ranging Market, consider subscribing to industry newsletters, following relevant companies and organizations, or regularly checking reputable industry news sources and publications.
Methodology
Step 1 - Identification of Relevant Samples Size from Population Database


Step 2 - Approaches for Defining Global Market Size (Value, Volume* & Price*)

Note*: In applicable scenarios
Step 3 - Data Sources
Primary Research
- Web Analytics
- Survey Reports
- Research Institute
- Latest Research Reports
- Opinion Leaders
Secondary Research
- Annual Reports
- White Paper
- Latest Press Release
- Industry Association
- Paid Database
- Investor Presentations

Step 4 - Data Triangulation
Involves using different sources of information in order to increase the validity of a study
These sources are likely to be stakeholders in a program - participants, other researchers, program staff, other community members, and so on.
Then we put all data in single framework & apply various statistical tools to find out the dynamic on the market.
During the analysis stage, feedback from the stakeholder groups would be compared to determine areas of agreement as well as areas of divergence