

Key Insights
The global electric traction motor market is poised for substantial growth, propelled by the expanding electric vehicle (EV) sector, ongoing railway network development, and rising demand for high-efficiency industrial machinery. The market, estimated at $15.87 billion in 2025, is projected to expand significantly through the forecast period (2025-2033) with a compound annual growth rate (CAGR) of 8.82%. Key growth drivers include stringent global emission regulations mandating cleaner transportation, technological advancements in motor efficiency and power density, and considerable government investment in sustainable infrastructure. Analysis reveals strong performance across various power ratings and applications. While AC motors currently lead, DC motors are gaining traction due to advancements in power electronics and their suitability for EV applications. The railway sector remains a significant segment, but the rapid growth of the EV sector is expected to drive substantial future demand. Geographically, Asia-Pacific demonstrates strong growth potential, driven by rapid industrialization and increasing EV adoption in key markets like China and India. North America and Europe are also substantial markets, influenced by regulatory compliance and technological progress. However, challenges such as high initial investment costs for electric traction motor systems and the necessity for robust charging infrastructure persist.
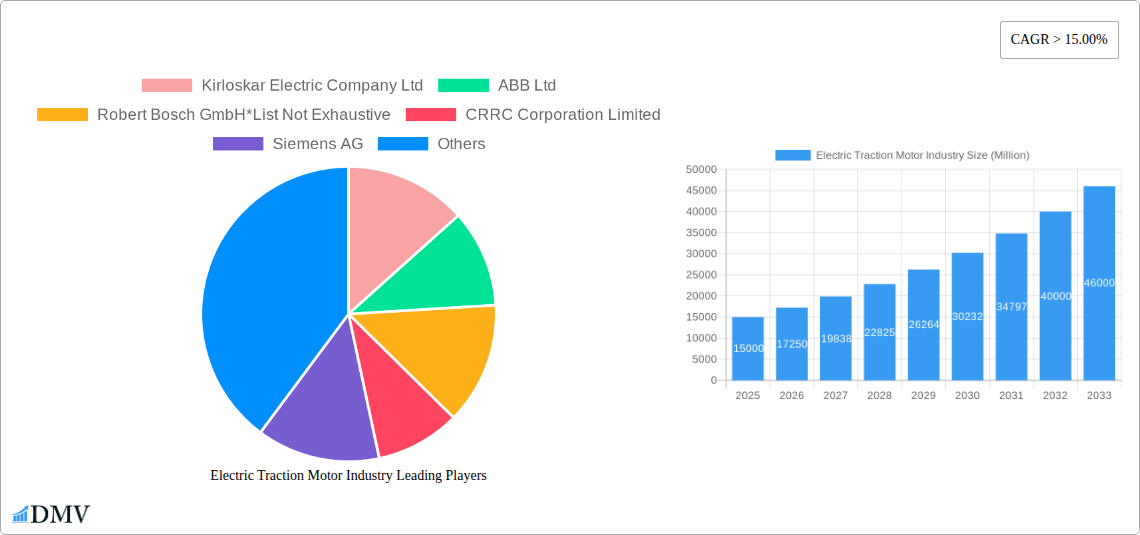
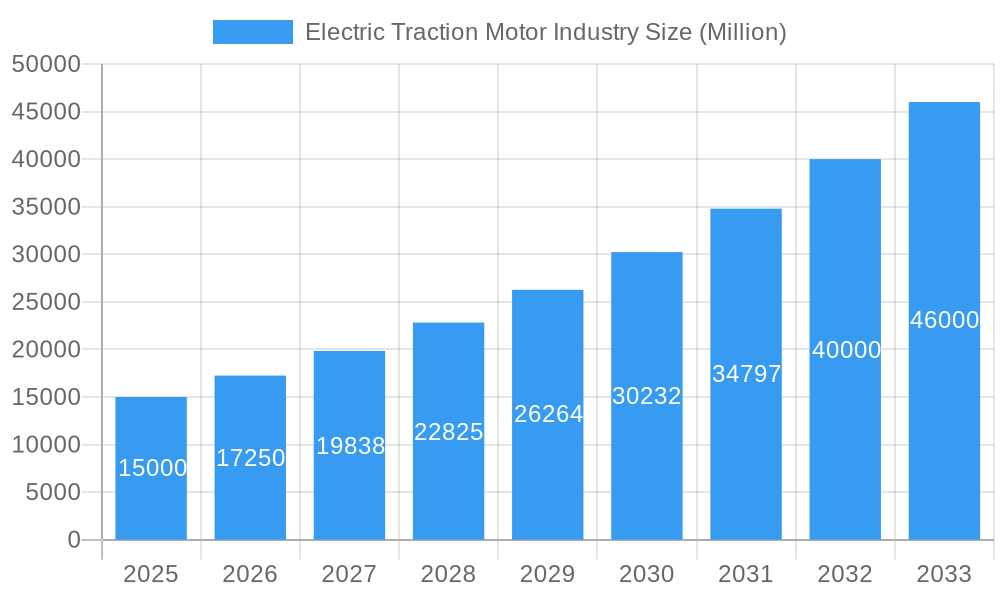
Electric Traction Motor Industry Market Size (In Billion)
The competitive landscape features established industry leaders such as ABB, Siemens, and General Electric, alongside specialized providers like Traktionssysteme Austria. These companies are actively pursuing research and development to enhance motor efficiency, durability, and power output. Strategic collaborations and mergers & acquisitions are anticipated to shape the industry's future as companies aim to strengthen market positions and leverage emerging opportunities. The ongoing development of high-power density motors, coupled with advancements in battery technology and grid infrastructure, is expected to further accelerate market expansion. Potential restraints include supply chain volatility, raw material price fluctuations, and the demand for skilled labor in manufacturing and maintenance. Understanding these dynamics is critical for navigating this evolving market and capitalizing on its considerable growth potential.
Electric Traction Motor Industry Company Market Share
Electric Traction Motor Industry: Market Analysis & Forecast 2019-2033
This comprehensive report provides an in-depth analysis of the global electric traction motor industry, offering valuable insights for stakeholders seeking to understand market trends, growth opportunities, and competitive dynamics. Covering the period from 2019 to 2033, with a focus on 2025, this report meticulously examines market segmentation, key players, technological advancements, and future projections. The total market size is predicted to reach xx Million by 2033.
Electric Traction Motor Industry Market Composition & Trends
This section analyzes the competitive landscape of the electric traction motor market, encompassing market concentration, innovation drivers, regulatory influences, and M&A activities. The market is characterized by a moderately concentrated structure, with key players like ABB Ltd, Robert Bosch GmbH, Siemens AG, and CRRC Corporation Limited holding significant market share. However, the emergence of new technologies and the increasing demand for electric vehicles are fostering competition.
- Market Share Distribution (2025): ABB Ltd (15%), Robert Bosch GmbH (12%), Siemens AG (10%), CRRC Corporation Limited (8%), Others (55%). These figures are estimates based on available data and market analysis.
- Innovation Catalysts: Advancements in power electronics, permanent magnet technology, and control systems are driving innovation and efficiency gains.
- Regulatory Landscape: Stringent emission norms and government incentives for electric mobility are shaping market growth.
- Substitute Products: While limited, fuel-based internal combustion engines still represent a substitute in certain applications.
- End-User Profiles: The primary end-users are the railway, electric vehicle, and industrial machinery sectors.
- M&A Activities (2019-2024): The total value of M&A deals in the electric traction motor industry during this period is estimated at xx Million.
Electric Traction Motor Industry Industry Evolution
The electric traction motor industry has witnessed significant evolution, driven by technological advancements and shifting consumer preferences. The historical period (2019-2024) saw a Compound Annual Growth Rate (CAGR) of xx%, primarily fueled by the increasing adoption of electric vehicles and the expansion of railway networks. The forecast period (2025-2033) projects a CAGR of xx%, driven by continued technological improvements, increasing government support for green initiatives, and the rising demand for efficient and sustainable transportation solutions. The shift towards higher power rating motors (above 400 kW) is also a notable trend, reflecting the demand for heavy-duty applications. The market is witnessing a considerable rise in the adoption of alternating current (AC) motors due to their higher efficiency and improved control capabilities compared to direct current (DC) motors. This trend is expected to continue throughout the forecast period. Further innovation in areas such as silicon carbide (SiC) based inverters and advanced motor control algorithms will continue to improve the efficiency and power density of these motors, making them even more attractive for a wider range of applications.
Leading Regions, Countries, or Segments in Electric Traction Motor Industry
The electric vehicle segment is the fastest-growing application segment globally, driven by stringent emission regulations and the increasing demand for eco-friendly transportation. China and Europe currently lead the market in terms of electric vehicle adoption and traction motor production.
Key Drivers for Growth:
- Significant Investments: Governments worldwide are investing heavily in infrastructure development to support the adoption of electric vehicles and railway electrification projects.
- Stringent Emission Regulations: Governments are implementing increasingly stringent emission norms to reduce greenhouse gas emissions, making electric traction motors a crucial component for environmentally friendly transportation.
- Technological Advancements: Continuous advancements in electric motor technology are leading to improved efficiency, higher power density, and reduced costs.
Dominance Factors: China's dominance stems from its vast electric vehicle market and its robust manufacturing capabilities. Europe's strong position is due to its focus on renewable energy and the early adoption of electric vehicle technologies. The railway sector remains a significant contributor, particularly in developed countries with established high-speed rail networks. The "Above 400 kW" power rating segment is experiencing the fastest growth, driven by high-speed rail and heavy-duty electric vehicle applications.
Electric Traction Motor Industry Product Innovations
Recent innovations include the development of high-efficiency permanent magnet synchronous motors (PMSMs) with improved power density and reduced rare-earth reliance. Advances in power electronics, such as silicon carbide (SiC) inverters, are leading to higher efficiency and faster switching speeds, enhancing the performance and reliability of electric traction motors. These advancements extend to improved thermal management systems and advanced control algorithms that optimize motor performance and efficiency across various operating conditions. The focus on reducing weight and improving durability contributes to unique selling propositions, making these motors suitable for diverse applications.
Propelling Factors for Electric Traction Motor Industry Growth
The growth of the electric traction motor industry is fueled by several factors: the rapid expansion of the electric vehicle market globally; increasing demand for electric trains and other rail-based transportation; the rising need for energy-efficient industrial machinery; and supportive government policies promoting electric mobility and sustainable transportation. Technological advancements, such as improved battery technology and motor designs, further enhance this growth. The decreasing cost of electric motors also contributes to wider adoption across various sectors.
Obstacles in the Electric Traction Motor Industry Market
The electric traction motor industry faces challenges, including supply chain disruptions impacting the availability of raw materials like rare-earth elements; competition from established players and new entrants; and the high initial investment required for developing and deploying advanced motor technologies. Furthermore, stringent safety and performance standards necessitate robust testing and validation procedures, adding to the overall cost and development time. Regulatory uncertainties in some markets also pose a risk to investors and manufacturers.
Future Opportunities in Electric Traction Motor Industry
Future opportunities lie in the development of more efficient and cost-effective electric motors for various applications, especially the growing electric aviation and marine sectors. The integration of advanced control systems, such as artificial intelligence (AI) and machine learning (ML), will further optimize motor performance and energy efficiency. Expansion into emerging markets with growing infrastructure development and rising demand for electric mobility presents significant opportunities for growth. The development of sustainable and ethically sourced raw materials for motor manufacturing will be crucial for long-term industry sustainability.
Major Players in the Electric Traction Motor Industry Ecosystem
- Kirloskar Electric Company Ltd
- ABB Ltd
- Robert Bosch GmbH
- CRRC Corporation Limited
- Siemens AG
- Alstom SA
- Traktionssysteme Austria (TSA) GmbH
- CG Power and Industrial Solutions Ltd
- General Electric Company
- Skoda Transportation AS
Key Developments in Electric Traction Motor Industry Industry
- 2022-Q4: ABB Ltd launched a new range of high-efficiency traction motors for electric buses.
- 2023-Q1: Siemens AG announced a significant investment in R&D for next-generation electric traction motors.
- 2023-Q2: A merger between two smaller electric motor manufacturers resulted in a combined market share of 3%. (Further details would be added based on accurate data).
Strategic Electric Traction Motor Industry Market Forecast
The electric traction motor industry is poised for significant growth in the coming years, driven by the global shift towards electric mobility and sustainable transportation. Continued technological advancements, coupled with supportive government policies and increasing investments in infrastructure development, will fuel market expansion. The focus on developing high-efficiency, cost-effective motors, catering to diverse applications, will be crucial for sustaining long-term growth and profitability. The market is expected to witness consolidation through mergers and acquisitions, leading to a more concentrated industry landscape.
Electric Traction Motor Industry Segmentation
-
1. Type
- 1.1. Alternating Current
- 1.2. Direct Current
-
2. Power Rating
- 2.1. Below 200 kW
- 2.2. 200 - 400 kW
- 2.3. Above 400 kW
-
3. Application
- 3.1. Railway
- 3.2. Electric Vehicle
- 3.3. Industrial Machinery
- 3.4. Others
Electric Traction Motor Industry Segmentation By Geography
- 1. North America
- 2. Asia Pacific
- 3. Europe
- 4. South America
- 5. Middle East and Africa
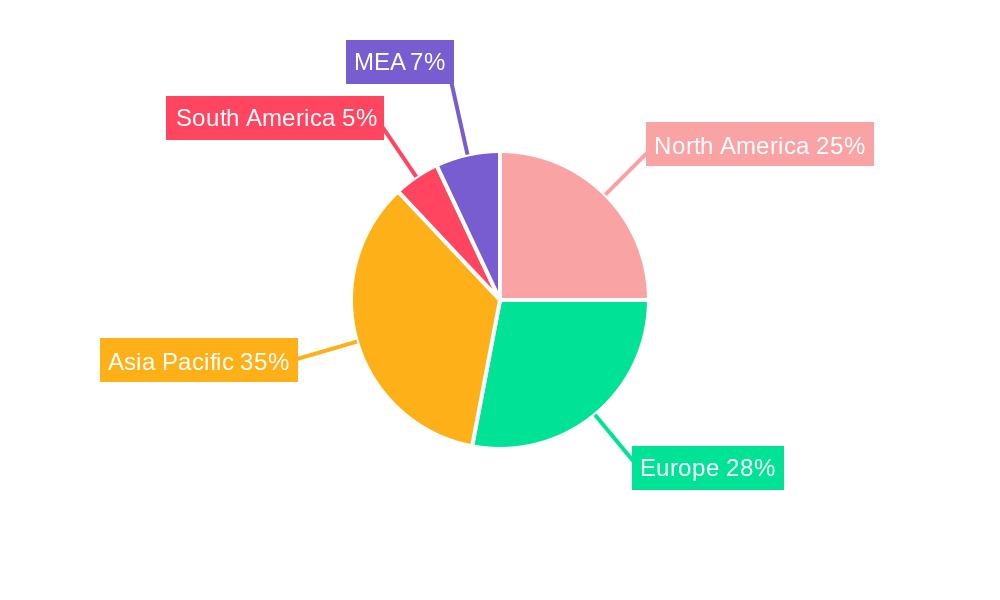
Electric Traction Motor Industry Regional Market Share
Geographic Coverage of Electric Traction Motor Industry
Electric Traction Motor Industry REPORT HIGHLIGHTS
| Aspects | Details |
|---|---|
| Study Period | 2020-2034 |
| Base Year | 2025 |
| Estimated Year | 2026 |
| Forecast Period | 2026-2034 |
| Historical Period | 2020-2025 |
| Growth Rate | CAGR of 8.82% from 2020-2034 |
| Segmentation |
|
Table of Contents
- 1. Introduction
- 1.1. Research Scope
- 1.2. Market Segmentation
- 1.3. Research Objective
- 1.4. Definitions and Assumptions
- 2. Executive Summary
- 2.1. Market Snapshot
- 3. Market Dynamics
- 3.1. Market Drivers
- 3.2. Market Restrains
- 3.3. Market Trends
- 3.4. Market Opportunities
- 4. Market Factor Analysis
- 4.1. Porters Five Forces
- 4.1.1. Bargaining Power of Suppliers
- 4.1.2. Bargaining Power of Buyers
- 4.1.3. Threat of New Entrants
- 4.1.4. Threat of Substitutes
- 4.1.5. Competitive Rivalry
- 4.2. PESTEL analysis
- 4.3. BCG Analysis
- 4.3.1. Stars (High Growth, High Market Share)
- 4.3.2. Cash Cows (Low Growth, High Market Share)
- 4.3.3. Question Mark (High Growth, Low Market Share)
- 4.3.4. Dogs (Low Growth, Low Market Share)
- 4.4. Ansoff Matrix Analysis
- 4.5. Supply Chain Analysis
- 4.6. Regulatory Landscape
- 4.7. Current Market Potential and Opportunity Assessment (TAM–SAM–SOM Framework)
- 4.8. DMV Analyst Note
- 4.1. Porters Five Forces
- 5. Market Analysis, Insights and Forecast 2021-2033
- 5.1. Market Analysis, Insights and Forecast - by Type
- 5.1.1. Alternating Current
- 5.1.2. Direct Current
- 5.2. Market Analysis, Insights and Forecast - by Power Rating
- 5.2.1. Below 200 kW
- 5.2.2. 200 - 400 kW
- 5.2.3. Above 400 kW
- 5.3. Market Analysis, Insights and Forecast - by Application
- 5.3.1. Railway
- 5.3.2. Electric Vehicle
- 5.3.3. Industrial Machinery
- 5.3.4. Others
- 5.4. Market Analysis, Insights and Forecast - by Region
- 5.4.1. North America
- 5.4.2. Asia Pacific
- 5.4.3. Europe
- 5.4.4. South America
- 5.4.5. Middle East and Africa
- 5.1. Market Analysis, Insights and Forecast - by Type
- 6. Global Electric Traction Motor Industry Analysis, Insights and Forecast, 2021-2033
- 6.1. Market Analysis, Insights and Forecast - by Type
- 6.1.1. Alternating Current
- 6.1.2. Direct Current
- 6.2. Market Analysis, Insights and Forecast - by Power Rating
- 6.2.1. Below 200 kW
- 6.2.2. 200 - 400 kW
- 6.2.3. Above 400 kW
- 6.3. Market Analysis, Insights and Forecast - by Application
- 6.3.1. Railway
- 6.3.2. Electric Vehicle
- 6.3.3. Industrial Machinery
- 6.3.4. Others
- 6.1. Market Analysis, Insights and Forecast - by Type
- 7. North America Electric Traction Motor Industry Analysis, Insights and Forecast, 2020-2032
- 7.1. Market Analysis, Insights and Forecast - by Type
- 7.1.1. Alternating Current
- 7.1.2. Direct Current
- 7.2. Market Analysis, Insights and Forecast - by Power Rating
- 7.2.1. Below 200 kW
- 7.2.2. 200 - 400 kW
- 7.2.3. Above 400 kW
- 7.3. Market Analysis, Insights and Forecast - by Application
- 7.3.1. Railway
- 7.3.2. Electric Vehicle
- 7.3.3. Industrial Machinery
- 7.3.4. Others
- 7.1. Market Analysis, Insights and Forecast - by Type
- 8. Asia Pacific Electric Traction Motor Industry Analysis, Insights and Forecast, 2020-2032
- 8.1. Market Analysis, Insights and Forecast - by Type
- 8.1.1. Alternating Current
- 8.1.2. Direct Current
- 8.2. Market Analysis, Insights and Forecast - by Power Rating
- 8.2.1. Below 200 kW
- 8.2.2. 200 - 400 kW
- 8.2.3. Above 400 kW
- 8.3. Market Analysis, Insights and Forecast - by Application
- 8.3.1. Railway
- 8.3.2. Electric Vehicle
- 8.3.3. Industrial Machinery
- 8.3.4. Others
- 8.1. Market Analysis, Insights and Forecast - by Type
- 9. Europe Electric Traction Motor Industry Analysis, Insights and Forecast, 2020-2032
- 9.1. Market Analysis, Insights and Forecast - by Type
- 9.1.1. Alternating Current
- 9.1.2. Direct Current
- 9.2. Market Analysis, Insights and Forecast - by Power Rating
- 9.2.1. Below 200 kW
- 9.2.2. 200 - 400 kW
- 9.2.3. Above 400 kW
- 9.3. Market Analysis, Insights and Forecast - by Application
- 9.3.1. Railway
- 9.3.2. Electric Vehicle
- 9.3.3. Industrial Machinery
- 9.3.4. Others
- 9.1. Market Analysis, Insights and Forecast - by Type
- 10. South America Electric Traction Motor Industry Analysis, Insights and Forecast, 2020-2032
- 10.1. Market Analysis, Insights and Forecast - by Type
- 10.1.1. Alternating Current
- 10.1.2. Direct Current
- 10.2. Market Analysis, Insights and Forecast - by Power Rating
- 10.2.1. Below 200 kW
- 10.2.2. 200 - 400 kW
- 10.2.3. Above 400 kW
- 10.3. Market Analysis, Insights and Forecast - by Application
- 10.3.1. Railway
- 10.3.2. Electric Vehicle
- 10.3.3. Industrial Machinery
- 10.3.4. Others
- 10.1. Market Analysis, Insights and Forecast - by Type
- 11. Middle East and Africa Electric Traction Motor Industry Analysis, Insights and Forecast, 2020-2032
- 11.1. Market Analysis, Insights and Forecast - by Type
- 11.1.1. Alternating Current
- 11.1.2. Direct Current
- 11.2. Market Analysis, Insights and Forecast - by Power Rating
- 11.2.1. Below 200 kW
- 11.2.2. 200 - 400 kW
- 11.2.3. Above 400 kW
- 11.3. Market Analysis, Insights and Forecast - by Application
- 11.3.1. Railway
- 11.3.2. Electric Vehicle
- 11.3.3. Industrial Machinery
- 11.3.4. Others
- 11.1. Market Analysis, Insights and Forecast - by Type
- 12. Competitive Analysis
- 12.1. Company Profiles
- 12.1.1 Kirloskar Electric Company Ltd
- 12.1.1.1. Company Overview
- 12.1.1.2. Products
- 12.1.1.3. Company Financials
- 12.1.1.4. SWOT Analysis
- 12.1.2 ABB Ltd
- 12.1.2.1. Company Overview
- 12.1.2.2. Products
- 12.1.2.3. Company Financials
- 12.1.2.4. SWOT Analysis
- 12.1.3 Robert Bosch GmbH*List Not Exhaustive
- 12.1.3.1. Company Overview
- 12.1.3.2. Products
- 12.1.3.3. Company Financials
- 12.1.3.4. SWOT Analysis
- 12.1.4 CRRC Corporation Limited
- 12.1.4.1. Company Overview
- 12.1.4.2. Products
- 12.1.4.3. Company Financials
- 12.1.4.4. SWOT Analysis
- 12.1.5 Siemens AG
- 12.1.5.1. Company Overview
- 12.1.5.2. Products
- 12.1.5.3. Company Financials
- 12.1.5.4. SWOT Analysis
- 12.1.6 Alstom SA
- 12.1.6.1. Company Overview
- 12.1.6.2. Products
- 12.1.6.3. Company Financials
- 12.1.6.4. SWOT Analysis
- 12.1.7 Traktionssysteme Austria (TSA) GmbH
- 12.1.7.1. Company Overview
- 12.1.7.2. Products
- 12.1.7.3. Company Financials
- 12.1.7.4. SWOT Analysis
- 12.1.8 CG Power and Industrial Solutions Ltd
- 12.1.8.1. Company Overview
- 12.1.8.2. Products
- 12.1.8.3. Company Financials
- 12.1.8.4. SWOT Analysis
- 12.1.9 General Electric Company
- 12.1.9.1. Company Overview
- 12.1.9.2. Products
- 12.1.9.3. Company Financials
- 12.1.9.4. SWOT Analysis
- 12.1.10 Skoda Transportation AS
- 12.1.10.1. Company Overview
- 12.1.10.2. Products
- 12.1.10.3. Company Financials
- 12.1.10.4. SWOT Analysis
- 12.1.1 Kirloskar Electric Company Ltd
- 12.2. Market Entropy
- 12.2.1 Company's Key Areas Served
- 12.2.2 Recent Developments
- 12.3. Company Market Share Analysis 2025
- 12.3.1 Top 5 Companies Market Share Analysis
- 12.3.2 Top 3 Companies Market Share Analysis
- 12.4. List of Potential Customers
- 13. Research Methodology
List of Figures
- Figure 1: Global Electric Traction Motor Industry Revenue Breakdown (billion, %) by Region 2025 & 2033
- Figure 2: North America Electric Traction Motor Industry Revenue (billion), by Type 2025 & 2033
- Figure 3: North America Electric Traction Motor Industry Revenue Share (%), by Type 2025 & 2033
- Figure 4: North America Electric Traction Motor Industry Revenue (billion), by Power Rating 2025 & 2033
- Figure 5: North America Electric Traction Motor Industry Revenue Share (%), by Power Rating 2025 & 2033
- Figure 6: North America Electric Traction Motor Industry Revenue (billion), by Application 2025 & 2033
- Figure 7: North America Electric Traction Motor Industry Revenue Share (%), by Application 2025 & 2033
- Figure 8: North America Electric Traction Motor Industry Revenue (billion), by Country 2025 & 2033
- Figure 9: North America Electric Traction Motor Industry Revenue Share (%), by Country 2025 & 2033
- Figure 10: Asia Pacific Electric Traction Motor Industry Revenue (billion), by Type 2025 & 2033
- Figure 11: Asia Pacific Electric Traction Motor Industry Revenue Share (%), by Type 2025 & 2033
- Figure 12: Asia Pacific Electric Traction Motor Industry Revenue (billion), by Power Rating 2025 & 2033
- Figure 13: Asia Pacific Electric Traction Motor Industry Revenue Share (%), by Power Rating 2025 & 2033
- Figure 14: Asia Pacific Electric Traction Motor Industry Revenue (billion), by Application 2025 & 2033
- Figure 15: Asia Pacific Electric Traction Motor Industry Revenue Share (%), by Application 2025 & 2033
- Figure 16: Asia Pacific Electric Traction Motor Industry Revenue (billion), by Country 2025 & 2033
- Figure 17: Asia Pacific Electric Traction Motor Industry Revenue Share (%), by Country 2025 & 2033
- Figure 18: Europe Electric Traction Motor Industry Revenue (billion), by Type 2025 & 2033
- Figure 19: Europe Electric Traction Motor Industry Revenue Share (%), by Type 2025 & 2033
- Figure 20: Europe Electric Traction Motor Industry Revenue (billion), by Power Rating 2025 & 2033
- Figure 21: Europe Electric Traction Motor Industry Revenue Share (%), by Power Rating 2025 & 2033
- Figure 22: Europe Electric Traction Motor Industry Revenue (billion), by Application 2025 & 2033
- Figure 23: Europe Electric Traction Motor Industry Revenue Share (%), by Application 2025 & 2033
- Figure 24: Europe Electric Traction Motor Industry Revenue (billion), by Country 2025 & 2033
- Figure 25: Europe Electric Traction Motor Industry Revenue Share (%), by Country 2025 & 2033
- Figure 26: South America Electric Traction Motor Industry Revenue (billion), by Type 2025 & 2033
- Figure 27: South America Electric Traction Motor Industry Revenue Share (%), by Type 2025 & 2033
- Figure 28: South America Electric Traction Motor Industry Revenue (billion), by Power Rating 2025 & 2033
- Figure 29: South America Electric Traction Motor Industry Revenue Share (%), by Power Rating 2025 & 2033
- Figure 30: South America Electric Traction Motor Industry Revenue (billion), by Application 2025 & 2033
- Figure 31: South America Electric Traction Motor Industry Revenue Share (%), by Application 2025 & 2033
- Figure 32: South America Electric Traction Motor Industry Revenue (billion), by Country 2025 & 2033
- Figure 33: South America Electric Traction Motor Industry Revenue Share (%), by Country 2025 & 2033
- Figure 34: Middle East and Africa Electric Traction Motor Industry Revenue (billion), by Type 2025 & 2033
- Figure 35: Middle East and Africa Electric Traction Motor Industry Revenue Share (%), by Type 2025 & 2033
- Figure 36: Middle East and Africa Electric Traction Motor Industry Revenue (billion), by Power Rating 2025 & 2033
- Figure 37: Middle East and Africa Electric Traction Motor Industry Revenue Share (%), by Power Rating 2025 & 2033
- Figure 38: Middle East and Africa Electric Traction Motor Industry Revenue (billion), by Application 2025 & 2033
- Figure 39: Middle East and Africa Electric Traction Motor Industry Revenue Share (%), by Application 2025 & 2033
- Figure 40: Middle East and Africa Electric Traction Motor Industry Revenue (billion), by Country 2025 & 2033
- Figure 41: Middle East and Africa Electric Traction Motor Industry Revenue Share (%), by Country 2025 & 2033
List of Tables
- Table 1: Global Electric Traction Motor Industry Revenue billion Forecast, by Type 2020 & 2033
- Table 2: Global Electric Traction Motor Industry Revenue billion Forecast, by Power Rating 2020 & 2033
- Table 3: Global Electric Traction Motor Industry Revenue billion Forecast, by Application 2020 & 2033
- Table 4: Global Electric Traction Motor Industry Revenue billion Forecast, by Region 2020 & 2033
- Table 5: Global Electric Traction Motor Industry Revenue billion Forecast, by Type 2020 & 2033
- Table 6: Global Electric Traction Motor Industry Revenue billion Forecast, by Power Rating 2020 & 2033
- Table 7: Global Electric Traction Motor Industry Revenue billion Forecast, by Application 2020 & 2033
- Table 8: Global Electric Traction Motor Industry Revenue billion Forecast, by Country 2020 & 2033
- Table 9: Global Electric Traction Motor Industry Revenue billion Forecast, by Type 2020 & 2033
- Table 10: Global Electric Traction Motor Industry Revenue billion Forecast, by Power Rating 2020 & 2033
- Table 11: Global Electric Traction Motor Industry Revenue billion Forecast, by Application 2020 & 2033
- Table 12: Global Electric Traction Motor Industry Revenue billion Forecast, by Country 2020 & 2033
- Table 13: Global Electric Traction Motor Industry Revenue billion Forecast, by Type 2020 & 2033
- Table 14: Global Electric Traction Motor Industry Revenue billion Forecast, by Power Rating 2020 & 2033
- Table 15: Global Electric Traction Motor Industry Revenue billion Forecast, by Application 2020 & 2033
- Table 16: Global Electric Traction Motor Industry Revenue billion Forecast, by Country 2020 & 2033
- Table 17: Global Electric Traction Motor Industry Revenue billion Forecast, by Type 2020 & 2033
- Table 18: Global Electric Traction Motor Industry Revenue billion Forecast, by Power Rating 2020 & 2033
- Table 19: Global Electric Traction Motor Industry Revenue billion Forecast, by Application 2020 & 2033
- Table 20: Global Electric Traction Motor Industry Revenue billion Forecast, by Country 2020 & 2033
- Table 21: Global Electric Traction Motor Industry Revenue billion Forecast, by Type 2020 & 2033
- Table 22: Global Electric Traction Motor Industry Revenue billion Forecast, by Power Rating 2020 & 2033
- Table 23: Global Electric Traction Motor Industry Revenue billion Forecast, by Application 2020 & 2033
- Table 24: Global Electric Traction Motor Industry Revenue billion Forecast, by Country 2020 & 2033
Frequently Asked Questions
1. What is the projected Compound Annual Growth Rate (CAGR) of the Electric Traction Motor Industry?
The projected CAGR is approximately 8.82%.
2. Which companies are prominent players in the Electric Traction Motor Industry?
Key companies in the market include Kirloskar Electric Company Ltd, ABB Ltd, Robert Bosch GmbH*List Not Exhaustive, CRRC Corporation Limited, Siemens AG, Alstom SA, Traktionssysteme Austria (TSA) GmbH, CG Power and Industrial Solutions Ltd, General Electric Company, Skoda Transportation AS.
3. What are the main segments of the Electric Traction Motor Industry?
The market segments include Type, Power Rating, Application.
4. Can you provide details about the market size?
The market size is estimated to be USD 15.87 billion as of 2022.
5. What are some drivers contributing to market growth?
4.; Increasing Integration Of Renewable Energy Generation4.; Aging Power Grids And Investments In Transmission And Distribution Infrastructure.
6. What are the notable trends driving market growth?
Electric Vehicle to Witness Significant Growth.
7. Are there any restraints impacting market growth?
4.; Lack Of Investor Confidence Due To Sociopolitical Instability In Some Countries.
8. Can you provide examples of recent developments in the market?
N/A
9. What pricing options are available for accessing the report?
Pricing options include single-user, multi-user, and enterprise licenses priced at USD 4750, USD 5250, and USD 8750 respectively.
10. Is the market size provided in terms of value or volume?
The market size is provided in terms of value, measured in billion.
11. Are there any specific market keywords associated with the report?
Yes, the market keyword associated with the report is "Electric Traction Motor Industry," which aids in identifying and referencing the specific market segment covered.
12. How do I determine which pricing option suits my needs best?
The pricing options vary based on user requirements and access needs. Individual users may opt for single-user licenses, while businesses requiring broader access may choose multi-user or enterprise licenses for cost-effective access to the report.
13. Are there any additional resources or data provided in the Electric Traction Motor Industry report?
While the report offers comprehensive insights, it's advisable to review the specific contents or supplementary materials provided to ascertain if additional resources or data are available.
14. How can I stay updated on further developments or reports in the Electric Traction Motor Industry?
To stay informed about further developments, trends, and reports in the Electric Traction Motor Industry, consider subscribing to industry newsletters, following relevant companies and organizations, or regularly checking reputable industry news sources and publications.
Methodology
Step 1 - Identification of Relevant Samples Size from Population Database


Step 2 - Approaches for Defining Global Market Size (Value, Volume* & Price*)

Note*: In applicable scenarios
Step 3 - Data Sources
Primary Research
- Web Analytics
- Survey Reports
- Research Institute
- Latest Research Reports
- Opinion Leaders
Secondary Research
- Annual Reports
- White Paper
- Latest Press Release
- Industry Association
- Paid Database
- Investor Presentations

Step 4 - Data Triangulation
Involves using different sources of information in order to increase the validity of a study
These sources are likely to be stakeholders in a program - participants, other researchers, program staff, other community members, and so on.
Then we put all data in single framework & apply various statistical tools to find out the dynamic on the market.
During the analysis stage, feedback from the stakeholder groups would be compared to determine areas of agreement as well as areas of divergence