

Key Insights
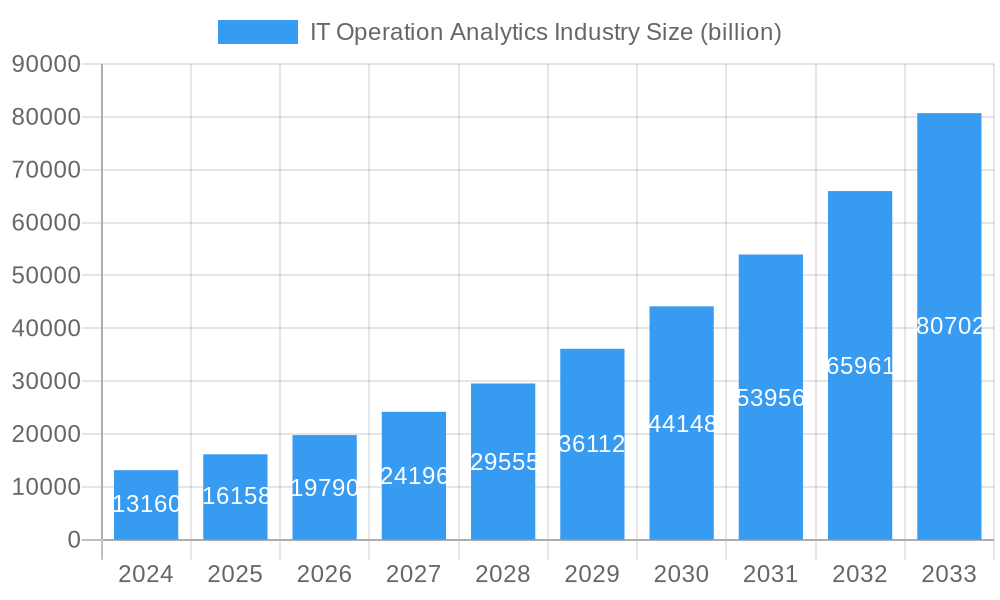
The IT Operation Analytics (ITOA) market is experiencing robust expansion, projected to reach USD 13.16 billion in 2024. This growth is fueled by an impressive CAGR of 22.6%, indicating a dynamic and rapidly evolving sector. The increasing complexity of IT infrastructure, coupled with the exponential rise in data volume generated by applications, services, and user interactions, is a primary driver. Organizations are increasingly recognizing the critical need for ITOA solutions to gain actionable insights, optimize performance, proactively identify and resolve issues, and enhance overall operational efficiency. The demand for seamless user experiences and the continuous pressure to reduce operational costs are further propelling the adoption of advanced analytics in IT operations.
IT Operation Analytics Industry Market Size (In Billion)
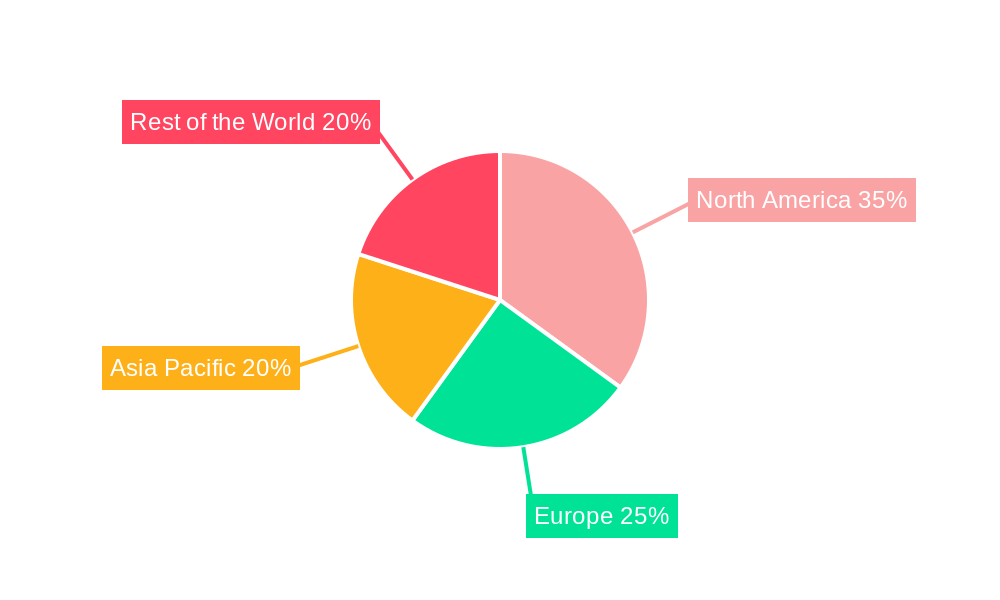
The ITOA market is segmented across various deployment models, including Cloud-Based and On-premise solutions, catering to diverse organizational needs and security preferences. Key applications driving market growth encompass Application Monitoring, Business & IT Services Monitoring, and Infrastructure Monitoring, all crucial for maintaining the health and performance of modern IT environments. Leading end-user industries such as BFSI, Healthcare, Telecommunication, Retail, and Industrial sectors are leveraging ITOA to manage their critical IT systems and ensure business continuity. Prominent players like IBM Corp, BMC Software Inc, Oracle Corp, VMware Inc, and Splunk Inc are at the forefront, offering innovative solutions that address the evolving challenges and opportunities within this burgeoning market. North America currently leads the market due to early adoption and significant investments in advanced technologies, with other regions like Europe and Asia Pacific showing substantial growth potential.
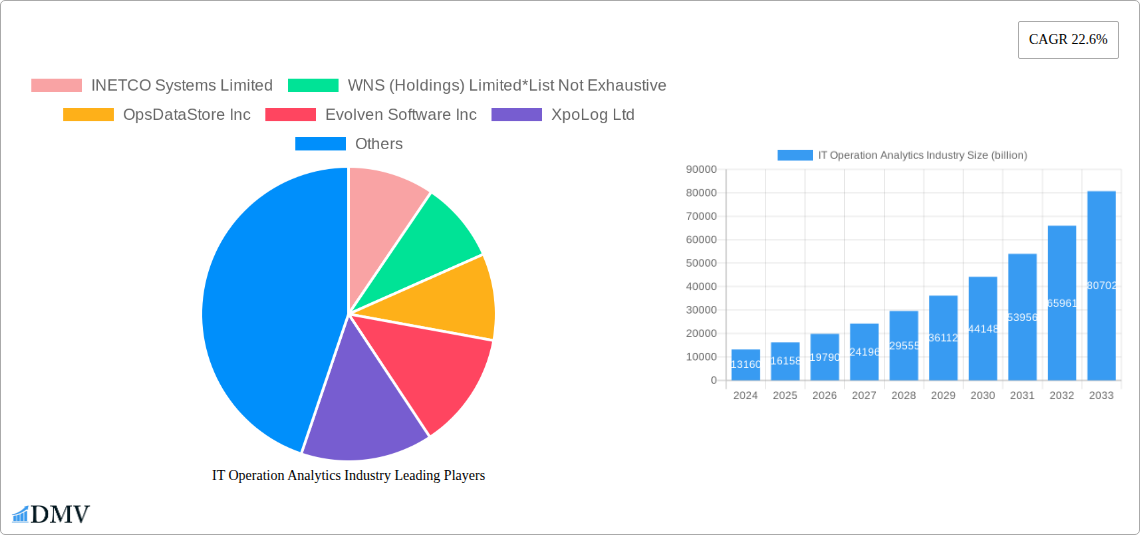
IT Operation Analytics Industry Company Market Share
Unlocking Operational Excellence: IT Operation Analytics Industry Market Insights & Future Trajectory (2019–2033)
This comprehensive report delivers an in-depth analysis of the global IT Operation Analytics (ITOA) industry, a critical sector projected to reach multi-billion dollar valuations. Explore the intricate market dynamics, technological advancements, and strategic imperatives shaping the future of operational intelligence. From BFSI to Telecommunication, uncover how ITOA solutions are revolutionizing application monitoring, business & IT services monitoring, and infrastructure monitoring across diverse industries. This report provides actionable intelligence for stakeholders seeking to leverage cloud-based and on-premise deployments for enhanced IT performance and business resilience. With a forecast period extending to 2033, gain a clear vision of market growth, emerging opportunities, and the competitive landscape.
IT Operation Analytics Industry Market Composition & Trends
The IT Operation Analytics industry is characterized by a dynamic and evolving market concentration, with innovation serving as a primary catalyst for growth. Leading players continuously invest in advanced analytical capabilities, including machine learning and artificial intelligence, to offer predictive insights and proactive issue resolution. The regulatory landscape, while not overly prescriptive, emphasizes data security and compliance, influencing the adoption of robust ITOA solutions. Substitute products, such as traditional network monitoring tools, are being increasingly superseded by comprehensive ITOA platforms offering deeper insights into application performance and user experience. End-user profiles are broadening, encompassing enterprises of all sizes across sectors like BFSI, Healthcare, and Telecommunication, all seeking to optimize their IT infrastructure and enhance operational efficiency. Merger and acquisition (M&A) activities are prevalent, with strategic partnerships and acquisitions aiming to consolidate market share, expand product portfolios, and gain access to new technologies. For instance, the M&A landscape has seen deal values in the multi-billion dollar range, reflecting the strategic importance of ITOA. Estimated market share distribution indicates a significant portion held by established vendors, with emerging players carving out niches through specialized solutions.
IT Operation Analytics Industry Industry Evolution
The IT Operation Analytics industry has undergone a remarkable evolution, driven by the ever-increasing complexity of IT environments and the growing demand for proactive operational management. The historical period from 2019 to 2024 witnessed a foundational phase where ITOA solutions transitioned from niche tools to mainstream enterprise necessities. Early adoption was primarily focused on addressing critical issues in infrastructure monitoring, with a strong emphasis on uptime and performance. However, as businesses increasingly relied on complex application stacks and digital services, the scope of ITOA expanded significantly. The base year of 2025 marks a pivotal point, with the market firmly established and poised for accelerated growth. This evolution is directly linked to technological advancements. The integration of Artificial Intelligence (AI) and Machine Learning (ML) has been a game-changer, enabling predictive analytics, anomaly detection, and automated root cause analysis. This shift from reactive to proactive monitoring has dramatically reduced downtime and improved user experience, translating into substantial cost savings and enhanced business continuity. Consumer demands have also played a crucial role. Organizations are no longer satisfied with simply knowing that a system is down; they require real-time insights into the impact of IT issues on business operations and customer satisfaction. This has fueled the demand for ITOA solutions that can correlate IT performance with business outcomes. Consequently, the market growth trajectory has been steep, with estimated Compound Annual Growth Rates (CAGRs) consistently in the double digits. Adoption metrics for advanced ITOA features, such as AIOps (Artificial Intelligence for IT Operations), have seen exponential increases, indicating a strong industry-wide embrace of intelligent automation. The ongoing study period up to 2033 anticipates this trend to continue, with further refinements in AI/ML capabilities, greater integration with DevOps workflows, and the emergence of ITOA solutions tailored for emerging technologies like IoT and edge computing. The market's capacity to adapt to these technological shifts and evolving business needs underscores its robust growth potential.
Leading Regions, Countries, or Segments in IT Operation Analytics Industry
Within the IT Operation Analytics industry, the Cloud-Based deployment segment is emerging as a dominant force, driven by its inherent scalability, flexibility, and cost-efficiency. This segment is particularly influential across key end-user industries such as BFSI, Telecommunication, and Healthcare, where rapid innovation and the need for real-time data processing are paramount. North America, spearheaded by the United States, is consistently leading in terms of market share and adoption rates. Key drivers for this dominance include substantial investments in digital transformation initiatives, a mature technology ecosystem, and a high concentration of large enterprises actively seeking advanced ITOA solutions. The regulatory support for data privacy and security further solidifies the adoption of sophisticated cloud-based ITOA platforms in sectors like Healthcare.
- Deployment: The shift towards Cloud-Based solutions is a significant trend. While On-premise deployments still hold a considerable market share, particularly for organizations with strict data sovereignty requirements or legacy infrastructure, the agility and accessibility offered by cloud platforms are increasingly attractive. This is evident in the growing market penetration of SaaS-based ITOA offerings.
- Application: Business & IT Services Monitoring is a critical application area, demonstrating high demand. ITOA solutions that provide end-to-end visibility into service delivery, from underlying infrastructure to user experience, are highly valued. Application Monitoring and Infrastructure Monitoring remain foundational, but their integration into broader service assurance frameworks is what truly propels their importance.
- End-user Industry: The BFSI sector is a prime adopter of ITOA due to its critical reliance on uptime and security, coupled with stringent regulatory compliance mandates. The Telecommunication industry leverages ITOA for network performance optimization and customer experience management, essential for retaining subscribers in a competitive market. The Healthcare sector utilizes ITOA for ensuring the reliability of patient care systems and sensitive data management.
- Investment Trends: Significant venture capital and private equity investments are flowing into ITOA companies, particularly those focusing on AI/ML capabilities and cloud-native solutions. This fuels innovation and market expansion.
- Regulatory Support: While not directly mandating ITOA, regulations related to data privacy (e.g., GDPR, CCPA) and cybersecurity indirectly drive the adoption of comprehensive monitoring and analytics tools to ensure compliance and threat detection.
- Technological Advancements: Continuous innovation in areas like AIOps, predictive analytics, and observability platforms is making ITOA solutions more powerful and indispensable.
The dominance of Cloud-Based deployments and the strong performance in BFSI, Telecommunication, and Healthcare sectors within the North American region, fueled by robust investment and technological maturity, are the defining characteristics of the current IT Operation Analytics industry landscape.
IT Operation Analytics Industry Product Innovations
Product innovation in the IT Operation Analytics industry is primarily focused on enhancing predictive capabilities and automating complex IT tasks. Leading companies are integrating advanced AI and Machine Learning algorithms to move beyond simple anomaly detection towards genuine predictive maintenance and root cause analysis. Innovations include real-time correlation of disparate data sources to pinpoint performance bottlenecks, proactive identification of potential security threats, and automated remediation workflows. Unique selling propositions often lie in the platform's ability to provide actionable insights that directly translate into reduced downtime, improved resource utilization, and enhanced end-user experience. For example, advancements in AIOps platforms are enabling self-healing IT infrastructures, a significant leap in operational efficiency.
Propelling Factors for IT Operation Analytics Industry Growth
The growth of the IT Operation Analytics industry is propelled by several interconnected factors. The escalating complexity of modern IT infrastructures, characterized by the widespread adoption of cloud computing, microservices, and the Internet of Things (IoT), necessitates sophisticated monitoring and analytical tools. Economic drivers include the continuous pressure on businesses to reduce operational costs and improve efficiency; ITOA solutions directly contribute to this by minimizing downtime and optimizing resource allocation. Regulatory compliance, particularly in sectors like BFSI and Healthcare, mandates robust data visibility and security, further fueling demand for comprehensive analytics. For example, the increasing adoption of digital transformation strategies across industries is intrinsically linked to the need for reliable IT operations, making ITOA indispensable.
Obstacles in the IT Operation Analytics Industry Market
Despite robust growth, the IT Operation Analytics industry faces several obstacles. The complexity of integrating disparate data sources from various IT systems and applications can be a significant challenge, requiring considerable technical expertise and investment. The scarcity of skilled professionals proficient in data analytics, AI, and ITOA platforms poses a constraint on widespread adoption and effective implementation. Furthermore, the initial cost of implementing comprehensive ITOA solutions can be substantial, posing a barrier for small and medium-sized enterprises. Supply chain disruptions, particularly for hardware-dependent on-premise solutions, can also impact deployment timelines and availability. Competitive pressures among numerous vendors can also lead to market fragmentation and challenges in clear differentiation for some solutions.
Future Opportunities in IT Operation Analytics Industry
Emerging opportunities in the IT Operation Analytics industry are abundant, driven by technological advancements and evolving business needs. The increasing prevalence of edge computing and IoT devices presents a vast new landscape for monitoring and analysis, creating demand for specialized ITOA solutions. The continued development and integration of Artificial Intelligence, particularly Generative AI, offer opportunities to automate more complex analytical tasks and provide even more intuitive user interfaces. Furthermore, the growing focus on sustainability and energy efficiency within IT operations creates a niche for ITOA solutions that can monitor and optimize power consumption. The expanding market for observability platforms, which combine metrics, logs, and traces, represents a significant growth avenue.
Major Players in the IT Operation Analytics Industry Ecosystem
- INETCO Systems Limited
- WNS (Holdings) Limited
- OpsDataStore Inc
- Evolven Software Inc
- XpoLog Ltd
- Micro Focus International PLC (HPE Software BU)
- CA Technology Inc (Broadcom Inc )
- IBM Corp
- BMC Software Inc
- Oracle Corp
- Interlink Software Services Ltd
- VMware Inc
- Splunk Inc
Key Developments in IT Operation Analytics Industry Industry
- March 2024: Splunk Inc. launched enhanced AI capabilities within its observability platform, further strengthening its predictive analytics offerings.
- February 2024: IBM Corp. announced strategic partnerships aimed at expanding the reach of its AI-driven IT automation solutions into new enterprise segments.
- January 2024: BMC Software Inc. unveiled updates to its ITSM suite, integrating deeper ITOA functionalities for improved service delivery.
- December 2023: Broadcom Inc. (through its acquisition of CA Technologies) continued to integrate advanced analytics into its enterprise software portfolio.
- November 2023: VMware Inc. introduced new cloud-native analytics tools to support its expanding cloud management offerings.
- October 2023: Micro Focus International PLC (HPE Software BU) focused on enhancing its hybrid cloud management capabilities with advanced ITOA features.
- September 2023: WNS (Holdings) Limited emphasized its managed ITOA services, catering to enterprises seeking outsourcing solutions.
- August 2023: Evolven Software Inc. released advancements in its platform for continuous optimization of application performance.
- July 2023: OpsDataStore Inc. expanded its real-time data analytics capabilities for IT operations.
- June 2023: XpoLog Ltd. focused on simplifying log analysis with its AI-powered platform.
- May 2023: INETCO Systems Limited continued to innovate in the area of real-time payment processing analytics.
- April 2023: Oracle Corp. enhanced its cloud infrastructure monitoring tools with advanced ITOA features.
- March 2023: Interlink Software Services Ltd. showcased its integrated IT service management and operations analytics solutions.
Strategic IT Operation Analytics Industry Market Forecast
The IT Operation Analytics industry is poised for significant growth, driven by the relentless digital transformation across all sectors. The forecasted market expansion is fueled by the increasing demand for real-time insights, predictive capabilities, and automated operational processes. Key growth catalysts include the widespread adoption of AI and Machine Learning, the continuous evolution of cloud-native architectures, and the growing imperative for seamless end-user experiences. The market's potential lies in its ability to empower organizations with unprecedented control and visibility over their complex IT environments, leading to enhanced resilience, cost optimization, and ultimately, a competitive edge. The forecast period of 2025–2033 will see a maturation of AIOps and a broader integration of ITOA into core business strategy.
IT Operation Analytics Industry Segmentation
-
1. Deployment
- 1.1. Cloud Based
- 1.2. On-premise
-
2. Application
- 2.1. Application Monitoring
- 2.2. Business & IT Services Monitoring
- 2.3. Infrastructure Monitoring
- 2.4. Other Applications
-
3. End-user Industry
- 3.1. BFSI
- 3.2. Healthcare
- 3.3. Telecommunication
- 3.4. Retail
- 3.5. Industrial
- 3.6. Other End-user Industries
IT Operation Analytics Industry Segmentation By Geography
- 1. North America
- 2. Europe
- 3. Asia Pacific
- 4. Rest of the World
IT Operation Analytics Industry Regional Market Share
Geographic Coverage of IT Operation Analytics Industry
IT Operation Analytics Industry REPORT HIGHLIGHTS
| Aspects | Details |
|---|---|
| Study Period | 2020-2034 |
| Base Year | 2025 |
| Estimated Year | 2026 |
| Forecast Period | 2026-2034 |
| Historical Period | 2020-2025 |
| Growth Rate | CAGR of 22.6% from 2020-2034 |
| Segmentation |
|
Table of Contents
- 1. Introduction
- 1.1. Research Scope
- 1.2. Market Segmentation
- 1.3. Research Objective
- 1.4. Definitions and Assumptions
- 2. Executive Summary
- 2.1. Market Snapshot
- 3. Market Dynamics
- 3.1. Market Drivers
- 3.2. Market Restrains
- 3.3. Market Trends
- 3.4. Market Opportunities
- 4. Market Factor Analysis
- 4.1. Porters Five Forces
- 4.1.1. Bargaining Power of Suppliers
- 4.1.2. Bargaining Power of Buyers
- 4.1.3. Threat of New Entrants
- 4.1.4. Threat of Substitutes
- 4.1.5. Competitive Rivalry
- 4.2. PESTEL analysis
- 4.3. BCG Analysis
- 4.3.1. Stars (High Growth, High Market Share)
- 4.3.2. Cash Cows (Low Growth, High Market Share)
- 4.3.3. Question Mark (High Growth, Low Market Share)
- 4.3.4. Dogs (Low Growth, Low Market Share)
- 4.4. Ansoff Matrix Analysis
- 4.5. Supply Chain Analysis
- 4.6. Regulatory Landscape
- 4.7. Current Market Potential and Opportunity Assessment (TAM–SAM–SOM Framework)
- 4.8. DMV Analyst Note
- 4.1. Porters Five Forces
- 5. Market Analysis, Insights and Forecast 2021-2033
- 5.1. Market Analysis, Insights and Forecast - by Deployment
- 5.1.1. Cloud Based
- 5.1.2. On-premise
- 5.2. Market Analysis, Insights and Forecast - by Application
- 5.2.1. Application Monitoring
- 5.2.2. Business & IT Services Monitoring
- 5.2.3. Infrastructure Monitoring
- 5.2.4. Other Applications
- 5.3. Market Analysis, Insights and Forecast - by End-user Industry
- 5.3.1. BFSI
- 5.3.2. Healthcare
- 5.3.3. Telecommunication
- 5.3.4. Retail
- 5.3.5. Industrial
- 5.3.6. Other End-user Industries
- 5.4. Market Analysis, Insights and Forecast - by Region
- 5.4.1. North America
- 5.4.2. Europe
- 5.4.3. Asia Pacific
- 5.4.4. Rest of the World
- 5.1. Market Analysis, Insights and Forecast - by Deployment
- 6. Global IT Operation Analytics Industry Analysis, Insights and Forecast, 2021-2033
- 6.1. Market Analysis, Insights and Forecast - by Deployment
- 6.1.1. Cloud Based
- 6.1.2. On-premise
- 6.2. Market Analysis, Insights and Forecast - by Application
- 6.2.1. Application Monitoring
- 6.2.2. Business & IT Services Monitoring
- 6.2.3. Infrastructure Monitoring
- 6.2.4. Other Applications
- 6.3. Market Analysis, Insights and Forecast - by End-user Industry
- 6.3.1. BFSI
- 6.3.2. Healthcare
- 6.3.3. Telecommunication
- 6.3.4. Retail
- 6.3.5. Industrial
- 6.3.6. Other End-user Industries
- 6.1. Market Analysis, Insights and Forecast - by Deployment
- 7. North America IT Operation Analytics Industry Analysis, Insights and Forecast, 2020-2032
- 7.1. Market Analysis, Insights and Forecast - by Deployment
- 7.1.1. Cloud Based
- 7.1.2. On-premise
- 7.2. Market Analysis, Insights and Forecast - by Application
- 7.2.1. Application Monitoring
- 7.2.2. Business & IT Services Monitoring
- 7.2.3. Infrastructure Monitoring
- 7.2.4. Other Applications
- 7.3. Market Analysis, Insights and Forecast - by End-user Industry
- 7.3.1. BFSI
- 7.3.2. Healthcare
- 7.3.3. Telecommunication
- 7.3.4. Retail
- 7.3.5. Industrial
- 7.3.6. Other End-user Industries
- 7.1. Market Analysis, Insights and Forecast - by Deployment
- 8. Europe IT Operation Analytics Industry Analysis, Insights and Forecast, 2020-2032
- 8.1. Market Analysis, Insights and Forecast - by Deployment
- 8.1.1. Cloud Based
- 8.1.2. On-premise
- 8.2. Market Analysis, Insights and Forecast - by Application
- 8.2.1. Application Monitoring
- 8.2.2. Business & IT Services Monitoring
- 8.2.3. Infrastructure Monitoring
- 8.2.4. Other Applications
- 8.3. Market Analysis, Insights and Forecast - by End-user Industry
- 8.3.1. BFSI
- 8.3.2. Healthcare
- 8.3.3. Telecommunication
- 8.3.4. Retail
- 8.3.5. Industrial
- 8.3.6. Other End-user Industries
- 8.1. Market Analysis, Insights and Forecast - by Deployment
- 9. Asia Pacific IT Operation Analytics Industry Analysis, Insights and Forecast, 2020-2032
- 9.1. Market Analysis, Insights and Forecast - by Deployment
- 9.1.1. Cloud Based
- 9.1.2. On-premise
- 9.2. Market Analysis, Insights and Forecast - by Application
- 9.2.1. Application Monitoring
- 9.2.2. Business & IT Services Monitoring
- 9.2.3. Infrastructure Monitoring
- 9.2.4. Other Applications
- 9.3. Market Analysis, Insights and Forecast - by End-user Industry
- 9.3.1. BFSI
- 9.3.2. Healthcare
- 9.3.3. Telecommunication
- 9.3.4. Retail
- 9.3.5. Industrial
- 9.3.6. Other End-user Industries
- 9.1. Market Analysis, Insights and Forecast - by Deployment
- 10. Rest of the World IT Operation Analytics Industry Analysis, Insights and Forecast, 2020-2032
- 10.1. Market Analysis, Insights and Forecast - by Deployment
- 10.1.1. Cloud Based
- 10.1.2. On-premise
- 10.2. Market Analysis, Insights and Forecast - by Application
- 10.2.1. Application Monitoring
- 10.2.2. Business & IT Services Monitoring
- 10.2.3. Infrastructure Monitoring
- 10.2.4. Other Applications
- 10.3. Market Analysis, Insights and Forecast - by End-user Industry
- 10.3.1. BFSI
- 10.3.2. Healthcare
- 10.3.3. Telecommunication
- 10.3.4. Retail
- 10.3.5. Industrial
- 10.3.6. Other End-user Industries
- 10.1. Market Analysis, Insights and Forecast - by Deployment
- 11. Competitive Analysis
- 11.1. Company Profiles
- 11.1.1 INETCO Systems Limited
- 11.1.1.1. Company Overview
- 11.1.1.2. Products
- 11.1.1.3. Company Financials
- 11.1.1.4. SWOT Analysis
- 11.1.2 WNS (Holdings) Limited*List Not Exhaustive
- 11.1.2.1. Company Overview
- 11.1.2.2. Products
- 11.1.2.3. Company Financials
- 11.1.2.4. SWOT Analysis
- 11.1.3 OpsDataStore Inc
- 11.1.3.1. Company Overview
- 11.1.3.2. Products
- 11.1.3.3. Company Financials
- 11.1.3.4. SWOT Analysis
- 11.1.4 Evolven Software Inc
- 11.1.4.1. Company Overview
- 11.1.4.2. Products
- 11.1.4.3. Company Financials
- 11.1.4.4. SWOT Analysis
- 11.1.5 XpoLog Ltd
- 11.1.5.1. Company Overview
- 11.1.5.2. Products
- 11.1.5.3. Company Financials
- 11.1.5.4. SWOT Analysis
- 11.1.6 Micro Focus International PLC (HPE Software BU)
- 11.1.6.1. Company Overview
- 11.1.6.2. Products
- 11.1.6.3. Company Financials
- 11.1.6.4. SWOT Analysis
- 11.1.7 CA Technology Inc (Broadcom Inc )
- 11.1.7.1. Company Overview
- 11.1.7.2. Products
- 11.1.7.3. Company Financials
- 11.1.7.4. SWOT Analysis
- 11.1.8 IBM Corp
- 11.1.8.1. Company Overview
- 11.1.8.2. Products
- 11.1.8.3. Company Financials
- 11.1.8.4. SWOT Analysis
- 11.1.9 BMC Software Inc
- 11.1.9.1. Company Overview
- 11.1.9.2. Products
- 11.1.9.3. Company Financials
- 11.1.9.4. SWOT Analysis
- 11.1.10 Oracle Corp
- 11.1.10.1. Company Overview
- 11.1.10.2. Products
- 11.1.10.3. Company Financials
- 11.1.10.4. SWOT Analysis
- 11.1.11 Interlink Software Services Ltd
- 11.1.11.1. Company Overview
- 11.1.11.2. Products
- 11.1.11.3. Company Financials
- 11.1.11.4. SWOT Analysis
- 11.1.12 VMware Inc
- 11.1.12.1. Company Overview
- 11.1.12.2. Products
- 11.1.12.3. Company Financials
- 11.1.12.4. SWOT Analysis
- 11.1.13 Splunk Inc
- 11.1.13.1. Company Overview
- 11.1.13.2. Products
- 11.1.13.3. Company Financials
- 11.1.13.4. SWOT Analysis
- 11.1.1 INETCO Systems Limited
- 11.2. Market Entropy
- 11.2.1 Company's Key Areas Served
- 11.2.2 Recent Developments
- 11.3. Company Market Share Analysis 2025
- 11.3.1 Top 5 Companies Market Share Analysis
- 11.3.2 Top 3 Companies Market Share Analysis
- 11.4. List of Potential Customers
- 12. Research Methodology
List of Figures
- Figure 1: Global IT Operation Analytics Industry Revenue Breakdown (billion, %) by Region 2025 & 2033
- Figure 2: North America IT Operation Analytics Industry Revenue (billion), by Deployment 2025 & 2033
- Figure 3: North America IT Operation Analytics Industry Revenue Share (%), by Deployment 2025 & 2033
- Figure 4: North America IT Operation Analytics Industry Revenue (billion), by Application 2025 & 2033
- Figure 5: North America IT Operation Analytics Industry Revenue Share (%), by Application 2025 & 2033
- Figure 6: North America IT Operation Analytics Industry Revenue (billion), by End-user Industry 2025 & 2033
- Figure 7: North America IT Operation Analytics Industry Revenue Share (%), by End-user Industry 2025 & 2033
- Figure 8: North America IT Operation Analytics Industry Revenue (billion), by Country 2025 & 2033
- Figure 9: North America IT Operation Analytics Industry Revenue Share (%), by Country 2025 & 2033
- Figure 10: Europe IT Operation Analytics Industry Revenue (billion), by Deployment 2025 & 2033
- Figure 11: Europe IT Operation Analytics Industry Revenue Share (%), by Deployment 2025 & 2033
- Figure 12: Europe IT Operation Analytics Industry Revenue (billion), by Application 2025 & 2033
- Figure 13: Europe IT Operation Analytics Industry Revenue Share (%), by Application 2025 & 2033
- Figure 14: Europe IT Operation Analytics Industry Revenue (billion), by End-user Industry 2025 & 2033
- Figure 15: Europe IT Operation Analytics Industry Revenue Share (%), by End-user Industry 2025 & 2033
- Figure 16: Europe IT Operation Analytics Industry Revenue (billion), by Country 2025 & 2033
- Figure 17: Europe IT Operation Analytics Industry Revenue Share (%), by Country 2025 & 2033
- Figure 18: Asia Pacific IT Operation Analytics Industry Revenue (billion), by Deployment 2025 & 2033
- Figure 19: Asia Pacific IT Operation Analytics Industry Revenue Share (%), by Deployment 2025 & 2033
- Figure 20: Asia Pacific IT Operation Analytics Industry Revenue (billion), by Application 2025 & 2033
- Figure 21: Asia Pacific IT Operation Analytics Industry Revenue Share (%), by Application 2025 & 2033
- Figure 22: Asia Pacific IT Operation Analytics Industry Revenue (billion), by End-user Industry 2025 & 2033
- Figure 23: Asia Pacific IT Operation Analytics Industry Revenue Share (%), by End-user Industry 2025 & 2033
- Figure 24: Asia Pacific IT Operation Analytics Industry Revenue (billion), by Country 2025 & 2033
- Figure 25: Asia Pacific IT Operation Analytics Industry Revenue Share (%), by Country 2025 & 2033
- Figure 26: Rest of the World IT Operation Analytics Industry Revenue (billion), by Deployment 2025 & 2033
- Figure 27: Rest of the World IT Operation Analytics Industry Revenue Share (%), by Deployment 2025 & 2033
- Figure 28: Rest of the World IT Operation Analytics Industry Revenue (billion), by Application 2025 & 2033
- Figure 29: Rest of the World IT Operation Analytics Industry Revenue Share (%), by Application 2025 & 2033
- Figure 30: Rest of the World IT Operation Analytics Industry Revenue (billion), by End-user Industry 2025 & 2033
- Figure 31: Rest of the World IT Operation Analytics Industry Revenue Share (%), by End-user Industry 2025 & 2033
- Figure 32: Rest of the World IT Operation Analytics Industry Revenue (billion), by Country 2025 & 2033
- Figure 33: Rest of the World IT Operation Analytics Industry Revenue Share (%), by Country 2025 & 2033
List of Tables
- Table 1: Global IT Operation Analytics Industry Revenue billion Forecast, by Deployment 2020 & 2033
- Table 2: Global IT Operation Analytics Industry Revenue billion Forecast, by Application 2020 & 2033
- Table 3: Global IT Operation Analytics Industry Revenue billion Forecast, by End-user Industry 2020 & 2033
- Table 4: Global IT Operation Analytics Industry Revenue billion Forecast, by Region 2020 & 2033
- Table 5: Global IT Operation Analytics Industry Revenue billion Forecast, by Deployment 2020 & 2033
- Table 6: Global IT Operation Analytics Industry Revenue billion Forecast, by Application 2020 & 2033
- Table 7: Global IT Operation Analytics Industry Revenue billion Forecast, by End-user Industry 2020 & 2033
- Table 8: Global IT Operation Analytics Industry Revenue billion Forecast, by Country 2020 & 2033
- Table 9: Global IT Operation Analytics Industry Revenue billion Forecast, by Deployment 2020 & 2033
- Table 10: Global IT Operation Analytics Industry Revenue billion Forecast, by Application 2020 & 2033
- Table 11: Global IT Operation Analytics Industry Revenue billion Forecast, by End-user Industry 2020 & 2033
- Table 12: Global IT Operation Analytics Industry Revenue billion Forecast, by Country 2020 & 2033
- Table 13: Global IT Operation Analytics Industry Revenue billion Forecast, by Deployment 2020 & 2033
- Table 14: Global IT Operation Analytics Industry Revenue billion Forecast, by Application 2020 & 2033
- Table 15: Global IT Operation Analytics Industry Revenue billion Forecast, by End-user Industry 2020 & 2033
- Table 16: Global IT Operation Analytics Industry Revenue billion Forecast, by Country 2020 & 2033
- Table 17: Global IT Operation Analytics Industry Revenue billion Forecast, by Deployment 2020 & 2033
- Table 18: Global IT Operation Analytics Industry Revenue billion Forecast, by Application 2020 & 2033
- Table 19: Global IT Operation Analytics Industry Revenue billion Forecast, by End-user Industry 2020 & 2033
- Table 20: Global IT Operation Analytics Industry Revenue billion Forecast, by Country 2020 & 2033
Frequently Asked Questions
1. What is the projected Compound Annual Growth Rate (CAGR) of the IT Operation Analytics Industry?
The projected CAGR is approximately 22.6%.
2. Which companies are prominent players in the IT Operation Analytics Industry?
Key companies in the market include INETCO Systems Limited, WNS (Holdings) Limited*List Not Exhaustive, OpsDataStore Inc, Evolven Software Inc, XpoLog Ltd, Micro Focus International PLC (HPE Software BU), CA Technology Inc (Broadcom Inc ), IBM Corp, BMC Software Inc, Oracle Corp, Interlink Software Services Ltd, VMware Inc, Splunk Inc.
3. What are the main segments of the IT Operation Analytics Industry?
The market segments include Deployment, Application, End-user Industry.
4. Can you provide details about the market size?
The market size is estimated to be USD 13.16 billion as of 2022.
5. What are some drivers contributing to market growth?
; Rising Growth of Cloud Adoption Among the ITes; Rising Demand for Analytics across Various Segments of End-user Industries.
6. What are the notable trends driving market growth?
Industrial Sector is Gaining Traction Due to Emergence of ITOA Across Cloud-Based Platform.
7. Are there any restraints impacting market growth?
; Initial Investment in Toolsets in terms of Data and Human-Machine Interaction.
8. Can you provide examples of recent developments in the market?
N/A
9. What pricing options are available for accessing the report?
Pricing options include single-user, multi-user, and enterprise licenses priced at USD 4750, USD 5250, and USD 8750 respectively.
10. Is the market size provided in terms of value or volume?
The market size is provided in terms of value, measured in billion.
11. Are there any specific market keywords associated with the report?
Yes, the market keyword associated with the report is "IT Operation Analytics Industry," which aids in identifying and referencing the specific market segment covered.
12. How do I determine which pricing option suits my needs best?
The pricing options vary based on user requirements and access needs. Individual users may opt for single-user licenses, while businesses requiring broader access may choose multi-user or enterprise licenses for cost-effective access to the report.
13. Are there any additional resources or data provided in the IT Operation Analytics Industry report?
While the report offers comprehensive insights, it's advisable to review the specific contents or supplementary materials provided to ascertain if additional resources or data are available.
14. How can I stay updated on further developments or reports in the IT Operation Analytics Industry?
To stay informed about further developments, trends, and reports in the IT Operation Analytics Industry, consider subscribing to industry newsletters, following relevant companies and organizations, or regularly checking reputable industry news sources and publications.
Methodology
Step 1 - Identification of Relevant Samples Size from Population Database


Step 2 - Approaches for Defining Global Market Size (Value, Volume* & Price*)

Note*: In applicable scenarios
Step 3 - Data Sources
Primary Research
- Web Analytics
- Survey Reports
- Research Institute
- Latest Research Reports
- Opinion Leaders
Secondary Research
- Annual Reports
- White Paper
- Latest Press Release
- Industry Association
- Paid Database
- Investor Presentations

Step 4 - Data Triangulation
Involves using different sources of information in order to increase the validity of a study
These sources are likely to be stakeholders in a program - participants, other researchers, program staff, other community members, and so on.
Then we put all data in single framework & apply various statistical tools to find out the dynamic on the market.
During the analysis stage, feedback from the stakeholder groups would be compared to determine areas of agreement as well as areas of divergence