

Key Insights
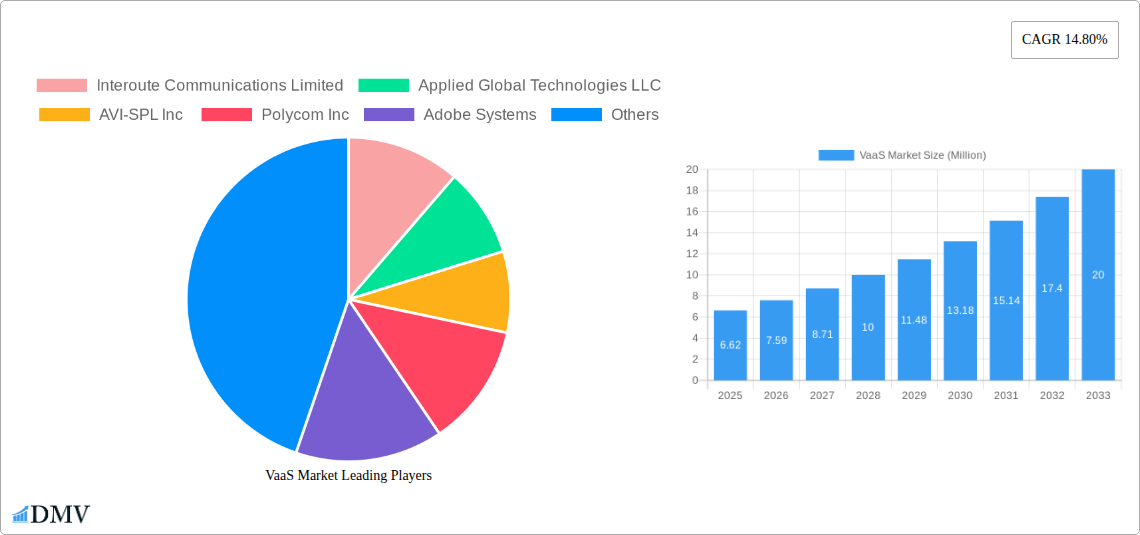
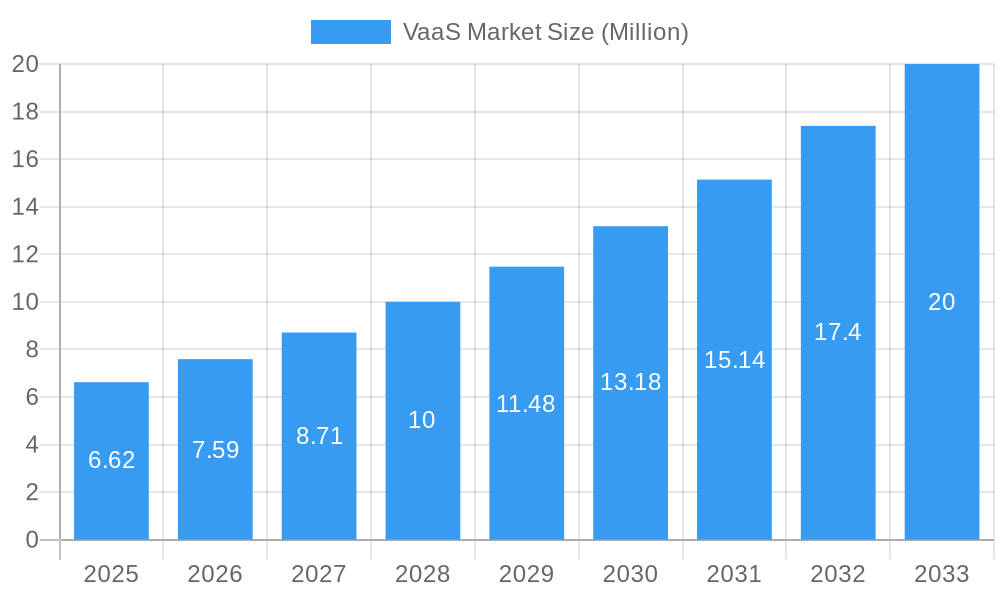
The Video as a Service (VaaS) market is poised for substantial expansion, projected to reach $6.62 Million by 2025, with a robust Compound Annual Growth Rate (CAGR) of 14.80%. This remarkable growth is primarily fueled by the increasing demand for seamless communication and collaboration across diverse industries. Key drivers include the widespread adoption of remote work policies, the growing need for enhanced employee training and development programs, and the burgeoning use of video conferencing for virtual events and customer engagement. Technological advancements in areas like AI-powered video analytics, enhanced audio-visual quality, and secure cloud-based infrastructure are further accelerating market penetration. The market’s expansion is further supported by the increasing integration of VaaS solutions with other enterprise applications, offering a more comprehensive and integrated communication experience.
VaaS Market Market Size (In Million)
The VaaS market is segmented across various platforms, including Application Management, Device Management, and Network Management, catering to a wide array of devices such as Mobility Devices and Enterprise Computing hardware. Service offerings span Managed, Professional, and Deployment Models like Public, Private, and Hybrid Clouds, demonstrating the market's flexibility to meet varied organizational needs. Key end-user industries such as Government and Defense, BFSI, Healthcare, IT & Telecom, Media & Entertainment, and Manufacturing are actively integrating VaaS to streamline operations and improve communication efficiencies. While the market presents significant opportunities, potential restraints such as data security concerns and the initial cost of integration for smaller enterprises need to be addressed to ensure sustained and inclusive growth across all regions. The market anticipates significant contributions from North America and Europe, with substantial growth potential emerging in the Asia-Pacific region.
VaaS Market Company Market Share
This comprehensive report offers an in-depth analysis of the global VaaS (Video as a Service) market, a rapidly expanding sector driven by the escalating demand for seamless communication and collaboration solutions across diverse industries. The study meticulously examines market dynamics, key trends, and future trajectories from 2019 to 2033, with a base and estimated year of 2025 and a forecast period of 2025–2033, encompassing the historical period of 2019–2024. Leveraging high-ranking keywords such as VaaS market growth, video conferencing solutions, unified communications, collaboration platforms, and remote work technology, this report is designed to empower stakeholders with actionable insights and strategic foresight.
VaaS Market Market Composition & Trends
The VaaS market exhibits a dynamic composition characterized by evolving innovation catalysts and a robust regulatory landscape that underpins secure and reliable video communication. Market concentration is influenced by strategic partnerships and a continuous influx of new entrants vying for market share. Innovation is largely driven by advancements in AI-powered features, enhanced audio-visual quality, and seamless integration across devices and platforms. Substitute products, while present, often fall short of the comprehensive capabilities offered by integrated VaaS solutions, particularly in enterprise settings. End-user profiles range from individual professionals seeking efficient remote work tools to large enterprises demanding scalable and secure communication infrastructure. Mergers and acquisitions (M&A) are significant, with recent deal values in the multi-million dollar range, indicating consolidation and strategic expansion within the VaaS ecosystem. The market is projected to reach $XXX Billion by 2033, with a CAGR of XX% during the forecast period. Key M&A activities and market share distribution are detailed within the report.
VaaS Market Industry Evolution
The VaaS industry has undergone a significant evolution, transforming from basic video conferencing tools to sophisticated, integrated platforms that are fundamental to modern business operations. This evolution is characterized by rapid technological advancements and a discernible shift in consumer and enterprise demands, largely propelled by the global adoption of remote and hybrid work models. Early VaaS solutions were primarily focused on point-to-point video calls, but the market has since expanded to encompass a wide array of features including screen sharing, virtual whiteboards, recording capabilities, and advanced analytics. The proliferation of mobile devices and the increasing reliance on cloud infrastructure have been instrumental in this growth, making VaaS solutions accessible and scalable for organizations of all sizes. Furthermore, the integration of AI and machine learning has led to innovations such as intelligent noise cancellation, automatic transcription, and personalized meeting experiences, further enhancing user engagement and productivity. The VaaS market size is projected to experience a substantial surge, driven by these technological leaps and the persistent need for effective virtual collaboration. Adoption metrics show a significant increase in the utilization of VaaS platforms for internal meetings, client interactions, and even large-scale virtual events. The market growth trajectory is expected to remain steep as organizations continue to invest in robust communication and collaboration tools to maintain competitiveness and operational efficiency. The increasing dependency on VaaS for business continuity and the growing adoption in emerging economies are key indicators of the industry's robust expansion.
Leading Regions, Countries, or Segments in VaaS Market
The VaaS market is experiencing dominance from specific regions and segments, driven by distinct factors. In terms of Platform, Application Management is a key driver, with organizations prioritizing solutions that seamlessly integrate with their existing software ecosystems. This is particularly evident in the IT & Telecom and Media & Entertainment end-user industries, where rapid innovation and extensive digital workflows necessitate highly integrated VaaS offerings.
Dominant Platform Segment: Application Management
- Key Driver: The increasing need for unified workflows and reduced friction in daily operations.
- Impact: Enterprises are actively seeking VaaS solutions that offer deep integrations with CRM, project management tools, and other business-critical applications. This allows for a more cohesive and efficient communication experience.
Dominant Device Segment: Mobility Devices
- Key Driver: The widespread adoption of smartphones and tablets, coupled with the rise of remote and field-based workforces.
- Impact: VaaS providers are optimizing their platforms for seamless performance on mobile devices, ensuring accessibility and productivity for users on the go. This segment is crucial for industries like Healthcare (telemedicine) and Government and Defense.
Dominant Service Type: Managed Services
- Key Driver: The growing complexity of VaaS deployments and the desire for outsourced expertise in managing and optimizing these solutions.
- Impact: Many organizations prefer managed VaaS to reduce IT overhead, ensure compliance, and leverage the specialized knowledge of service providers. This is particularly relevant for BFSI institutions requiring high levels of security and reliability.
Dominant Deployment Model: Public Cloud
- Key Driver: Scalability, cost-effectiveness, and ease of deployment offered by public cloud infrastructure.
- Impact: Public cloud VaaS solutions enable businesses to quickly scale their communication capabilities up or down as needed, without significant upfront investment in hardware.
Dominant End-user Industry: IT & Telecom
- Key Driver: The inherent need for robust communication and collaboration tools within the technology sector, coupled with a high propensity for early adoption of new technologies.
- Impact: This industry leads in the adoption and development of advanced VaaS features, setting trends for other sectors.
The BFSI sector also shows significant adoption due to the critical need for secure and compliant communication. Healthcare is rapidly expanding its use for telehealth services, and Government and Defense leverage VaaS for secure command and control. Investment trends in these regions are skewed towards enhancing security, AI capabilities, and interoperability, further solidifying their dominance in the VaaS market share.
VaaS Market Product Innovations
Recent product innovations in the VaaS market are significantly enhancing user experience and operational efficiency. Developers are integrating advanced AI features for real-time translation, sentiment analysis during calls, and automated meeting summaries, thereby boosting productivity and engagement. Furthermore, significant advancements have been made in audio and video quality, with the introduction of higher resolution streaming and adaptive audio technologies that minimize background noise and optimize sound clarity in diverse environments. Enhanced security protocols, including end-to-end encryption and granular access controls, are also becoming standard, addressing the growing concerns around data privacy. The development of more intuitive user interfaces and broader cross-platform compatibility are also key innovations, ensuring seamless accessibility and functionality across all devices. These advancements are transforming how businesses conduct meetings, collaborate, and communicate.
Propelling Factors for VaaS Market Growth
The VaaS market is experiencing robust growth propelled by several key factors. The persistent global shift towards remote and hybrid work models is a primary driver, necessitating effective virtual collaboration tools. Technological advancements in cloud computing, AI, and high-speed internet infrastructure have made VaaS solutions more accessible, reliable, and feature-rich. The increasing need for enhanced employee productivity and operational efficiency across various industries, from IT & Telecom to Healthcare and Media & Entertainment, further fuels demand. Moreover, the growing emphasis on cost-effectiveness through reduced travel expenses and the ability to connect with a global talent pool are significant economic influences. Regulatory support for digital transformation initiatives in certain regions also contributes to market expansion.
Obstacles in the VaaS Market Market
Despite its significant growth, the VaaS market faces certain obstacles. Regulatory challenges, particularly concerning data privacy and cross-border data transfer, can create complexities for global VaaS providers. Supply chain disruptions can impact the availability of hardware components for on-premises VaaS solutions, although this is less of a concern for cloud-based services. Intense competitive pressures among a large number of players can lead to price wars and necessitate continuous innovation to maintain market share. Moreover, the initial cost of implementation and the need for employee training can act as barriers for some smaller businesses. Ensuring consistent network performance and managing security vulnerabilities remain ongoing challenges that require constant vigilance and investment.
Future Opportunities in VaaS Market
The VaaS market is ripe with future opportunities, particularly in the integration of advanced AI for personalized user experiences and intelligent automation. The burgeoning market for virtual and augmented reality (VR/AR) presents a significant opportunity for immersive VaaS solutions, transforming remote collaboration into more engaging and interactive experiences. Expansion into emerging economies with rapidly digitizing workforces offers substantial untapped potential. Furthermore, the increasing demand for specialized VaaS solutions catering to niche industries like education (virtual classrooms) and remote healthcare diagnostics (telemedicine) will drive market growth. The development of more secure and compliant VaaS platforms for highly regulated sectors such as finance and government also represents a significant opportunity.
Major Players in the VaaS Market Ecosystem
- Interoute Communications Limited
- Applied Global Technologies LLC
- AVI-SPL Inc
- Polycom Inc
- Adobe Systems
- Cisco Systems Inc
- Avaya Inc
- BlueJeans Network
- Huawei Technologies Co Limited
- Vidyo Inc
Key Developments in VaaS Market Industry
- November 2022: Tesla announced the integration of the Zoom app into its vehicles, allowing drivers to make or receive video conversations directly on the central touchscreen. This innovation utilizes the in-car camera, marking a significant advancement in in-car communication technology.
- October 2022: Cisco and Microsoft Corp. unveiled a new alliance at Microsoft's Ignite conference. This partnership will enable Microsoft Teams to be the default experience for users and allow Teams to run natively on Cisco room and desk devices certified for Microsoft Teams, enhancing interoperability and user choice.
Strategic VaaS Market Market Forecast
The strategic VaaS market forecast indicates a sustained period of robust growth, driven by the increasing digitalization of business operations and the enduring shift towards flexible work environments. Future opportunities lie in the deeper integration of AI for enhanced user experience and automation, the development of immersive VR/AR VaaS solutions, and the expansion into emerging markets and niche industry applications. The market's trajectory will be further shaped by continued technological innovation, particularly in areas of enhanced security, interoperability, and real-time collaboration capabilities, solidifying VaaS as an indispensable component of modern business communication infrastructure. The market is poised for significant expansion as organizations prioritize agility and connectivity.
VaaS Market Segmentation
-
1. Platform
- 1.1. Application Management
- 1.2. Device Management
- 1.3. Network Management
-
2. Device
- 2.1. Mobility Devices
- 2.2. Enterprise Computing
-
3. Service
- 3.1. Managed
- 3.2. Professional
-
4. Deployment Model
- 4.1. Public Cloud
- 4.2. Private Cloud
- 4.3. Hybrid Cloud
-
5. End-user Industry
- 5.1. Government and Defense
- 5.2. BFSI
- 5.3. Healthcare
- 5.4. IT & Telecom
- 5.5. Media & Entertainment
- 5.6. Manufacturing
- 5.7. Other End-user Industries
VaaS Market Segmentation By Geography
- 1. North America
- 2. Europe
- 3. Asia
- 4. Latin America
- 5. Middle East and Africa
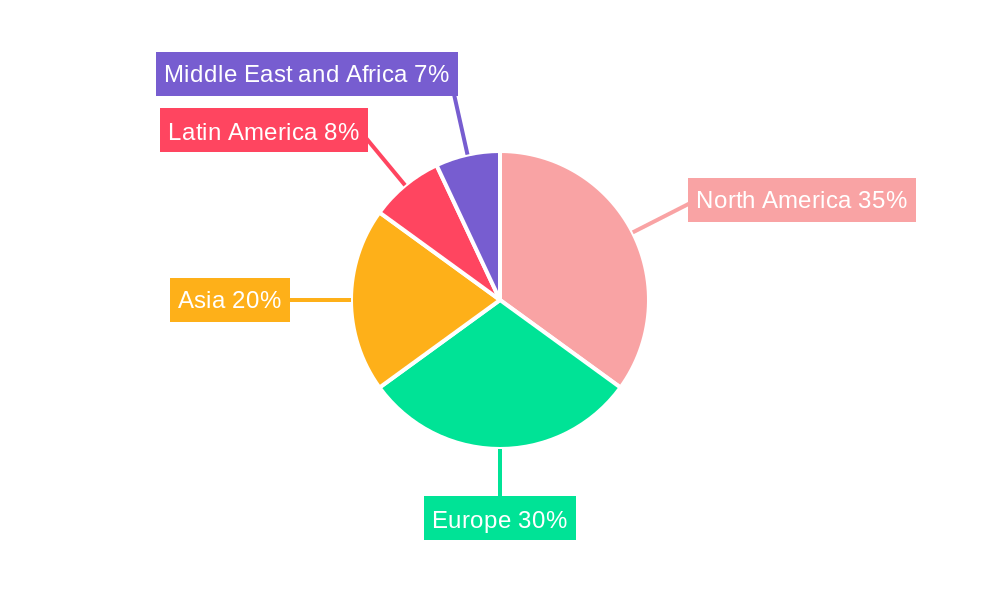
VaaS Market Regional Market Share
Geographic Coverage of VaaS Market
VaaS Market REPORT HIGHLIGHTS
| Aspects | Details |
|---|---|
| Study Period | 2020-2034 |
| Base Year | 2025 |
| Estimated Year | 2026 |
| Forecast Period | 2026-2034 |
| Historical Period | 2020-2025 |
| Growth Rate | CAGR of 14.80% from 2020-2034 |
| Segmentation |
|
Table of Contents
- 1. Introduction
- 1.1. Research Scope
- 1.2. Market Segmentation
- 1.3. Research Objective
- 1.4. Definitions and Assumptions
- 2. Executive Summary
- 2.1. Market Snapshot
- 3. Market Dynamics
- 3.1. Market Drivers
- 3.2. Market Restrains
- 3.3. Market Trends
- 3.4. Market Opportunities
- 4. Market Factor Analysis
- 4.1. Porters Five Forces
- 4.1.1. Bargaining Power of Suppliers
- 4.1.2. Bargaining Power of Buyers
- 4.1.3. Threat of New Entrants
- 4.1.4. Threat of Substitutes
- 4.1.5. Competitive Rivalry
- 4.2. PESTEL analysis
- 4.3. BCG Analysis
- 4.3.1. Stars (High Growth, High Market Share)
- 4.3.2. Cash Cows (Low Growth, High Market Share)
- 4.3.3. Question Mark (High Growth, Low Market Share)
- 4.3.4. Dogs (Low Growth, Low Market Share)
- 4.4. Ansoff Matrix Analysis
- 4.5. Supply Chain Analysis
- 4.6. Regulatory Landscape
- 4.7. Current Market Potential and Opportunity Assessment (TAM–SAM–SOM Framework)
- 4.8. DMV Analyst Note
- 4.1. Porters Five Forces
- 5. Market Analysis, Insights and Forecast 2021-2033
- 5.1. Market Analysis, Insights and Forecast - by Platform
- 5.1.1. Application Management
- 5.1.2. Device Management
- 5.1.3. Network Management
- 5.2. Market Analysis, Insights and Forecast - by Device
- 5.2.1. Mobility Devices
- 5.2.2. Enterprise Computing
- 5.3. Market Analysis, Insights and Forecast - by Service
- 5.3.1. Managed
- 5.3.2. Professional
- 5.4. Market Analysis, Insights and Forecast - by Deployment Model
- 5.4.1. Public Cloud
- 5.4.2. Private Cloud
- 5.4.3. Hybrid Cloud
- 5.5. Market Analysis, Insights and Forecast - by End-user Industry
- 5.5.1. Government and Defense
- 5.5.2. BFSI
- 5.5.3. Healthcare
- 5.5.4. IT & Telecom
- 5.5.5. Media & Entertainment
- 5.5.6. Manufacturing
- 5.5.7. Other End-user Industries
- 5.6. Market Analysis, Insights and Forecast - by Region
- 5.6.1. North America
- 5.6.2. Europe
- 5.6.3. Asia
- 5.6.4. Latin America
- 5.6.5. Middle East and Africa
- 5.1. Market Analysis, Insights and Forecast - by Platform
- 6. Global VaaS Market Analysis, Insights and Forecast, 2021-2033
- 6.1. Market Analysis, Insights and Forecast - by Platform
- 6.1.1. Application Management
- 6.1.2. Device Management
- 6.1.3. Network Management
- 6.2. Market Analysis, Insights and Forecast - by Device
- 6.2.1. Mobility Devices
- 6.2.2. Enterprise Computing
- 6.3. Market Analysis, Insights and Forecast - by Service
- 6.3.1. Managed
- 6.3.2. Professional
- 6.4. Market Analysis, Insights and Forecast - by Deployment Model
- 6.4.1. Public Cloud
- 6.4.2. Private Cloud
- 6.4.3. Hybrid Cloud
- 6.5. Market Analysis, Insights and Forecast - by End-user Industry
- 6.5.1. Government and Defense
- 6.5.2. BFSI
- 6.5.3. Healthcare
- 6.5.4. IT & Telecom
- 6.5.5. Media & Entertainment
- 6.5.6. Manufacturing
- 6.5.7. Other End-user Industries
- 6.1. Market Analysis, Insights and Forecast - by Platform
- 7. North America VaaS Market Analysis, Insights and Forecast, 2020-2032
- 7.1. Market Analysis, Insights and Forecast - by Platform
- 7.1.1. Application Management
- 7.1.2. Device Management
- 7.1.3. Network Management
- 7.2. Market Analysis, Insights and Forecast - by Device
- 7.2.1. Mobility Devices
- 7.2.2. Enterprise Computing
- 7.3. Market Analysis, Insights and Forecast - by Service
- 7.3.1. Managed
- 7.3.2. Professional
- 7.4. Market Analysis, Insights and Forecast - by Deployment Model
- 7.4.1. Public Cloud
- 7.4.2. Private Cloud
- 7.4.3. Hybrid Cloud
- 7.5. Market Analysis, Insights and Forecast - by End-user Industry
- 7.5.1. Government and Defense
- 7.5.2. BFSI
- 7.5.3. Healthcare
- 7.5.4. IT & Telecom
- 7.5.5. Media & Entertainment
- 7.5.6. Manufacturing
- 7.5.7. Other End-user Industries
- 7.1. Market Analysis, Insights and Forecast - by Platform
- 8. Europe VaaS Market Analysis, Insights and Forecast, 2020-2032
- 8.1. Market Analysis, Insights and Forecast - by Platform
- 8.1.1. Application Management
- 8.1.2. Device Management
- 8.1.3. Network Management
- 8.2. Market Analysis, Insights and Forecast - by Device
- 8.2.1. Mobility Devices
- 8.2.2. Enterprise Computing
- 8.3. Market Analysis, Insights and Forecast - by Service
- 8.3.1. Managed
- 8.3.2. Professional
- 8.4. Market Analysis, Insights and Forecast - by Deployment Model
- 8.4.1. Public Cloud
- 8.4.2. Private Cloud
- 8.4.3. Hybrid Cloud
- 8.5. Market Analysis, Insights and Forecast - by End-user Industry
- 8.5.1. Government and Defense
- 8.5.2. BFSI
- 8.5.3. Healthcare
- 8.5.4. IT & Telecom
- 8.5.5. Media & Entertainment
- 8.5.6. Manufacturing
- 8.5.7. Other End-user Industries
- 8.1. Market Analysis, Insights and Forecast - by Platform
- 9. Asia VaaS Market Analysis, Insights and Forecast, 2020-2032
- 9.1. Market Analysis, Insights and Forecast - by Platform
- 9.1.1. Application Management
- 9.1.2. Device Management
- 9.1.3. Network Management
- 9.2. Market Analysis, Insights and Forecast - by Device
- 9.2.1. Mobility Devices
- 9.2.2. Enterprise Computing
- 9.3. Market Analysis, Insights and Forecast - by Service
- 9.3.1. Managed
- 9.3.2. Professional
- 9.4. Market Analysis, Insights and Forecast - by Deployment Model
- 9.4.1. Public Cloud
- 9.4.2. Private Cloud
- 9.4.3. Hybrid Cloud
- 9.5. Market Analysis, Insights and Forecast - by End-user Industry
- 9.5.1. Government and Defense
- 9.5.2. BFSI
- 9.5.3. Healthcare
- 9.5.4. IT & Telecom
- 9.5.5. Media & Entertainment
- 9.5.6. Manufacturing
- 9.5.7. Other End-user Industries
- 9.1. Market Analysis, Insights and Forecast - by Platform
- 10. Latin America VaaS Market Analysis, Insights and Forecast, 2020-2032
- 10.1. Market Analysis, Insights and Forecast - by Platform
- 10.1.1. Application Management
- 10.1.2. Device Management
- 10.1.3. Network Management
- 10.2. Market Analysis, Insights and Forecast - by Device
- 10.2.1. Mobility Devices
- 10.2.2. Enterprise Computing
- 10.3. Market Analysis, Insights and Forecast - by Service
- 10.3.1. Managed
- 10.3.2. Professional
- 10.4. Market Analysis, Insights and Forecast - by Deployment Model
- 10.4.1. Public Cloud
- 10.4.2. Private Cloud
- 10.4.3. Hybrid Cloud
- 10.5. Market Analysis, Insights and Forecast - by End-user Industry
- 10.5.1. Government and Defense
- 10.5.2. BFSI
- 10.5.3. Healthcare
- 10.5.4. IT & Telecom
- 10.5.5. Media & Entertainment
- 10.5.6. Manufacturing
- 10.5.7. Other End-user Industries
- 10.1. Market Analysis, Insights and Forecast - by Platform
- 11. Middle East and Africa VaaS Market Analysis, Insights and Forecast, 2020-2032
- 11.1. Market Analysis, Insights and Forecast - by Platform
- 11.1.1. Application Management
- 11.1.2. Device Management
- 11.1.3. Network Management
- 11.2. Market Analysis, Insights and Forecast - by Device
- 11.2.1. Mobility Devices
- 11.2.2. Enterprise Computing
- 11.3. Market Analysis, Insights and Forecast - by Service
- 11.3.1. Managed
- 11.3.2. Professional
- 11.4. Market Analysis, Insights and Forecast - by Deployment Model
- 11.4.1. Public Cloud
- 11.4.2. Private Cloud
- 11.4.3. Hybrid Cloud
- 11.5. Market Analysis, Insights and Forecast - by End-user Industry
- 11.5.1. Government and Defense
- 11.5.2. BFSI
- 11.5.3. Healthcare
- 11.5.4. IT & Telecom
- 11.5.5. Media & Entertainment
- 11.5.6. Manufacturing
- 11.5.7. Other End-user Industries
- 11.1. Market Analysis, Insights and Forecast - by Platform
- 12. Competitive Analysis
- 12.1. Company Profiles
- 12.1.1 Interoute Communications Limited
- 12.1.1.1. Company Overview
- 12.1.1.2. Products
- 12.1.1.3. Company Financials
- 12.1.1.4. SWOT Analysis
- 12.1.2 Applied Global Technologies LLC
- 12.1.2.1. Company Overview
- 12.1.2.2. Products
- 12.1.2.3. Company Financials
- 12.1.2.4. SWOT Analysis
- 12.1.3 AVI-SPL Inc
- 12.1.3.1. Company Overview
- 12.1.3.2. Products
- 12.1.3.3. Company Financials
- 12.1.3.4. SWOT Analysis
- 12.1.4 Polycom Inc
- 12.1.4.1. Company Overview
- 12.1.4.2. Products
- 12.1.4.3. Company Financials
- 12.1.4.4. SWOT Analysis
- 12.1.5 Adobe Systems
- 12.1.5.1. Company Overview
- 12.1.5.2. Products
- 12.1.5.3. Company Financials
- 12.1.5.4. SWOT Analysis
- 12.1.6 Cisco Systems Inc
- 12.1.6.1. Company Overview
- 12.1.6.2. Products
- 12.1.6.3. Company Financials
- 12.1.6.4. SWOT Analysis
- 12.1.7 Avaya Inc
- 12.1.7.1. Company Overview
- 12.1.7.2. Products
- 12.1.7.3. Company Financials
- 12.1.7.4. SWOT Analysis
- 12.1.8 BlueJeans Network
- 12.1.8.1. Company Overview
- 12.1.8.2. Products
- 12.1.8.3. Company Financials
- 12.1.8.4. SWOT Analysis
- 12.1.9 Huawei Technologies Co Limited
- 12.1.9.1. Company Overview
- 12.1.9.2. Products
- 12.1.9.3. Company Financials
- 12.1.9.4. SWOT Analysis
- 12.1.10 Vidyo Inc
- 12.1.10.1. Company Overview
- 12.1.10.2. Products
- 12.1.10.3. Company Financials
- 12.1.10.4. SWOT Analysis
- 12.1.1 Interoute Communications Limited
- 12.2. Market Entropy
- 12.2.1 Company's Key Areas Served
- 12.2.2 Recent Developments
- 12.3. Company Market Share Analysis 2025
- 12.3.1 Top 5 Companies Market Share Analysis
- 12.3.2 Top 3 Companies Market Share Analysis
- 12.4. List of Potential Customers
- 13. Research Methodology
List of Figures
- Figure 1: Global VaaS Market Revenue Breakdown (Million, %) by Region 2025 & 2033
- Figure 2: North America VaaS Market Revenue (Million), by Platform 2025 & 2033
- Figure 3: North America VaaS Market Revenue Share (%), by Platform 2025 & 2033
- Figure 4: North America VaaS Market Revenue (Million), by Device 2025 & 2033
- Figure 5: North America VaaS Market Revenue Share (%), by Device 2025 & 2033
- Figure 6: North America VaaS Market Revenue (Million), by Service 2025 & 2033
- Figure 7: North America VaaS Market Revenue Share (%), by Service 2025 & 2033
- Figure 8: North America VaaS Market Revenue (Million), by Deployment Model 2025 & 2033
- Figure 9: North America VaaS Market Revenue Share (%), by Deployment Model 2025 & 2033
- Figure 10: North America VaaS Market Revenue (Million), by End-user Industry 2025 & 2033
- Figure 11: North America VaaS Market Revenue Share (%), by End-user Industry 2025 & 2033
- Figure 12: North America VaaS Market Revenue (Million), by Country 2025 & 2033
- Figure 13: North America VaaS Market Revenue Share (%), by Country 2025 & 2033
- Figure 14: Europe VaaS Market Revenue (Million), by Platform 2025 & 2033
- Figure 15: Europe VaaS Market Revenue Share (%), by Platform 2025 & 2033
- Figure 16: Europe VaaS Market Revenue (Million), by Device 2025 & 2033
- Figure 17: Europe VaaS Market Revenue Share (%), by Device 2025 & 2033
- Figure 18: Europe VaaS Market Revenue (Million), by Service 2025 & 2033
- Figure 19: Europe VaaS Market Revenue Share (%), by Service 2025 & 2033
- Figure 20: Europe VaaS Market Revenue (Million), by Deployment Model 2025 & 2033
- Figure 21: Europe VaaS Market Revenue Share (%), by Deployment Model 2025 & 2033
- Figure 22: Europe VaaS Market Revenue (Million), by End-user Industry 2025 & 2033
- Figure 23: Europe VaaS Market Revenue Share (%), by End-user Industry 2025 & 2033
- Figure 24: Europe VaaS Market Revenue (Million), by Country 2025 & 2033
- Figure 25: Europe VaaS Market Revenue Share (%), by Country 2025 & 2033
- Figure 26: Asia VaaS Market Revenue (Million), by Platform 2025 & 2033
- Figure 27: Asia VaaS Market Revenue Share (%), by Platform 2025 & 2033
- Figure 28: Asia VaaS Market Revenue (Million), by Device 2025 & 2033
- Figure 29: Asia VaaS Market Revenue Share (%), by Device 2025 & 2033
- Figure 30: Asia VaaS Market Revenue (Million), by Service 2025 & 2033
- Figure 31: Asia VaaS Market Revenue Share (%), by Service 2025 & 2033
- Figure 32: Asia VaaS Market Revenue (Million), by Deployment Model 2025 & 2033
- Figure 33: Asia VaaS Market Revenue Share (%), by Deployment Model 2025 & 2033
- Figure 34: Asia VaaS Market Revenue (Million), by End-user Industry 2025 & 2033
- Figure 35: Asia VaaS Market Revenue Share (%), by End-user Industry 2025 & 2033
- Figure 36: Asia VaaS Market Revenue (Million), by Country 2025 & 2033
- Figure 37: Asia VaaS Market Revenue Share (%), by Country 2025 & 2033
- Figure 38: Latin America VaaS Market Revenue (Million), by Platform 2025 & 2033
- Figure 39: Latin America VaaS Market Revenue Share (%), by Platform 2025 & 2033
- Figure 40: Latin America VaaS Market Revenue (Million), by Device 2025 & 2033
- Figure 41: Latin America VaaS Market Revenue Share (%), by Device 2025 & 2033
- Figure 42: Latin America VaaS Market Revenue (Million), by Service 2025 & 2033
- Figure 43: Latin America VaaS Market Revenue Share (%), by Service 2025 & 2033
- Figure 44: Latin America VaaS Market Revenue (Million), by Deployment Model 2025 & 2033
- Figure 45: Latin America VaaS Market Revenue Share (%), by Deployment Model 2025 & 2033
- Figure 46: Latin America VaaS Market Revenue (Million), by End-user Industry 2025 & 2033
- Figure 47: Latin America VaaS Market Revenue Share (%), by End-user Industry 2025 & 2033
- Figure 48: Latin America VaaS Market Revenue (Million), by Country 2025 & 2033
- Figure 49: Latin America VaaS Market Revenue Share (%), by Country 2025 & 2033
- Figure 50: Middle East and Africa VaaS Market Revenue (Million), by Platform 2025 & 2033
- Figure 51: Middle East and Africa VaaS Market Revenue Share (%), by Platform 2025 & 2033
- Figure 52: Middle East and Africa VaaS Market Revenue (Million), by Device 2025 & 2033
- Figure 53: Middle East and Africa VaaS Market Revenue Share (%), by Device 2025 & 2033
- Figure 54: Middle East and Africa VaaS Market Revenue (Million), by Service 2025 & 2033
- Figure 55: Middle East and Africa VaaS Market Revenue Share (%), by Service 2025 & 2033
- Figure 56: Middle East and Africa VaaS Market Revenue (Million), by Deployment Model 2025 & 2033
- Figure 57: Middle East and Africa VaaS Market Revenue Share (%), by Deployment Model 2025 & 2033
- Figure 58: Middle East and Africa VaaS Market Revenue (Million), by End-user Industry 2025 & 2033
- Figure 59: Middle East and Africa VaaS Market Revenue Share (%), by End-user Industry 2025 & 2033
- Figure 60: Middle East and Africa VaaS Market Revenue (Million), by Country 2025 & 2033
- Figure 61: Middle East and Africa VaaS Market Revenue Share (%), by Country 2025 & 2033
List of Tables
- Table 1: Global VaaS Market Revenue Million Forecast, by Platform 2020 & 2033
- Table 2: Global VaaS Market Revenue Million Forecast, by Device 2020 & 2033
- Table 3: Global VaaS Market Revenue Million Forecast, by Service 2020 & 2033
- Table 4: Global VaaS Market Revenue Million Forecast, by Deployment Model 2020 & 2033
- Table 5: Global VaaS Market Revenue Million Forecast, by End-user Industry 2020 & 2033
- Table 6: Global VaaS Market Revenue Million Forecast, by Region 2020 & 2033
- Table 7: Global VaaS Market Revenue Million Forecast, by Platform 2020 & 2033
- Table 8: Global VaaS Market Revenue Million Forecast, by Device 2020 & 2033
- Table 9: Global VaaS Market Revenue Million Forecast, by Service 2020 & 2033
- Table 10: Global VaaS Market Revenue Million Forecast, by Deployment Model 2020 & 2033
- Table 11: Global VaaS Market Revenue Million Forecast, by End-user Industry 2020 & 2033
- Table 12: Global VaaS Market Revenue Million Forecast, by Country 2020 & 2033
- Table 13: Global VaaS Market Revenue Million Forecast, by Platform 2020 & 2033
- Table 14: Global VaaS Market Revenue Million Forecast, by Device 2020 & 2033
- Table 15: Global VaaS Market Revenue Million Forecast, by Service 2020 & 2033
- Table 16: Global VaaS Market Revenue Million Forecast, by Deployment Model 2020 & 2033
- Table 17: Global VaaS Market Revenue Million Forecast, by End-user Industry 2020 & 2033
- Table 18: Global VaaS Market Revenue Million Forecast, by Country 2020 & 2033
- Table 19: Global VaaS Market Revenue Million Forecast, by Platform 2020 & 2033
- Table 20: Global VaaS Market Revenue Million Forecast, by Device 2020 & 2033
- Table 21: Global VaaS Market Revenue Million Forecast, by Service 2020 & 2033
- Table 22: Global VaaS Market Revenue Million Forecast, by Deployment Model 2020 & 2033
- Table 23: Global VaaS Market Revenue Million Forecast, by End-user Industry 2020 & 2033
- Table 24: Global VaaS Market Revenue Million Forecast, by Country 2020 & 2033
- Table 25: Global VaaS Market Revenue Million Forecast, by Platform 2020 & 2033
- Table 26: Global VaaS Market Revenue Million Forecast, by Device 2020 & 2033
- Table 27: Global VaaS Market Revenue Million Forecast, by Service 2020 & 2033
- Table 28: Global VaaS Market Revenue Million Forecast, by Deployment Model 2020 & 2033
- Table 29: Global VaaS Market Revenue Million Forecast, by End-user Industry 2020 & 2033
- Table 30: Global VaaS Market Revenue Million Forecast, by Country 2020 & 2033
- Table 31: Global VaaS Market Revenue Million Forecast, by Platform 2020 & 2033
- Table 32: Global VaaS Market Revenue Million Forecast, by Device 2020 & 2033
- Table 33: Global VaaS Market Revenue Million Forecast, by Service 2020 & 2033
- Table 34: Global VaaS Market Revenue Million Forecast, by Deployment Model 2020 & 2033
- Table 35: Global VaaS Market Revenue Million Forecast, by End-user Industry 2020 & 2033
- Table 36: Global VaaS Market Revenue Million Forecast, by Country 2020 & 2033
Frequently Asked Questions
1. What is the projected Compound Annual Growth Rate (CAGR) of the VaaS Market?
The projected CAGR is approximately 14.80%.
2. Which companies are prominent players in the VaaS Market?
Key companies in the market include Interoute Communications Limited, Applied Global Technologies LLC, AVI-SPL Inc , Polycom Inc, Adobe Systems, Cisco Systems Inc, Avaya Inc, BlueJeans Network, Huawei Technologies Co Limited, Vidyo Inc.
3. What are the main segments of the VaaS Market?
The market segments include Platform, Device, Service, Deployment Model, End-user Industry.
4. Can you provide details about the market size?
The market size is estimated to be USD 6.62 Million as of 2022.
5. What are some drivers contributing to market growth?
Increasing Investment on Cloud-Based Video Services; Enabling Digital Workforce.
6. What are the notable trends driving market growth?
The Hybrid Cloud Segment is Anticipated to Drive the Market Demand.
7. Are there any restraints impacting market growth?
High Cost of Video Content Creation and Validity.
8. Can you provide examples of recent developments in the market?
November 2022: Tesla announced that a Tesla driver could use the Zoom app to make or receive video conversations in the vehicle. The Zoom call app would be directly accessed on Tesla's central touchscreen infotainment system. The software utilizes the in-car camera mounted on the rearview mirror.
9. What pricing options are available for accessing the report?
Pricing options include single-user, multi-user, and enterprise licenses priced at USD 4750, USD 5250, and USD 8750 respectively.
10. Is the market size provided in terms of value or volume?
The market size is provided in terms of value, measured in Million.
11. Are there any specific market keywords associated with the report?
Yes, the market keyword associated with the report is "VaaS Market," which aids in identifying and referencing the specific market segment covered.
12. How do I determine which pricing option suits my needs best?
The pricing options vary based on user requirements and access needs. Individual users may opt for single-user licenses, while businesses requiring broader access may choose multi-user or enterprise licenses for cost-effective access to the report.
13. Are there any additional resources or data provided in the VaaS Market report?
While the report offers comprehensive insights, it's advisable to review the specific contents or supplementary materials provided to ascertain if additional resources or data are available.
14. How can I stay updated on further developments or reports in the VaaS Market?
To stay informed about further developments, trends, and reports in the VaaS Market, consider subscribing to industry newsletters, following relevant companies and organizations, or regularly checking reputable industry news sources and publications.
Methodology
Step 1 - Identification of Relevant Samples Size from Population Database


Step 2 - Approaches for Defining Global Market Size (Value, Volume* & Price*)

Note*: In applicable scenarios
Step 3 - Data Sources
Primary Research
- Web Analytics
- Survey Reports
- Research Institute
- Latest Research Reports
- Opinion Leaders
Secondary Research
- Annual Reports
- White Paper
- Latest Press Release
- Industry Association
- Paid Database
- Investor Presentations

Step 4 - Data Triangulation
Involves using different sources of information in order to increase the validity of a study
These sources are likely to be stakeholders in a program - participants, other researchers, program staff, other community members, and so on.
Then we put all data in single framework & apply various statistical tools to find out the dynamic on the market.
During the analysis stage, feedback from the stakeholder groups would be compared to determine areas of agreement as well as areas of divergence