

Key Insights
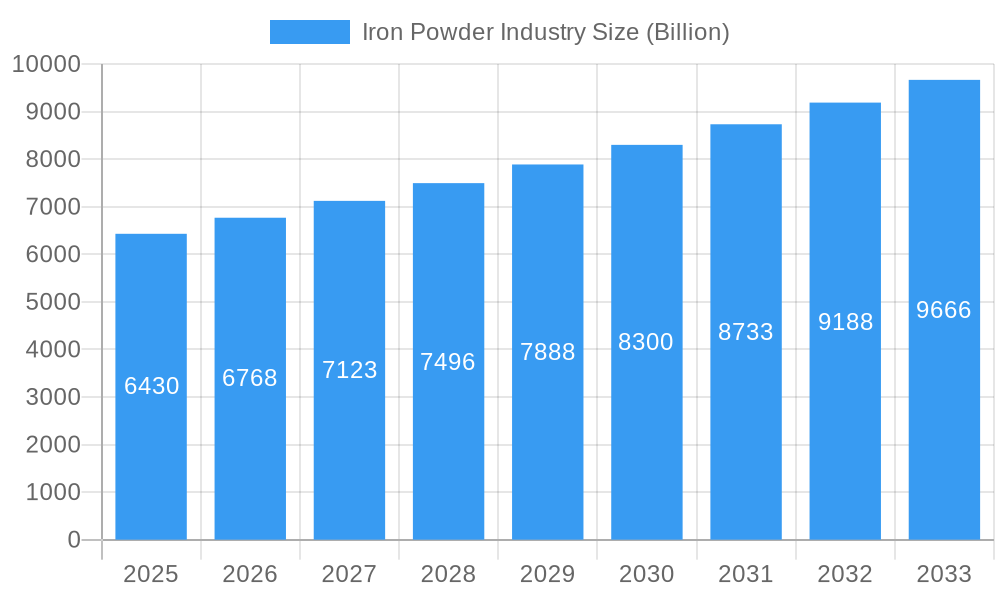
The global iron powder market, valued at $6.43 billion in 2025, is projected to experience robust growth, driven by a compound annual growth rate (CAGR) of 5.2% from 2025 to 2033. This expansion is fueled by the increasing demand from key end-use sectors, particularly the automotive industry's burgeoning adoption of powder metallurgy for producing lightweight and high-strength components. The chemical industry also contributes significantly, utilizing iron powder in various catalytic and pigment applications. Further growth is propelled by advancements in iron powder production technologies, leading to improved particle size control, enhanced purity, and reduced costs. The rise of additive manufacturing (3D printing) further boosts market demand, as it utilizes iron powder as a key material for intricate component creation. Growth is expected to be particularly strong in the Asia-Pacific region, driven by rapid industrialization and rising infrastructure development in countries like China and India. However, fluctuating raw material prices and potential environmental concerns related to iron powder production remain key restraints on market growth.
Iron Powder Industry Market Size (In Billion)
The market segmentation reveals a diverse landscape. Reduced iron powder maintains a dominant market share due to its cost-effectiveness and suitability for various applications. However, atomized and electrolytic iron powders are gaining traction due to their superior properties, catering to niche applications demanding higher purity and specific particle characteristics. Within the end-user segments, the automotive industry holds the largest share, followed by the chemical and general industrial sectors. The food industry utilizes iron powder as a nutritional supplement, showcasing the versatility of this material. Competitive dynamics are shaped by a mix of established players like Hoganas AB, Kobe Steel Ltd, and ATI, alongside regional players and emerging companies focusing on specialized iron powder types and advanced production methods. The strategic partnerships and technological advancements within the industry are expected to further shape market trends in the coming years. Continued innovation in powder metallurgy and the adoption of sustainable manufacturing practices will be crucial for long-term market success.
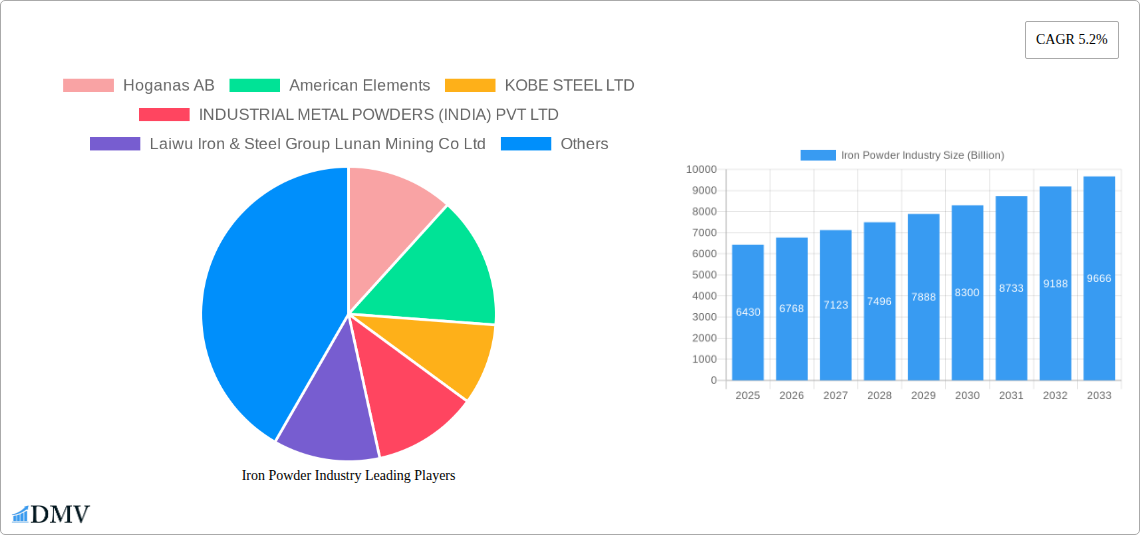
Iron Powder Industry Company Market Share
Iron Powder Industry: A Comprehensive Market Report (2019-2033)
This insightful report provides a comprehensive analysis of the global iron powder industry, projecting a market valuation exceeding $XX Billion by 2033. It meticulously examines market dynamics, competitive landscapes, technological advancements, and future growth prospects, offering crucial insights for stakeholders across the value chain. The study covers the historical period (2019-2024), base year (2025), and forecast period (2025-2033), offering a robust understanding of past performance and future trajectories. Key players like Hoganas AB, American Elements, and Kobe Steel Ltd., are analyzed, alongside emerging trends and potential disruptions.
Iron Powder Industry Market Composition & Trends
The global iron powder market, valued at $XX Billion in 2025, is characterized by a moderately concentrated landscape. While a few major players hold significant market share, several regional and specialized producers contribute to the overall market dynamics. The market share distribution is as follows: Hoganas AB (XX%), Kobe Steel Ltd. (XX%), American Elements (XX%), and others (XX%). This concentration is further influenced by factors such as economies of scale and technological capabilities.
Innovation is a significant catalyst, with ongoing developments in powder metallurgy techniques, including advancements in atomization and reduction processes. Stringent environmental regulations, particularly concerning emissions and waste management, are shaping industry practices. Substitute materials like stainless steel and aluminum powders present competitive pressures. The automotive industry remains a dominant end-user, followed by chemical and general industrial applications. Significant M&A activity has been witnessed, with deal values totaling approximately $XX Billion over the past five years. These activities reflect a consolidation trend within the industry, driven by the desire for enhanced market reach and technological capabilities.
- Market Concentration: Moderately concentrated, with a few dominant players.
- Innovation Catalysts: Advancements in powder metallurgy techniques.
- Regulatory Landscape: Stringent environmental regulations.
- Substitute Products: Stainless steel and aluminum powders.
- End-User Profiles: Automotive (dominant), chemical, general industrial, food, and others.
- M&A Activity: Significant consolidation observed, with total deal value exceeding $XX Billion in the last five years.
Iron Powder Industry Industry Evolution
The iron powder industry has witnessed steady growth over the past decade, driven by increasing demand from various end-use sectors, primarily the automotive industry's growth in electric vehicles and the increasing use of iron powder in additive manufacturing. Technological advancements, including the development of novel powder production methods and improved characterization techniques, have enhanced product quality and performance. The adoption of atomized iron powder, offering superior properties over reduced iron powder in certain applications, is steadily increasing at a compound annual growth rate (CAGR) of XX% during the forecast period. This growth reflects a shift towards high-performance materials across diverse applications. Shifting consumer demands for lightweight and high-strength materials are further bolstering industry growth. The market is anticipated to experience a CAGR of XX% from 2025 to 2033, reaching a projected value of $XX Billion. The growing adoption of sustainable and environmentally friendly production methods are creating new opportunities for industry players.
Leading Regions, Countries, or Segments in Iron Powder Industry
The automotive sector is the leading end-user segment globally, driving substantial demand for iron powder. Asia-Pacific region is a leading market, particularly China, due to its robust automotive manufacturing base. Reduced iron powder constitutes the largest type segment, owing to its cost-effectiveness and wide range of applications.
- Key Drivers in Asia-Pacific: Rapid industrialization, expanding automotive sector, supportive government policies.
- Dominance Factors for Reduced Iron Powder: Cost-effectiveness and suitability for diverse applications.
- Growth Potential for Atomized Iron Powder: Superior properties for specific high-performance applications.
- Emerging Markets for Electrolytic Iron Powder: Niche applications requiring high purity and specific properties.
Iron Powder Industry Product Innovations
Recent innovations focus on enhancing powder properties, such as improved flowability, higher density, and tailored particle size distributions. This results in improved component performance and reduced production costs. The development of nickel-free powders, as exemplified by Höganäs' recent development, addresses environmental concerns and offers cost advantages. These advancements are expanding the range of applications and reinforcing the iron powder's competitive advantage in various industries.
Propelling Factors for Iron Powder Industry Growth
Technological advancements in powder production and processing techniques are a primary driver. Expanding automotive sector, particularly electric vehicles, is significantly boosting demand for high-quality iron powder. Favorable government regulations promoting sustainable manufacturing practices are further contributing to industry growth. The growing adoption of additive manufacturing techniques, which utilize iron powder extensively, represents a significant growth opportunity.
Obstacles in the Iron Powder Industry Market
Fluctuations in raw material prices, particularly iron ore, represent a significant challenge, impacting profitability. Supply chain disruptions, particularly those impacting logistics and transportation, can lead to production delays and increased costs. Intense competition from other metallic powders, like stainless steel and aluminum, necessitates continuous innovation and cost optimization strategies. Environmental regulations, while beneficial long-term, impose short-term compliance costs.
Future Opportunities in Iron Powder Industry
The increasing adoption of additive manufacturing and 3D printing technologies presents substantial growth opportunities. Development of specialized iron powders with enhanced properties for niche applications, such as aerospace and medical devices, offers significant market potential. Exploration of new markets, particularly in developing economies, holds considerable growth potential. Sustainable and environmentally friendly powder production methods will attract increased investments and market share.
Major Players in the Iron Powder Industry Ecosystem
- Hoganas AB
- American Elements
- KOBE STEEL LTD
- INDUSTRIAL METAL POWDERS (INDIA) PVT LTD
- Laiwu Iron & Steel Group Lunan Mining Co Ltd
- ATI
- Ashland
- Belmont Metals
- BASF SE
- Rio Tinto Metal Powders
- CNPC POWDER
- JFE Steel Corporation
- Pometon Powder
Key Developments in Iron Powder Industry Industry
- January 2023: JFE Steel completed the acquisition of the ISO 45001 certification for all its Japan operations, enhancing its occupational health and safety standards and potentially attracting more clients.
- January 2023: Höganäs developed nickel-free powders for component production, reducing costs and environmental impact, enhancing the competitiveness of its products and aligning with environmental sustainability goals.
Strategic Iron Powder Industry Market Forecast
The iron powder market is poised for robust growth, driven by technological advancements, expanding end-use sectors, and the increasing adoption of sustainable production practices. The forecast period promises significant expansion in key markets and adoption of advanced technologies. The market is expected to reach a value exceeding $XX Billion by 2033, fueled by continuous innovation and strategic partnerships across the value chain.
Iron Powder Industry Segmentation
-
1. Type
- 1.1. Reduced Iron Powder
- 1.2. Atomized Iron Powder
- 1.3. Electrolytic Iron Powder
-
2. End-User
- 2.1. Automotive
- 2.2. Chemical
- 2.3. General Industrial
- 2.4. Food
- 2.5. Other End-users
Iron Powder Industry Segmentation By Geography
-
1. Asia Pacific
- 1.1. China
- 1.2. India
- 1.3. Japan
- 1.4. South Korea
- 1.5. Rest of Asia Pacific
-
2. North America
- 2.1. United States
- 2.2. Canada
- 2.3. Mexico
-
3. Europe
- 3.1. United Kingdom
- 3.2. France
- 3.3. Germany
- 3.4. Italy
- 3.5. Rest of Europe
-
4. South America
- 4.1. Brazil
- 4.2. Argentina
- 4.3. Rest of South America
-
5. Middle East and Africa
- 5.1. Saudi Arabia
- 5.2. South Africa
- 5.3. Rest of Middle East and Africa
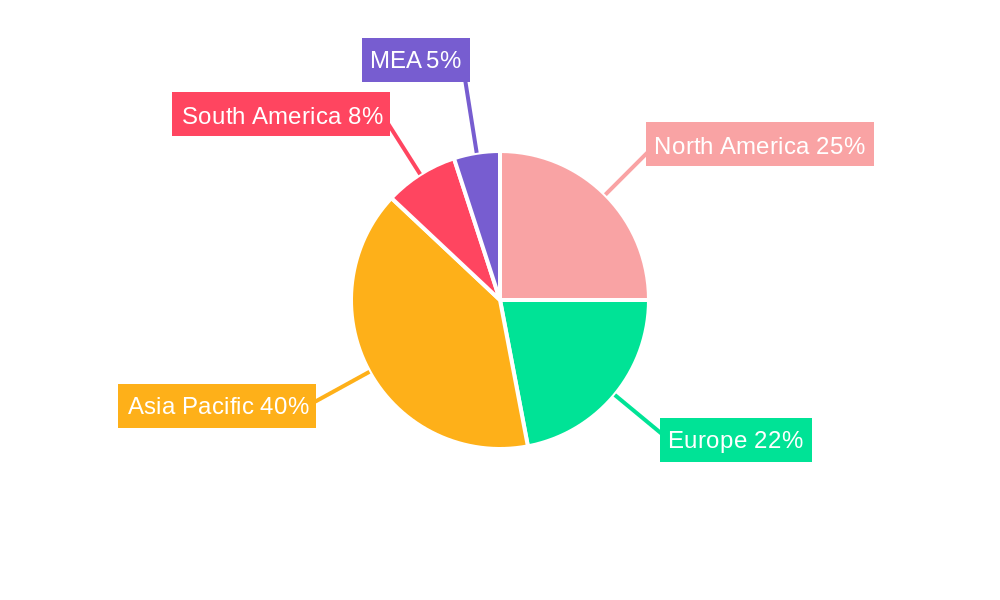
Iron Powder Industry Regional Market Share
Geographic Coverage of Iron Powder Industry
Iron Powder Industry REPORT HIGHLIGHTS
| Aspects | Details |
|---|---|
| Study Period | 2020-2034 |
| Base Year | 2025 |
| Estimated Year | 2026 |
| Forecast Period | 2026-2034 |
| Historical Period | 2020-2025 |
| Growth Rate | CAGR of 5.2% from 2020-2034 |
| Segmentation |
|
Table of Contents
- 1. Introduction
- 1.1. Research Scope
- 1.2. Market Segmentation
- 1.3. Research Methodology
- 1.4. Definitions and Assumptions
- 2. Executive Summary
- 2.1. Introduction
- 3. Market Dynamics
- 3.1. Introduction
- 3.2. Market Drivers
- 3.2.1. Increasing Demand for Iron Powders from the Automotive Industry; Other Drivers
- 3.3. Market Restrains
- 3.3.1. High Cost of Production; Other Restraints
- 3.4. Market Trends
- 3.4.1. High Demand from Automotive Segment
- 4. Market Factor Analysis
- 4.1. Porters Five Forces
- 4.2. Supply/Value Chain
- 4.3. PESTEL analysis
- 4.4. Market Entropy
- 4.5. Patent/Trademark Analysis
- 5. Global Iron Powder Industry Analysis, Insights and Forecast, 2020-2032
- 5.1. Market Analysis, Insights and Forecast - by Type
- 5.1.1. Reduced Iron Powder
- 5.1.2. Atomized Iron Powder
- 5.1.3. Electrolytic Iron Powder
- 5.2. Market Analysis, Insights and Forecast - by End-User
- 5.2.1. Automotive
- 5.2.2. Chemical
- 5.2.3. General Industrial
- 5.2.4. Food
- 5.2.5. Other End-users
- 5.3. Market Analysis, Insights and Forecast - by Region
- 5.3.1. Asia Pacific
- 5.3.2. North America
- 5.3.3. Europe
- 5.3.4. South America
- 5.3.5. Middle East and Africa
- 5.1. Market Analysis, Insights and Forecast - by Type
- 6. Asia Pacific Iron Powder Industry Analysis, Insights and Forecast, 2020-2032
- 6.1. Market Analysis, Insights and Forecast - by Type
- 6.1.1. Reduced Iron Powder
- 6.1.2. Atomized Iron Powder
- 6.1.3. Electrolytic Iron Powder
- 6.2. Market Analysis, Insights and Forecast - by End-User
- 6.2.1. Automotive
- 6.2.2. Chemical
- 6.2.3. General Industrial
- 6.2.4. Food
- 6.2.5. Other End-users
- 6.1. Market Analysis, Insights and Forecast - by Type
- 7. North America Iron Powder Industry Analysis, Insights and Forecast, 2020-2032
- 7.1. Market Analysis, Insights and Forecast - by Type
- 7.1.1. Reduced Iron Powder
- 7.1.2. Atomized Iron Powder
- 7.1.3. Electrolytic Iron Powder
- 7.2. Market Analysis, Insights and Forecast - by End-User
- 7.2.1. Automotive
- 7.2.2. Chemical
- 7.2.3. General Industrial
- 7.2.4. Food
- 7.2.5. Other End-users
- 7.1. Market Analysis, Insights and Forecast - by Type
- 8. Europe Iron Powder Industry Analysis, Insights and Forecast, 2020-2032
- 8.1. Market Analysis, Insights and Forecast - by Type
- 8.1.1. Reduced Iron Powder
- 8.1.2. Atomized Iron Powder
- 8.1.3. Electrolytic Iron Powder
- 8.2. Market Analysis, Insights and Forecast - by End-User
- 8.2.1. Automotive
- 8.2.2. Chemical
- 8.2.3. General Industrial
- 8.2.4. Food
- 8.2.5. Other End-users
- 8.1. Market Analysis, Insights and Forecast - by Type
- 9. South America Iron Powder Industry Analysis, Insights and Forecast, 2020-2032
- 9.1. Market Analysis, Insights and Forecast - by Type
- 9.1.1. Reduced Iron Powder
- 9.1.2. Atomized Iron Powder
- 9.1.3. Electrolytic Iron Powder
- 9.2. Market Analysis, Insights and Forecast - by End-User
- 9.2.1. Automotive
- 9.2.2. Chemical
- 9.2.3. General Industrial
- 9.2.4. Food
- 9.2.5. Other End-users
- 9.1. Market Analysis, Insights and Forecast - by Type
- 10. Middle East and Africa Iron Powder Industry Analysis, Insights and Forecast, 2020-2032
- 10.1. Market Analysis, Insights and Forecast - by Type
- 10.1.1. Reduced Iron Powder
- 10.1.2. Atomized Iron Powder
- 10.1.3. Electrolytic Iron Powder
- 10.2. Market Analysis, Insights and Forecast - by End-User
- 10.2.1. Automotive
- 10.2.2. Chemical
- 10.2.3. General Industrial
- 10.2.4. Food
- 10.2.5. Other End-users
- 10.1. Market Analysis, Insights and Forecast - by Type
- 11. Competitive Analysis
- 11.1. Global Market Share Analysis 2025
- 11.2. Company Profiles
- 11.2.1 Hoganas AB
- 11.2.1.1. Overview
- 11.2.1.2. Products
- 11.2.1.3. SWOT Analysis
- 11.2.1.4. Recent Developments
- 11.2.1.5. Financials (Based on Availability)
- 11.2.2 American Elements
- 11.2.2.1. Overview
- 11.2.2.2. Products
- 11.2.2.3. SWOT Analysis
- 11.2.2.4. Recent Developments
- 11.2.2.5. Financials (Based on Availability)
- 11.2.3 KOBE STEEL LTD
- 11.2.3.1. Overview
- 11.2.3.2. Products
- 11.2.3.3. SWOT Analysis
- 11.2.3.4. Recent Developments
- 11.2.3.5. Financials (Based on Availability)
- 11.2.4 INDUSTRIAL METAL POWDERS (INDIA) PVT LTD
- 11.2.4.1. Overview
- 11.2.4.2. Products
- 11.2.4.3. SWOT Analysis
- 11.2.4.4. Recent Developments
- 11.2.4.5. Financials (Based on Availability)
- 11.2.5 Laiwu Iron & Steel Group Lunan Mining Co Ltd
- 11.2.5.1. Overview
- 11.2.5.2. Products
- 11.2.5.3. SWOT Analysis
- 11.2.5.4. Recent Developments
- 11.2.5.5. Financials (Based on Availability)
- 11.2.6 ATI
- 11.2.6.1. Overview
- 11.2.6.2. Products
- 11.2.6.3. SWOT Analysis
- 11.2.6.4. Recent Developments
- 11.2.6.5. Financials (Based on Availability)
- 11.2.7 Ashland
- 11.2.7.1. Overview
- 11.2.7.2. Products
- 11.2.7.3. SWOT Analysis
- 11.2.7.4. Recent Developments
- 11.2.7.5. Financials (Based on Availability)
- 11.2.8 Belmont Metals
- 11.2.8.1. Overview
- 11.2.8.2. Products
- 11.2.8.3. SWOT Analysis
- 11.2.8.4. Recent Developments
- 11.2.8.5. Financials (Based on Availability)
- 11.2.9 BASF SE
- 11.2.9.1. Overview
- 11.2.9.2. Products
- 11.2.9.3. SWOT Analysis
- 11.2.9.4. Recent Developments
- 11.2.9.5. Financials (Based on Availability)
- 11.2.10 Rio Tinto Metal Powders
- 11.2.10.1. Overview
- 11.2.10.2. Products
- 11.2.10.3. SWOT Analysis
- 11.2.10.4. Recent Developments
- 11.2.10.5. Financials (Based on Availability)
- 11.2.11 CNPC POWDER
- 11.2.11.1. Overview
- 11.2.11.2. Products
- 11.2.11.3. SWOT Analysis
- 11.2.11.4. Recent Developments
- 11.2.11.5. Financials (Based on Availability)
- 11.2.12 JFE Steel Corporation
- 11.2.12.1. Overview
- 11.2.12.2. Products
- 11.2.12.3. SWOT Analysis
- 11.2.12.4. Recent Developments
- 11.2.12.5. Financials (Based on Availability)
- 11.2.13 Pometon Powder
- 11.2.13.1. Overview
- 11.2.13.2. Products
- 11.2.13.3. SWOT Analysis
- 11.2.13.4. Recent Developments
- 11.2.13.5. Financials (Based on Availability)
- 11.2.1 Hoganas AB
List of Figures
- Figure 1: Global Iron Powder Industry Revenue Breakdown (Billion, %) by Region 2025 & 2033
- Figure 2: Global Iron Powder Industry Volume Breakdown (K Tons, %) by Region 2025 & 2033
- Figure 3: Asia Pacific Iron Powder Industry Revenue (Billion), by Type 2025 & 2033
- Figure 4: Asia Pacific Iron Powder Industry Volume (K Tons), by Type 2025 & 2033
- Figure 5: Asia Pacific Iron Powder Industry Revenue Share (%), by Type 2025 & 2033
- Figure 6: Asia Pacific Iron Powder Industry Volume Share (%), by Type 2025 & 2033
- Figure 7: Asia Pacific Iron Powder Industry Revenue (Billion), by End-User 2025 & 2033
- Figure 8: Asia Pacific Iron Powder Industry Volume (K Tons), by End-User 2025 & 2033
- Figure 9: Asia Pacific Iron Powder Industry Revenue Share (%), by End-User 2025 & 2033
- Figure 10: Asia Pacific Iron Powder Industry Volume Share (%), by End-User 2025 & 2033
- Figure 11: Asia Pacific Iron Powder Industry Revenue (Billion), by Country 2025 & 2033
- Figure 12: Asia Pacific Iron Powder Industry Volume (K Tons), by Country 2025 & 2033
- Figure 13: Asia Pacific Iron Powder Industry Revenue Share (%), by Country 2025 & 2033
- Figure 14: Asia Pacific Iron Powder Industry Volume Share (%), by Country 2025 & 2033
- Figure 15: North America Iron Powder Industry Revenue (Billion), by Type 2025 & 2033
- Figure 16: North America Iron Powder Industry Volume (K Tons), by Type 2025 & 2033
- Figure 17: North America Iron Powder Industry Revenue Share (%), by Type 2025 & 2033
- Figure 18: North America Iron Powder Industry Volume Share (%), by Type 2025 & 2033
- Figure 19: North America Iron Powder Industry Revenue (Billion), by End-User 2025 & 2033
- Figure 20: North America Iron Powder Industry Volume (K Tons), by End-User 2025 & 2033
- Figure 21: North America Iron Powder Industry Revenue Share (%), by End-User 2025 & 2033
- Figure 22: North America Iron Powder Industry Volume Share (%), by End-User 2025 & 2033
- Figure 23: North America Iron Powder Industry Revenue (Billion), by Country 2025 & 2033
- Figure 24: North America Iron Powder Industry Volume (K Tons), by Country 2025 & 2033
- Figure 25: North America Iron Powder Industry Revenue Share (%), by Country 2025 & 2033
- Figure 26: North America Iron Powder Industry Volume Share (%), by Country 2025 & 2033
- Figure 27: Europe Iron Powder Industry Revenue (Billion), by Type 2025 & 2033
- Figure 28: Europe Iron Powder Industry Volume (K Tons), by Type 2025 & 2033
- Figure 29: Europe Iron Powder Industry Revenue Share (%), by Type 2025 & 2033
- Figure 30: Europe Iron Powder Industry Volume Share (%), by Type 2025 & 2033
- Figure 31: Europe Iron Powder Industry Revenue (Billion), by End-User 2025 & 2033
- Figure 32: Europe Iron Powder Industry Volume (K Tons), by End-User 2025 & 2033
- Figure 33: Europe Iron Powder Industry Revenue Share (%), by End-User 2025 & 2033
- Figure 34: Europe Iron Powder Industry Volume Share (%), by End-User 2025 & 2033
- Figure 35: Europe Iron Powder Industry Revenue (Billion), by Country 2025 & 2033
- Figure 36: Europe Iron Powder Industry Volume (K Tons), by Country 2025 & 2033
- Figure 37: Europe Iron Powder Industry Revenue Share (%), by Country 2025 & 2033
- Figure 38: Europe Iron Powder Industry Volume Share (%), by Country 2025 & 2033
- Figure 39: South America Iron Powder Industry Revenue (Billion), by Type 2025 & 2033
- Figure 40: South America Iron Powder Industry Volume (K Tons), by Type 2025 & 2033
- Figure 41: South America Iron Powder Industry Revenue Share (%), by Type 2025 & 2033
- Figure 42: South America Iron Powder Industry Volume Share (%), by Type 2025 & 2033
- Figure 43: South America Iron Powder Industry Revenue (Billion), by End-User 2025 & 2033
- Figure 44: South America Iron Powder Industry Volume (K Tons), by End-User 2025 & 2033
- Figure 45: South America Iron Powder Industry Revenue Share (%), by End-User 2025 & 2033
- Figure 46: South America Iron Powder Industry Volume Share (%), by End-User 2025 & 2033
- Figure 47: South America Iron Powder Industry Revenue (Billion), by Country 2025 & 2033
- Figure 48: South America Iron Powder Industry Volume (K Tons), by Country 2025 & 2033
- Figure 49: South America Iron Powder Industry Revenue Share (%), by Country 2025 & 2033
- Figure 50: South America Iron Powder Industry Volume Share (%), by Country 2025 & 2033
- Figure 51: Middle East and Africa Iron Powder Industry Revenue (Billion), by Type 2025 & 2033
- Figure 52: Middle East and Africa Iron Powder Industry Volume (K Tons), by Type 2025 & 2033
- Figure 53: Middle East and Africa Iron Powder Industry Revenue Share (%), by Type 2025 & 2033
- Figure 54: Middle East and Africa Iron Powder Industry Volume Share (%), by Type 2025 & 2033
- Figure 55: Middle East and Africa Iron Powder Industry Revenue (Billion), by End-User 2025 & 2033
- Figure 56: Middle East and Africa Iron Powder Industry Volume (K Tons), by End-User 2025 & 2033
- Figure 57: Middle East and Africa Iron Powder Industry Revenue Share (%), by End-User 2025 & 2033
- Figure 58: Middle East and Africa Iron Powder Industry Volume Share (%), by End-User 2025 & 2033
- Figure 59: Middle East and Africa Iron Powder Industry Revenue (Billion), by Country 2025 & 2033
- Figure 60: Middle East and Africa Iron Powder Industry Volume (K Tons), by Country 2025 & 2033
- Figure 61: Middle East and Africa Iron Powder Industry Revenue Share (%), by Country 2025 & 2033
- Figure 62: Middle East and Africa Iron Powder Industry Volume Share (%), by Country 2025 & 2033
List of Tables
- Table 1: Global Iron Powder Industry Revenue Billion Forecast, by Type 2020 & 2033
- Table 2: Global Iron Powder Industry Volume K Tons Forecast, by Type 2020 & 2033
- Table 3: Global Iron Powder Industry Revenue Billion Forecast, by End-User 2020 & 2033
- Table 4: Global Iron Powder Industry Volume K Tons Forecast, by End-User 2020 & 2033
- Table 5: Global Iron Powder Industry Revenue Billion Forecast, by Region 2020 & 2033
- Table 6: Global Iron Powder Industry Volume K Tons Forecast, by Region 2020 & 2033
- Table 7: Global Iron Powder Industry Revenue Billion Forecast, by Type 2020 & 2033
- Table 8: Global Iron Powder Industry Volume K Tons Forecast, by Type 2020 & 2033
- Table 9: Global Iron Powder Industry Revenue Billion Forecast, by End-User 2020 & 2033
- Table 10: Global Iron Powder Industry Volume K Tons Forecast, by End-User 2020 & 2033
- Table 11: Global Iron Powder Industry Revenue Billion Forecast, by Country 2020 & 2033
- Table 12: Global Iron Powder Industry Volume K Tons Forecast, by Country 2020 & 2033
- Table 13: China Iron Powder Industry Revenue (Billion) Forecast, by Application 2020 & 2033
- Table 14: China Iron Powder Industry Volume (K Tons) Forecast, by Application 2020 & 2033
- Table 15: India Iron Powder Industry Revenue (Billion) Forecast, by Application 2020 & 2033
- Table 16: India Iron Powder Industry Volume (K Tons) Forecast, by Application 2020 & 2033
- Table 17: Japan Iron Powder Industry Revenue (Billion) Forecast, by Application 2020 & 2033
- Table 18: Japan Iron Powder Industry Volume (K Tons) Forecast, by Application 2020 & 2033
- Table 19: South Korea Iron Powder Industry Revenue (Billion) Forecast, by Application 2020 & 2033
- Table 20: South Korea Iron Powder Industry Volume (K Tons) Forecast, by Application 2020 & 2033
- Table 21: Rest of Asia Pacific Iron Powder Industry Revenue (Billion) Forecast, by Application 2020 & 2033
- Table 22: Rest of Asia Pacific Iron Powder Industry Volume (K Tons) Forecast, by Application 2020 & 2033
- Table 23: Global Iron Powder Industry Revenue Billion Forecast, by Type 2020 & 2033
- Table 24: Global Iron Powder Industry Volume K Tons Forecast, by Type 2020 & 2033
- Table 25: Global Iron Powder Industry Revenue Billion Forecast, by End-User 2020 & 2033
- Table 26: Global Iron Powder Industry Volume K Tons Forecast, by End-User 2020 & 2033
- Table 27: Global Iron Powder Industry Revenue Billion Forecast, by Country 2020 & 2033
- Table 28: Global Iron Powder Industry Volume K Tons Forecast, by Country 2020 & 2033
- Table 29: United States Iron Powder Industry Revenue (Billion) Forecast, by Application 2020 & 2033
- Table 30: United States Iron Powder Industry Volume (K Tons) Forecast, by Application 2020 & 2033
- Table 31: Canada Iron Powder Industry Revenue (Billion) Forecast, by Application 2020 & 2033
- Table 32: Canada Iron Powder Industry Volume (K Tons) Forecast, by Application 2020 & 2033
- Table 33: Mexico Iron Powder Industry Revenue (Billion) Forecast, by Application 2020 & 2033
- Table 34: Mexico Iron Powder Industry Volume (K Tons) Forecast, by Application 2020 & 2033
- Table 35: Global Iron Powder Industry Revenue Billion Forecast, by Type 2020 & 2033
- Table 36: Global Iron Powder Industry Volume K Tons Forecast, by Type 2020 & 2033
- Table 37: Global Iron Powder Industry Revenue Billion Forecast, by End-User 2020 & 2033
- Table 38: Global Iron Powder Industry Volume K Tons Forecast, by End-User 2020 & 2033
- Table 39: Global Iron Powder Industry Revenue Billion Forecast, by Country 2020 & 2033
- Table 40: Global Iron Powder Industry Volume K Tons Forecast, by Country 2020 & 2033
- Table 41: United Kingdom Iron Powder Industry Revenue (Billion) Forecast, by Application 2020 & 2033
- Table 42: United Kingdom Iron Powder Industry Volume (K Tons) Forecast, by Application 2020 & 2033
- Table 43: France Iron Powder Industry Revenue (Billion) Forecast, by Application 2020 & 2033
- Table 44: France Iron Powder Industry Volume (K Tons) Forecast, by Application 2020 & 2033
- Table 45: Germany Iron Powder Industry Revenue (Billion) Forecast, by Application 2020 & 2033
- Table 46: Germany Iron Powder Industry Volume (K Tons) Forecast, by Application 2020 & 2033
- Table 47: Italy Iron Powder Industry Revenue (Billion) Forecast, by Application 2020 & 2033
- Table 48: Italy Iron Powder Industry Volume (K Tons) Forecast, by Application 2020 & 2033
- Table 49: Rest of Europe Iron Powder Industry Revenue (Billion) Forecast, by Application 2020 & 2033
- Table 50: Rest of Europe Iron Powder Industry Volume (K Tons) Forecast, by Application 2020 & 2033
- Table 51: Global Iron Powder Industry Revenue Billion Forecast, by Type 2020 & 2033
- Table 52: Global Iron Powder Industry Volume K Tons Forecast, by Type 2020 & 2033
- Table 53: Global Iron Powder Industry Revenue Billion Forecast, by End-User 2020 & 2033
- Table 54: Global Iron Powder Industry Volume K Tons Forecast, by End-User 2020 & 2033
- Table 55: Global Iron Powder Industry Revenue Billion Forecast, by Country 2020 & 2033
- Table 56: Global Iron Powder Industry Volume K Tons Forecast, by Country 2020 & 2033
- Table 57: Brazil Iron Powder Industry Revenue (Billion) Forecast, by Application 2020 & 2033
- Table 58: Brazil Iron Powder Industry Volume (K Tons) Forecast, by Application 2020 & 2033
- Table 59: Argentina Iron Powder Industry Revenue (Billion) Forecast, by Application 2020 & 2033
- Table 60: Argentina Iron Powder Industry Volume (K Tons) Forecast, by Application 2020 & 2033
- Table 61: Rest of South America Iron Powder Industry Revenue (Billion) Forecast, by Application 2020 & 2033
- Table 62: Rest of South America Iron Powder Industry Volume (K Tons) Forecast, by Application 2020 & 2033
- Table 63: Global Iron Powder Industry Revenue Billion Forecast, by Type 2020 & 2033
- Table 64: Global Iron Powder Industry Volume K Tons Forecast, by Type 2020 & 2033
- Table 65: Global Iron Powder Industry Revenue Billion Forecast, by End-User 2020 & 2033
- Table 66: Global Iron Powder Industry Volume K Tons Forecast, by End-User 2020 & 2033
- Table 67: Global Iron Powder Industry Revenue Billion Forecast, by Country 2020 & 2033
- Table 68: Global Iron Powder Industry Volume K Tons Forecast, by Country 2020 & 2033
- Table 69: Saudi Arabia Iron Powder Industry Revenue (Billion) Forecast, by Application 2020 & 2033
- Table 70: Saudi Arabia Iron Powder Industry Volume (K Tons) Forecast, by Application 2020 & 2033
- Table 71: South Africa Iron Powder Industry Revenue (Billion) Forecast, by Application 2020 & 2033
- Table 72: South Africa Iron Powder Industry Volume (K Tons) Forecast, by Application 2020 & 2033
- Table 73: Rest of Middle East and Africa Iron Powder Industry Revenue (Billion) Forecast, by Application 2020 & 2033
- Table 74: Rest of Middle East and Africa Iron Powder Industry Volume (K Tons) Forecast, by Application 2020 & 2033
Frequently Asked Questions
1. What is the projected Compound Annual Growth Rate (CAGR) of the Iron Powder Industry?
The projected CAGR is approximately 5.2%.
2. Which companies are prominent players in the Iron Powder Industry?
Key companies in the market include Hoganas AB, American Elements, KOBE STEEL LTD, INDUSTRIAL METAL POWDERS (INDIA) PVT LTD, Laiwu Iron & Steel Group Lunan Mining Co Ltd, ATI, Ashland, Belmont Metals, BASF SE, Rio Tinto Metal Powders, CNPC POWDER, JFE Steel Corporation, Pometon Powder.
3. What are the main segments of the Iron Powder Industry?
The market segments include Type, End-User.
4. Can you provide details about the market size?
The market size is estimated to be USD 6.43 Billion as of 2022.
5. What are some drivers contributing to market growth?
Increasing Demand for Iron Powders from the Automotive Industry; Other Drivers.
6. What are the notable trends driving market growth?
High Demand from Automotive Segment.
7. Are there any restraints impacting market growth?
High Cost of Production; Other Restraints.
8. Can you provide examples of recent developments in the market?
January 2023: JFE Steel completed the acquisition of the ISO 45001 certification, an international standard for occupational health and safety management systems, for all of its Japan operations.
9. What pricing options are available for accessing the report?
Pricing options include single-user, multi-user, and enterprise licenses priced at USD 4750, USD 5250, and USD 8750 respectively.
10. Is the market size provided in terms of value or volume?
The market size is provided in terms of value, measured in Billion and volume, measured in K Tons.
11. Are there any specific market keywords associated with the report?
Yes, the market keyword associated with the report is "Iron Powder Industry," which aids in identifying and referencing the specific market segment covered.
12. How do I determine which pricing option suits my needs best?
The pricing options vary based on user requirements and access needs. Individual users may opt for single-user licenses, while businesses requiring broader access may choose multi-user or enterprise licenses for cost-effective access to the report.
13. Are there any additional resources or data provided in the Iron Powder Industry report?
While the report offers comprehensive insights, it's advisable to review the specific contents or supplementary materials provided to ascertain if additional resources or data are available.
14. How can I stay updated on further developments or reports in the Iron Powder Industry?
To stay informed about further developments, trends, and reports in the Iron Powder Industry, consider subscribing to industry newsletters, following relevant companies and organizations, or regularly checking reputable industry news sources and publications.
Methodology
Step 1 - Identification of Relevant Samples Size from Population Database


Step 2 - Approaches for Defining Global Market Size (Value, Volume* & Price*)

Note*: In applicable scenarios
Step 3 - Data Sources
Primary Research
- Web Analytics
- Survey Reports
- Research Institute
- Latest Research Reports
- Opinion Leaders
Secondary Research
- Annual Reports
- White Paper
- Latest Press Release
- Industry Association
- Paid Database
- Investor Presentations

Step 4 - Data Triangulation
Involves using different sources of information in order to increase the validity of a study
These sources are likely to be stakeholders in a program - participants, other researchers, program staff, other community members, and so on.
Then we put all data in single framework & apply various statistical tools to find out the dynamic on the market.
During the analysis stage, feedback from the stakeholder groups would be compared to determine areas of agreement as well as areas of divergence