

Key Insights
The global Gum Rosin market is projected to reach a size of 2632.6 million by 2025, expanding at a Compound Annual Growth Rate (CAGR) of 4.4%. This growth is propelled by strong demand from the paper sizing industry, enhancing water resistance and printability. The expanding printing ink sector, driven by packaging and advertising, and the increasing use of gum rosin in adhesives, sealants for construction and automotive, and paints and coatings also contribute significantly. The Asia Pacific region is anticipated to be a key growth driver due to rapid industrialization and rising consumer product consumption.
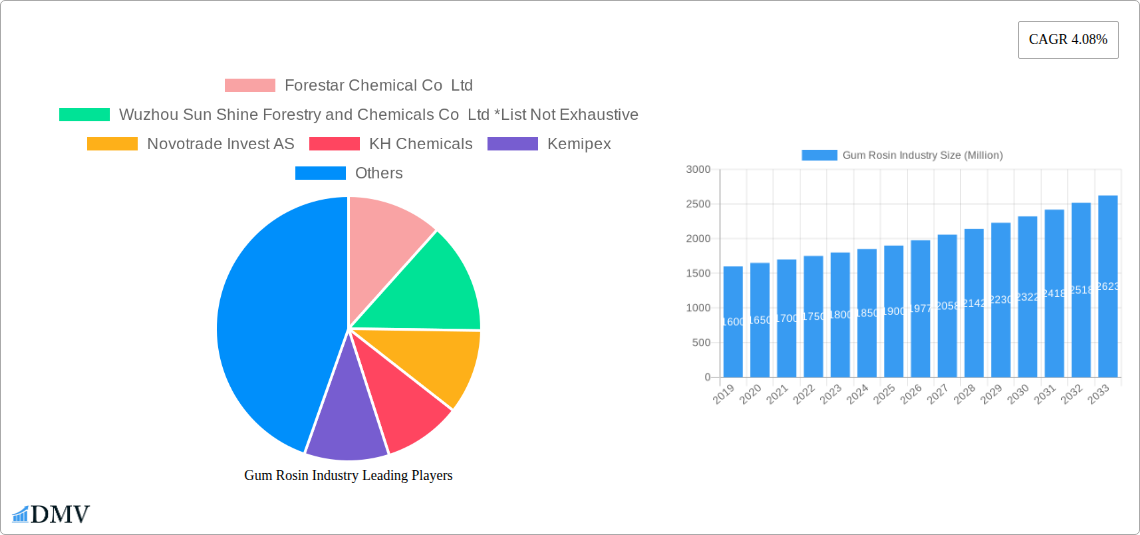
Gum Rosin Industry Market Size (In Billion)
Market restraints include fluctuations in raw pine resin availability and price, influenced by environmental factors. The emergence of synthetic alternatives may also pose competitive challenges. However, gum rosin's inherent biodegradability and eco-friendly profile are increasingly advantageous in a sustainability-focused market. Leading players like Forestar Chemical Co Ltd, Harima Chemicals Group Inc, and Arakawa Chemical Industries Ltd are focused on R&D for process optimization, new applications, and market expansion. The market features a fragmented structure with both international corporations and regional manufacturers.
Gum Rosin Industry Company Market Share
Gum Rosin Industry Market Analysis & Forecast 2019–2033
This comprehensive report delves into the dynamic gum rosin market, offering an in-depth analysis of its current composition, historical trajectory, and future potential. Examining key segments, regional dominance, product innovations, and the competitive landscape, this report provides actionable insights for stakeholders within the pine chemical industry, natural resin market, and related sectors. Covering the study period of 2019–2033, with a base year of 2025 and a forecast period of 2025–2033, this research is essential for understanding the evolving dynamics of gum rosin applications in paper sizing, printing inks, adhesives and sealants, rubber, and paints and coatings.
Gum Rosin Industry Market Composition & Trends
The global gum rosin market exhibits a moderate concentration, characterized by the presence of both established multinational corporations and emerging regional players. Innovation catalysts include advancements in sustainable sourcing, product refinement for enhanced performance in specific applications, and the development of bio-based alternatives. The regulatory landscape, while generally supportive of natural products, presents evolving standards for environmental impact and chemical safety, influencing market entry and product development. Substitute products, such as synthetic resins and petroleum-based tackifiers, pose a continuous competitive challenge, necessitating continuous differentiation for gum rosin. End-user profiles are diverse, spanning the paper manufacturing, printing, adhesives, automotive, and construction industries. Mergers and acquisitions (M&A) activity within the gum rosin supply chain has been notable, with deal values ranging from XX Million to XXX Million, aimed at consolidating market share, expanding product portfolios, and strengthening geographical reach. Key M&A trends include vertical integration to secure raw material supply and strategic partnerships to enhance distribution networks. Market share distribution reveals a gradual shift towards players with strong R&D capabilities and a commitment to sustainability, with projected market share shifts of X% to Y% in the coming years.
Gum Rosin Industry Industry Evolution
The gum rosin industry has undergone significant evolution throughout the historical period of 2019–2024 and is poised for further transformation in the forecast period 2025–2033. Market growth trajectories have been influenced by a confluence of factors, including increasing demand for sustainable and bio-based materials across various end-use industries and fluctuating raw material availability due to climatic conditions and forestry management practices. Technological advancements have played a crucial role in enhancing the efficiency of rosin extraction and processing, leading to higher purity grades and improved product consistency. Innovations in refining processes have enabled the development of specialized gum rosin derivatives with tailored properties for demanding applications. Shifting consumer demands, driven by a growing awareness of environmental issues and a preference for natural ingredients, have propelled the demand for pine chemical derivatives. This trend is particularly evident in sectors like food packaging, cosmetics, and eco-friendly adhesives, where the natural origin of gum rosin offers a distinct advantage. The adoption of advanced processing techniques has seen a growth rate of approximately XX% annually, contributing to the overall market expansion. Furthermore, the increasing focus on circular economy principles is fostering research into novel applications and recycling methods for gum rosin-based products. The market is projected to experience a Compound Annual Growth Rate (CAGR) of X.X% between 2025 and 2033, driven by these evolving dynamics and an increasing global emphasis on renewable resources.
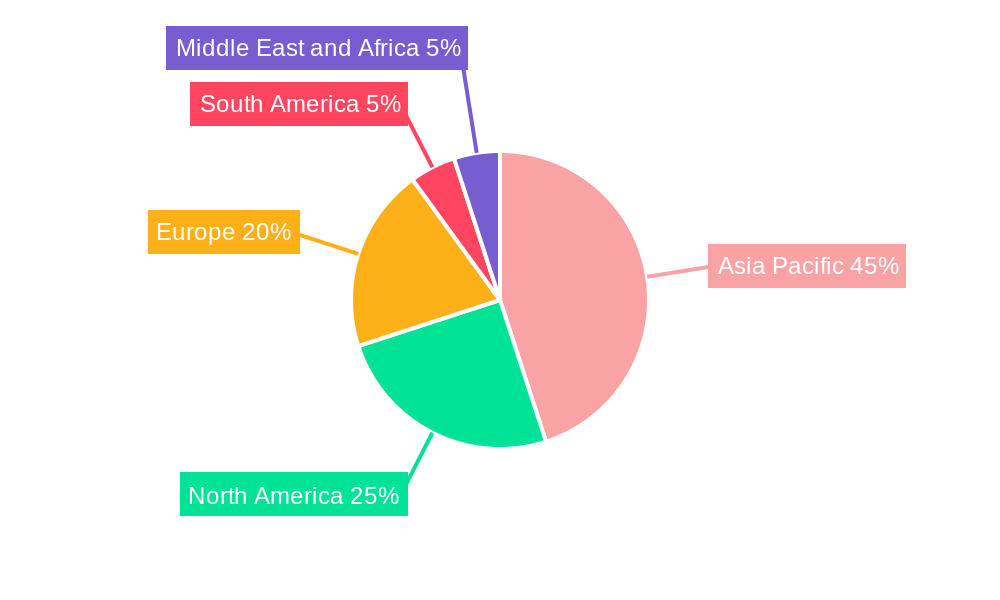
Leading Regions, Countries, or Segments in Gum Rosin Industry
The gum rosin market is experiencing significant dominance from the Asia Pacific region, primarily driven by the robust growth of its manufacturing sector and substantial demand from key application segments. Within this region, China stands out as a leading producer and consumer of gum rosin, owing to its extensive pine forest resources and a highly developed industrial base. The Paper Sizing segment consistently emerges as a major driver of gum rosin consumption globally. This application leverages the unique properties of gum rosin to improve paper strength, water resistance, and printability. The rising demand for high-quality paper products, particularly in emerging economies, directly fuels the growth of this segment. Furthermore, the Adhesives and Sealants market is witnessing substantial expansion, with gum rosin serving as a critical tackifier and binder, enhancing the performance and adhesion properties of various formulations. The automotive and construction industries' recovery and growth contribute significantly to this demand.
Key drivers for the dominance of the Asia Pacific region and the Paper Sizing and Adhesives and Sealants segments include:
- Investment Trends: Significant foreign and domestic investment in pulp and paper manufacturing, as well as in the production of adhesives and sealants, particularly in China and Southeast Asian countries, has created a strong demand base for gum rosin.
- Regulatory Support: Favorable government policies promoting the use of bio-based and renewable materials in manufacturing processes contribute to the growth of gum rosin consumption. Initiatives aimed at promoting sustainable forestry practices also indirectly support the supply chain.
- Cost-Effectiveness: The availability of raw materials and relatively lower production costs in the Asia Pacific region make gum rosin an economically attractive option compared to synthetic alternatives for many applications.
- Growing End-Use Industries: The burgeoning middle class and increasing disposable incomes in the Asia Pacific region are driving demand for consumer goods, packaging, and construction, all of which heavily rely on paper, adhesives, and coatings.
- Technological Advancements: Continuous improvements in rosin processing technologies in the region are leading to the production of higher quality and specialized grades of gum rosin, meeting the evolving needs of diverse applications.
While other regions like North America and Europe are significant consumers, their growth rates are often tempered by more mature markets and a stronger presence of synthetic alternatives. However, the increasing focus on sustainability in these regions is also creating opportunities for high-quality, sustainably sourced gum rosin. The dominance of these segments and regions underscores the fundamental role gum rosin plays in essential industrial processes and its growing appeal as a natural, bio-based material.
Gum Rosin Industry Product Innovations
Product innovations in the gum rosin industry are primarily focused on enhancing performance and expanding application versatility. Manufacturers are developing modified rosins and rosin derivatives with improved thermal stability, solubility, and tackifying properties. For instance, hydrogenated and disproportionated rosins offer superior oxidation resistance and color stability, crucial for high-performance adhesives and coatings. Esterified rosins are gaining traction for their excellent compatibility and emulsifying capabilities in printing inks and paints. Furthermore, advancements in oleochemical integration are leading to the development of bio-based formulations that leverage rosin's natural properties for environmentally friendly solutions in sealants and rubber compounding. These innovations address specific industry needs, leading to enhanced product longevity and reduced environmental impact.
Propelling Factors for Gum Rosin Industry Growth
The gum rosin industry's growth is propelled by several key factors. The increasing global demand for sustainable and bio-based materials, driven by environmental consciousness and regulatory mandates, is a significant catalyst. As industries seek alternatives to petrochemical-based products, natural resins like gum rosin offer a renewable and biodegradable solution. Technological advancements in extraction and processing methods are leading to higher purity and specialized grades of gum rosin, enhancing its performance in various applications such as paper sizing, printing inks, adhesives, and rubber. Economic growth, particularly in emerging markets, fuels demand in key end-use sectors like construction, automotive, and packaging, thereby increasing the consumption of gum rosin. Government initiatives promoting the use of natural resources and sustainable manufacturing practices further support market expansion.
Obstacles in the Gum Rosin Industry Market
Despite its growth potential, the gum rosin industry faces several obstacles. Fluctuations in raw material availability and pricing, often influenced by weather patterns and forestry management practices, can create supply chain volatility and impact profitability. Competition from synthetic tackifiers and alternative resins, which may offer perceived cost advantages or specific performance characteristics, poses a continuous challenge. Stringent environmental regulations regarding forestry practices and chemical processing, while promoting sustainability, can also increase compliance costs for manufacturers. Furthermore, the relatively slow adoption rates of new technologies in some traditional end-use sectors can hinder the widespread implementation of innovative gum rosin applications.
Future Opportunities in Gum Rosin Industry
Emerging opportunities in the gum rosin industry lie in the expanding market for eco-friendly products and the development of novel high-value applications. The growing demand for sustainable packaging solutions presents a significant avenue for gum rosin-based adhesives and coatings. Advancements in nanotechnology and biocomposite materials offer potential for integrating gum rosin to enhance material properties. The increasing focus on circular economy principles is also fostering research into the recycling and upcycling of rosin-containing products, creating new revenue streams. Furthermore, exploring niche applications in pharmaceuticals, food additives, and personal care products, where natural ingredients are highly valued, presents untapped potential.
Major Players in the Gum Rosin Industry Ecosystem
- Forestar Chemical Co Ltd
- Wuzhou Sun Shine Forestry and Chemicals Co Ltd
- Novotrade Invest AS
- KH Chemicals
- Kemipex
- PT INDOPICRI ( Indonesia Pine Chemical Industri )
- Harima Chemicals Group Inc
- Guangxi Dinghong Resin Co Ltd
- Finjetchemical Co Ltd
- Silver Fern Chemical Inc
- Guangxi Tone Resin Chemical Co Ltd
- United Resins
- Foreverest Resources Ltd
- Arakawa Chemical Industries Ltd
- DRT (Dérivés Résiniques et Terpéniques)
Key Developments in Gum Rosin Industry Industry
- 2023: Forestar Chemical Co Ltd announces expansion of production capacity for high-purity gum rosin derivatives, targeting the adhesives and sealants market.
- 2023: DRT (Dérivés Résiniques et Terpéniques) acquires a stake in a sustainable forestry management company to secure long-term raw material supply and enhance its eco-friendly product portfolio.
- 2022: Harima Chemicals Group Inc launches a new line of bio-based tackifiers derived from gum rosin, offering enhanced performance and environmental benefits for printing inks.
- 2022: PT INDOPICRI (Indonesia Pine Chemical Industri) invests in advanced processing technology to improve the quality and consistency of its gum rosin exports to European markets.
- 2021: Arakawa Chemical Industries Ltd develops a novel gum rosin-based emulsifier for waterborne coatings, improving sustainability and performance.
- 2021: Guangxi Dinghong Resin Co Ltd expands its R&D efforts in developing specialized gum rosin applications for the automotive industry.
- 2020: Foreverest Resources Ltd establishes new distribution partnerships in North America to increase its market reach for gum rosin products in paper sizing applications.
- 2020: Kemipex reports increased demand for its gum rosin offerings driven by a surge in the construction sector and the need for high-quality adhesives.
- 2019: Novotrade Invest AS focuses on enhancing supply chain traceability and sustainability certifications for its gum rosin products.
Strategic Gum Rosin Industry Market Forecast
The strategic market forecast for the gum rosin industry indicates sustained growth, driven by the increasing global preference for sustainable and bio-based materials. Key growth catalysts include the expanding applications in eco-friendly packaging, high-performance adhesives, and specialized coatings. Technological advancements in processing and product modification will unlock new market segments and enhance competitive positioning. The robust demand from emerging economies, coupled with supportive regulatory frameworks promoting renewable resources, further strengthens the market outlook. Continuous innovation in product development and a focus on supply chain resilience will be crucial for capitalizing on these opportunities and ensuring long-term market success.
Gum Rosin Industry Segmentation
-
1. Application
- 1.1. Paper Sizing
- 1.2. Printing Ink
- 1.3. Adhesives and Sealants
- 1.4. Rubber
- 1.5. Paints and Coatings
- 1.6. Other Applications
Gum Rosin Industry Segmentation By Geography
-
1. Asia Pacific
- 1.1. China
- 1.2. India
- 1.3. Japan
- 1.4. South Korea
- 1.5. Rest of Asia Pacific
-
2. North America
- 2.1. United States
- 2.2. Canada
- 2.3. Mexico
-
3. Europe
- 3.1. Germany
- 3.2. United Kingdom
- 3.3. Italy
- 3.4. France
- 3.5. Rest of Europe
-
4. South America
- 4.1. Brazil
- 4.2. Argentina
- 4.3. Rest of South America
-
5. Middle East and Africa
- 5.1. Saudi Arabia
- 5.2. South Africa
- 5.3. Rest of Middle East and Africa
Gum Rosin Industry Regional Market Share
Geographic Coverage of Gum Rosin Industry
Gum Rosin Industry REPORT HIGHLIGHTS
| Aspects | Details |
|---|---|
| Study Period | 2020-2034 |
| Base Year | 2025 |
| Estimated Year | 2026 |
| Forecast Period | 2026-2034 |
| Historical Period | 2020-2025 |
| Growth Rate | CAGR of 4.4% from 2020-2034 |
| Segmentation |
|
Table of Contents
- 1. Introduction
- 1.1. Research Scope
- 1.2. Market Segmentation
- 1.3. Research Objective
- 1.4. Definitions and Assumptions
- 2. Executive Summary
- 2.1. Market Snapshot
- 3. Market Dynamics
- 3.1. Market Drivers
- 3.2. Market Restrains
- 3.3. Market Trends
- 3.4. Market Opportunities
- 4. Market Factor Analysis
- 4.1. Porters Five Forces
- 4.1.1. Bargaining Power of Suppliers
- 4.1.2. Bargaining Power of Buyers
- 4.1.3. Threat of New Entrants
- 4.1.4. Threat of Substitutes
- 4.1.5. Competitive Rivalry
- 4.2. PESTEL analysis
- 4.3. BCG Analysis
- 4.3.1. Stars (High Growth, High Market Share)
- 4.3.2. Cash Cows (Low Growth, High Market Share)
- 4.3.3. Question Mark (High Growth, Low Market Share)
- 4.3.4. Dogs (Low Growth, Low Market Share)
- 4.4. Ansoff Matrix Analysis
- 4.5. Supply Chain Analysis
- 4.6. Regulatory Landscape
- 4.7. Current Market Potential and Opportunity Assessment (TAM–SAM–SOM Framework)
- 4.8. DMV Analyst Note
- 4.1. Porters Five Forces
- 5. Market Analysis, Insights and Forecast 2021-2033
- 5.1. Market Analysis, Insights and Forecast - by Application
- 5.1.1. Paper Sizing
- 5.1.2. Printing Ink
- 5.1.3. Adhesives and Sealants
- 5.1.4. Rubber
- 5.1.5. Paints and Coatings
- 5.1.6. Other Applications
- 5.2. Market Analysis, Insights and Forecast - by Region
- 5.2.1. Asia Pacific
- 5.2.2. North America
- 5.2.3. Europe
- 5.2.4. South America
- 5.2.5. Middle East and Africa
- 5.1. Market Analysis, Insights and Forecast - by Application
- 6. Global Gum Rosin Industry Analysis, Insights and Forecast, 2021-2033
- 6.1. Market Analysis, Insights and Forecast - by Application
- 6.1.1. Paper Sizing
- 6.1.2. Printing Ink
- 6.1.3. Adhesives and Sealants
- 6.1.4. Rubber
- 6.1.5. Paints and Coatings
- 6.1.6. Other Applications
- 6.1. Market Analysis, Insights and Forecast - by Application
- 7. Asia Pacific Gum Rosin Industry Analysis, Insights and Forecast, 2020-2032
- 7.1. Market Analysis, Insights and Forecast - by Application
- 7.1.1. Paper Sizing
- 7.1.2. Printing Ink
- 7.1.3. Adhesives and Sealants
- 7.1.4. Rubber
- 7.1.5. Paints and Coatings
- 7.1.6. Other Applications
- 7.1. Market Analysis, Insights and Forecast - by Application
- 8. North America Gum Rosin Industry Analysis, Insights and Forecast, 2020-2032
- 8.1. Market Analysis, Insights and Forecast - by Application
- 8.1.1. Paper Sizing
- 8.1.2. Printing Ink
- 8.1.3. Adhesives and Sealants
- 8.1.4. Rubber
- 8.1.5. Paints and Coatings
- 8.1.6. Other Applications
- 8.1. Market Analysis, Insights and Forecast - by Application
- 9. Europe Gum Rosin Industry Analysis, Insights and Forecast, 2020-2032
- 9.1. Market Analysis, Insights and Forecast - by Application
- 9.1.1. Paper Sizing
- 9.1.2. Printing Ink
- 9.1.3. Adhesives and Sealants
- 9.1.4. Rubber
- 9.1.5. Paints and Coatings
- 9.1.6. Other Applications
- 9.1. Market Analysis, Insights and Forecast - by Application
- 10. South America Gum Rosin Industry Analysis, Insights and Forecast, 2020-2032
- 10.1. Market Analysis, Insights and Forecast - by Application
- 10.1.1. Paper Sizing
- 10.1.2. Printing Ink
- 10.1.3. Adhesives and Sealants
- 10.1.4. Rubber
- 10.1.5. Paints and Coatings
- 10.1.6. Other Applications
- 10.1. Market Analysis, Insights and Forecast - by Application
- 11. Middle East and Africa Gum Rosin Industry Analysis, Insights and Forecast, 2020-2032
- 11.1. Market Analysis, Insights and Forecast - by Application
- 11.1.1. Paper Sizing
- 11.1.2. Printing Ink
- 11.1.3. Adhesives and Sealants
- 11.1.4. Rubber
- 11.1.5. Paints and Coatings
- 11.1.6. Other Applications
- 11.1. Market Analysis, Insights and Forecast - by Application
- 12. Competitive Analysis
- 12.1. Company Profiles
- 12.1.1 Forestar Chemical Co Ltd
- 12.1.1.1. Company Overview
- 12.1.1.2. Products
- 12.1.1.3. Company Financials
- 12.1.1.4. SWOT Analysis
- 12.1.2 Wuzhou Sun Shine Forestry and Chemicals Co Ltd *List Not Exhaustive
- 12.1.2.1. Company Overview
- 12.1.2.2. Products
- 12.1.2.3. Company Financials
- 12.1.2.4. SWOT Analysis
- 12.1.3 Novotrade Invest AS
- 12.1.3.1. Company Overview
- 12.1.3.2. Products
- 12.1.3.3. Company Financials
- 12.1.3.4. SWOT Analysis
- 12.1.4 KH Chemicals
- 12.1.4.1. Company Overview
- 12.1.4.2. Products
- 12.1.4.3. Company Financials
- 12.1.4.4. SWOT Analysis
- 12.1.5 Kemipex
- 12.1.5.1. Company Overview
- 12.1.5.2. Products
- 12.1.5.3. Company Financials
- 12.1.5.4. SWOT Analysis
- 12.1.6 PT INDOPICRI ( Indonesia Pine Chemical Industri )
- 12.1.6.1. Company Overview
- 12.1.6.2. Products
- 12.1.6.3. Company Financials
- 12.1.6.4. SWOT Analysis
- 12.1.7 Harima Chemicals Group Inc
- 12.1.7.1. Company Overview
- 12.1.7.2. Products
- 12.1.7.3. Company Financials
- 12.1.7.4. SWOT Analysis
- 12.1.8 Guangxi Dinghong Resin Co Ltd
- 12.1.8.1. Company Overview
- 12.1.8.2. Products
- 12.1.8.3. Company Financials
- 12.1.8.4. SWOT Analysis
- 12.1.9 Finjetchemical Co Ltd
- 12.1.9.1. Company Overview
- 12.1.9.2. Products
- 12.1.9.3. Company Financials
- 12.1.9.4. SWOT Analysis
- 12.1.10 Silver Fern Chemical Inc
- 12.1.10.1. Company Overview
- 12.1.10.2. Products
- 12.1.10.3. Company Financials
- 12.1.10.4. SWOT Analysis
- 12.1.11 Guangxi Tone Resin Chemical Co Ltd
- 12.1.11.1. Company Overview
- 12.1.11.2. Products
- 12.1.11.3. Company Financials
- 12.1.11.4. SWOT Analysis
- 12.1.12 United Resins
- 12.1.12.1. Company Overview
- 12.1.12.2. Products
- 12.1.12.3. Company Financials
- 12.1.12.4. SWOT Analysis
- 12.1.13 Foreverest Resources Ltd
- 12.1.13.1. Company Overview
- 12.1.13.2. Products
- 12.1.13.3. Company Financials
- 12.1.13.4. SWOT Analysis
- 12.1.14 Arakawa Chemical Industries Ltd
- 12.1.14.1. Company Overview
- 12.1.14.2. Products
- 12.1.14.3. Company Financials
- 12.1.14.4. SWOT Analysis
- 12.1.15 DRT (Dérivés Résiniques et Terpéniques)
- 12.1.15.1. Company Overview
- 12.1.15.2. Products
- 12.1.15.3. Company Financials
- 12.1.15.4. SWOT Analysis
- 12.1.1 Forestar Chemical Co Ltd
- 12.2. Market Entropy
- 12.2.1 Company's Key Areas Served
- 12.2.2 Recent Developments
- 12.3. Company Market Share Analysis 2025
- 12.3.1 Top 5 Companies Market Share Analysis
- 12.3.2 Top 3 Companies Market Share Analysis
- 12.4. List of Potential Customers
- 13. Research Methodology
List of Figures
- Figure 1: Global Gum Rosin Industry Revenue Breakdown (million, %) by Region 2025 & 2033
- Figure 2: Global Gum Rosin Industry Volume Breakdown (K Tons, %) by Region 2025 & 2033
- Figure 3: Asia Pacific Gum Rosin Industry Revenue (million), by Application 2025 & 2033
- Figure 4: Asia Pacific Gum Rosin Industry Volume (K Tons), by Application 2025 & 2033
- Figure 5: Asia Pacific Gum Rosin Industry Revenue Share (%), by Application 2025 & 2033
- Figure 6: Asia Pacific Gum Rosin Industry Volume Share (%), by Application 2025 & 2033
- Figure 7: Asia Pacific Gum Rosin Industry Revenue (million), by Country 2025 & 2033
- Figure 8: Asia Pacific Gum Rosin Industry Volume (K Tons), by Country 2025 & 2033
- Figure 9: Asia Pacific Gum Rosin Industry Revenue Share (%), by Country 2025 & 2033
- Figure 10: Asia Pacific Gum Rosin Industry Volume Share (%), by Country 2025 & 2033
- Figure 11: North America Gum Rosin Industry Revenue (million), by Application 2025 & 2033
- Figure 12: North America Gum Rosin Industry Volume (K Tons), by Application 2025 & 2033
- Figure 13: North America Gum Rosin Industry Revenue Share (%), by Application 2025 & 2033
- Figure 14: North America Gum Rosin Industry Volume Share (%), by Application 2025 & 2033
- Figure 15: North America Gum Rosin Industry Revenue (million), by Country 2025 & 2033
- Figure 16: North America Gum Rosin Industry Volume (K Tons), by Country 2025 & 2033
- Figure 17: North America Gum Rosin Industry Revenue Share (%), by Country 2025 & 2033
- Figure 18: North America Gum Rosin Industry Volume Share (%), by Country 2025 & 2033
- Figure 19: Europe Gum Rosin Industry Revenue (million), by Application 2025 & 2033
- Figure 20: Europe Gum Rosin Industry Volume (K Tons), by Application 2025 & 2033
- Figure 21: Europe Gum Rosin Industry Revenue Share (%), by Application 2025 & 2033
- Figure 22: Europe Gum Rosin Industry Volume Share (%), by Application 2025 & 2033
- Figure 23: Europe Gum Rosin Industry Revenue (million), by Country 2025 & 2033
- Figure 24: Europe Gum Rosin Industry Volume (K Tons), by Country 2025 & 2033
- Figure 25: Europe Gum Rosin Industry Revenue Share (%), by Country 2025 & 2033
- Figure 26: Europe Gum Rosin Industry Volume Share (%), by Country 2025 & 2033
- Figure 27: South America Gum Rosin Industry Revenue (million), by Application 2025 & 2033
- Figure 28: South America Gum Rosin Industry Volume (K Tons), by Application 2025 & 2033
- Figure 29: South America Gum Rosin Industry Revenue Share (%), by Application 2025 & 2033
- Figure 30: South America Gum Rosin Industry Volume Share (%), by Application 2025 & 2033
- Figure 31: South America Gum Rosin Industry Revenue (million), by Country 2025 & 2033
- Figure 32: South America Gum Rosin Industry Volume (K Tons), by Country 2025 & 2033
- Figure 33: South America Gum Rosin Industry Revenue Share (%), by Country 2025 & 2033
- Figure 34: South America Gum Rosin Industry Volume Share (%), by Country 2025 & 2033
- Figure 35: Middle East and Africa Gum Rosin Industry Revenue (million), by Application 2025 & 2033
- Figure 36: Middle East and Africa Gum Rosin Industry Volume (K Tons), by Application 2025 & 2033
- Figure 37: Middle East and Africa Gum Rosin Industry Revenue Share (%), by Application 2025 & 2033
- Figure 38: Middle East and Africa Gum Rosin Industry Volume Share (%), by Application 2025 & 2033
- Figure 39: Middle East and Africa Gum Rosin Industry Revenue (million), by Country 2025 & 2033
- Figure 40: Middle East and Africa Gum Rosin Industry Volume (K Tons), by Country 2025 & 2033
- Figure 41: Middle East and Africa Gum Rosin Industry Revenue Share (%), by Country 2025 & 2033
- Figure 42: Middle East and Africa Gum Rosin Industry Volume Share (%), by Country 2025 & 2033
List of Tables
- Table 1: Global Gum Rosin Industry Revenue million Forecast, by Application 2020 & 2033
- Table 2: Global Gum Rosin Industry Volume K Tons Forecast, by Application 2020 & 2033
- Table 3: Global Gum Rosin Industry Revenue million Forecast, by Region 2020 & 2033
- Table 4: Global Gum Rosin Industry Volume K Tons Forecast, by Region 2020 & 2033
- Table 5: Global Gum Rosin Industry Revenue million Forecast, by Application 2020 & 2033
- Table 6: Global Gum Rosin Industry Volume K Tons Forecast, by Application 2020 & 2033
- Table 7: Global Gum Rosin Industry Revenue million Forecast, by Country 2020 & 2033
- Table 8: Global Gum Rosin Industry Volume K Tons Forecast, by Country 2020 & 2033
- Table 9: China Gum Rosin Industry Revenue (million) Forecast, by Application 2020 & 2033
- Table 10: China Gum Rosin Industry Volume (K Tons) Forecast, by Application 2020 & 2033
- Table 11: India Gum Rosin Industry Revenue (million) Forecast, by Application 2020 & 2033
- Table 12: India Gum Rosin Industry Volume (K Tons) Forecast, by Application 2020 & 2033
- Table 13: Japan Gum Rosin Industry Revenue (million) Forecast, by Application 2020 & 2033
- Table 14: Japan Gum Rosin Industry Volume (K Tons) Forecast, by Application 2020 & 2033
- Table 15: South Korea Gum Rosin Industry Revenue (million) Forecast, by Application 2020 & 2033
- Table 16: South Korea Gum Rosin Industry Volume (K Tons) Forecast, by Application 2020 & 2033
- Table 17: Rest of Asia Pacific Gum Rosin Industry Revenue (million) Forecast, by Application 2020 & 2033
- Table 18: Rest of Asia Pacific Gum Rosin Industry Volume (K Tons) Forecast, by Application 2020 & 2033
- Table 19: Global Gum Rosin Industry Revenue million Forecast, by Application 2020 & 2033
- Table 20: Global Gum Rosin Industry Volume K Tons Forecast, by Application 2020 & 2033
- Table 21: Global Gum Rosin Industry Revenue million Forecast, by Country 2020 & 2033
- Table 22: Global Gum Rosin Industry Volume K Tons Forecast, by Country 2020 & 2033
- Table 23: United States Gum Rosin Industry Revenue (million) Forecast, by Application 2020 & 2033
- Table 24: United States Gum Rosin Industry Volume (K Tons) Forecast, by Application 2020 & 2033
- Table 25: Canada Gum Rosin Industry Revenue (million) Forecast, by Application 2020 & 2033
- Table 26: Canada Gum Rosin Industry Volume (K Tons) Forecast, by Application 2020 & 2033
- Table 27: Mexico Gum Rosin Industry Revenue (million) Forecast, by Application 2020 & 2033
- Table 28: Mexico Gum Rosin Industry Volume (K Tons) Forecast, by Application 2020 & 2033
- Table 29: Global Gum Rosin Industry Revenue million Forecast, by Application 2020 & 2033
- Table 30: Global Gum Rosin Industry Volume K Tons Forecast, by Application 2020 & 2033
- Table 31: Global Gum Rosin Industry Revenue million Forecast, by Country 2020 & 2033
- Table 32: Global Gum Rosin Industry Volume K Tons Forecast, by Country 2020 & 2033
- Table 33: Germany Gum Rosin Industry Revenue (million) Forecast, by Application 2020 & 2033
- Table 34: Germany Gum Rosin Industry Volume (K Tons) Forecast, by Application 2020 & 2033
- Table 35: United Kingdom Gum Rosin Industry Revenue (million) Forecast, by Application 2020 & 2033
- Table 36: United Kingdom Gum Rosin Industry Volume (K Tons) Forecast, by Application 2020 & 2033
- Table 37: Italy Gum Rosin Industry Revenue (million) Forecast, by Application 2020 & 2033
- Table 38: Italy Gum Rosin Industry Volume (K Tons) Forecast, by Application 2020 & 2033
- Table 39: France Gum Rosin Industry Revenue (million) Forecast, by Application 2020 & 2033
- Table 40: France Gum Rosin Industry Volume (K Tons) Forecast, by Application 2020 & 2033
- Table 41: Rest of Europe Gum Rosin Industry Revenue (million) Forecast, by Application 2020 & 2033
- Table 42: Rest of Europe Gum Rosin Industry Volume (K Tons) Forecast, by Application 2020 & 2033
- Table 43: Global Gum Rosin Industry Revenue million Forecast, by Application 2020 & 2033
- Table 44: Global Gum Rosin Industry Volume K Tons Forecast, by Application 2020 & 2033
- Table 45: Global Gum Rosin Industry Revenue million Forecast, by Country 2020 & 2033
- Table 46: Global Gum Rosin Industry Volume K Tons Forecast, by Country 2020 & 2033
- Table 47: Brazil Gum Rosin Industry Revenue (million) Forecast, by Application 2020 & 2033
- Table 48: Brazil Gum Rosin Industry Volume (K Tons) Forecast, by Application 2020 & 2033
- Table 49: Argentina Gum Rosin Industry Revenue (million) Forecast, by Application 2020 & 2033
- Table 50: Argentina Gum Rosin Industry Volume (K Tons) Forecast, by Application 2020 & 2033
- Table 51: Rest of South America Gum Rosin Industry Revenue (million) Forecast, by Application 2020 & 2033
- Table 52: Rest of South America Gum Rosin Industry Volume (K Tons) Forecast, by Application 2020 & 2033
- Table 53: Global Gum Rosin Industry Revenue million Forecast, by Application 2020 & 2033
- Table 54: Global Gum Rosin Industry Volume K Tons Forecast, by Application 2020 & 2033
- Table 55: Global Gum Rosin Industry Revenue million Forecast, by Country 2020 & 2033
- Table 56: Global Gum Rosin Industry Volume K Tons Forecast, by Country 2020 & 2033
- Table 57: Saudi Arabia Gum Rosin Industry Revenue (million) Forecast, by Application 2020 & 2033
- Table 58: Saudi Arabia Gum Rosin Industry Volume (K Tons) Forecast, by Application 2020 & 2033
- Table 59: South Africa Gum Rosin Industry Revenue (million) Forecast, by Application 2020 & 2033
- Table 60: South Africa Gum Rosin Industry Volume (K Tons) Forecast, by Application 2020 & 2033
- Table 61: Rest of Middle East and Africa Gum Rosin Industry Revenue (million) Forecast, by Application 2020 & 2033
- Table 62: Rest of Middle East and Africa Gum Rosin Industry Volume (K Tons) Forecast, by Application 2020 & 2033
Frequently Asked Questions
1. What is the projected Compound Annual Growth Rate (CAGR) of the Gum Rosin Industry?
The projected CAGR is approximately 4.4%.
2. Which companies are prominent players in the Gum Rosin Industry?
Key companies in the market include Forestar Chemical Co Ltd, Wuzhou Sun Shine Forestry and Chemicals Co Ltd *List Not Exhaustive, Novotrade Invest AS, KH Chemicals, Kemipex, PT INDOPICRI ( Indonesia Pine Chemical Industri ), Harima Chemicals Group Inc, Guangxi Dinghong Resin Co Ltd, Finjetchemical Co Ltd, Silver Fern Chemical Inc, Guangxi Tone Resin Chemical Co Ltd, United Resins, Foreverest Resources Ltd, Arakawa Chemical Industries Ltd, DRT (Dérivés Résiniques et Terpéniques).
3. What are the main segments of the Gum Rosin Industry?
The market segments include Application.
4. Can you provide details about the market size?
The market size is estimated to be USD 2632.6 million as of 2022.
5. What are some drivers contributing to market growth?
Growing Demand for Bio-based Adhesives and Sealants; Burgeoning Paper Packaging Industry; Other Drivers.
6. What are the notable trends driving market growth?
The Adhesives and Sealants Segment is Expected to Dominate the Market.
7. Are there any restraints impacting market growth?
Shift of Interest toward Tall Oil Rosin-based Phenolic Resins; Other Restraints.
8. Can you provide examples of recent developments in the market?
N/A
9. What pricing options are available for accessing the report?
Pricing options include single-user, multi-user, and enterprise licenses priced at USD 4750, USD 5250, and USD 8750 respectively.
10. Is the market size provided in terms of value or volume?
The market size is provided in terms of value, measured in million and volume, measured in K Tons.
11. Are there any specific market keywords associated with the report?
Yes, the market keyword associated with the report is "Gum Rosin Industry," which aids in identifying and referencing the specific market segment covered.
12. How do I determine which pricing option suits my needs best?
The pricing options vary based on user requirements and access needs. Individual users may opt for single-user licenses, while businesses requiring broader access may choose multi-user or enterprise licenses for cost-effective access to the report.
13. Are there any additional resources or data provided in the Gum Rosin Industry report?
While the report offers comprehensive insights, it's advisable to review the specific contents or supplementary materials provided to ascertain if additional resources or data are available.
14. How can I stay updated on further developments or reports in the Gum Rosin Industry?
To stay informed about further developments, trends, and reports in the Gum Rosin Industry, consider subscribing to industry newsletters, following relevant companies and organizations, or regularly checking reputable industry news sources and publications.
Methodology
Step 1 - Identification of Relevant Samples Size from Population Database


Step 2 - Approaches for Defining Global Market Size (Value, Volume* & Price*)

Note*: In applicable scenarios
Step 3 - Data Sources
Primary Research
- Web Analytics
- Survey Reports
- Research Institute
- Latest Research Reports
- Opinion Leaders
Secondary Research
- Annual Reports
- White Paper
- Latest Press Release
- Industry Association
- Paid Database
- Investor Presentations

Step 4 - Data Triangulation
Involves using different sources of information in order to increase the validity of a study
These sources are likely to be stakeholders in a program - participants, other researchers, program staff, other community members, and so on.
Then we put all data in single framework & apply various statistical tools to find out the dynamic on the market.
During the analysis stage, feedback from the stakeholder groups would be compared to determine areas of agreement as well as areas of divergence