

Key Insights
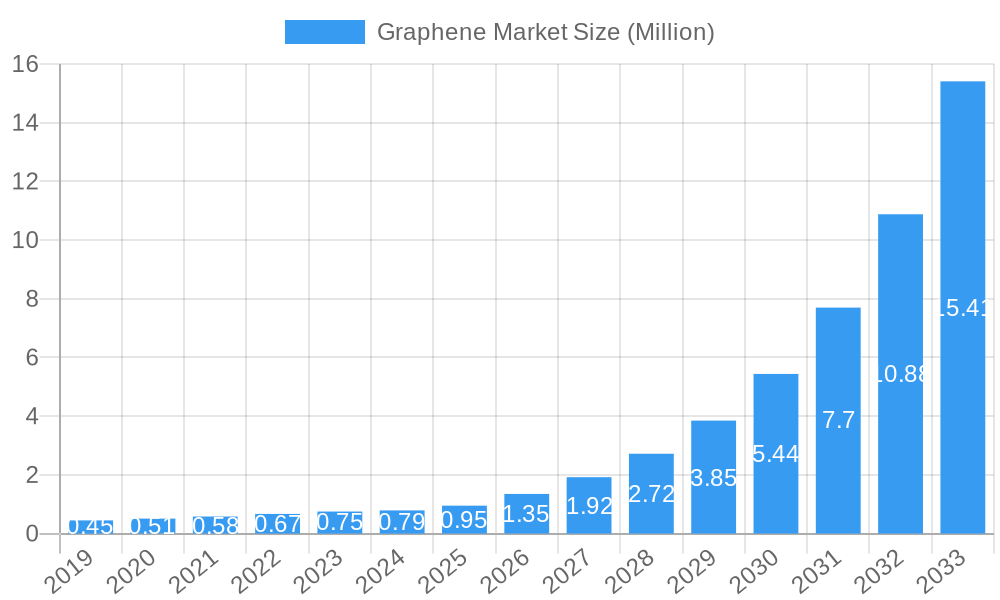
The global graphene market is poised for explosive growth, with a current market size estimated at $0.79 million and a projected Compound Annual Growth Rate (CAGR) of an astonishing 43.64% during the forecast period of 2025-2033. This exceptional trajectory is fueled by a confluence of groundbreaking advancements and an ever-expanding array of applications across diverse industries. The intrinsic properties of graphene, including its unparalleled strength, conductivity, and flexibility, make it a transformative material for next-generation technologies. Key drivers for this rapid expansion include the escalating demand for high-performance materials in the electronics sector, where graphene promises to revolutionize semiconductors, displays, and energy storage solutions. The biomedical and healthcare industries are also witnessing significant adoption, with graphene’s potential in drug delivery, biosensing, and advanced diagnostics opening new frontiers. Furthermore, the aerospace and defense sectors are increasingly leveraging graphene for its lightweight yet robust characteristics in structural components and advanced materials, while the energy sector is exploring its capabilities in batteries, supercapacitors, and solar cells.
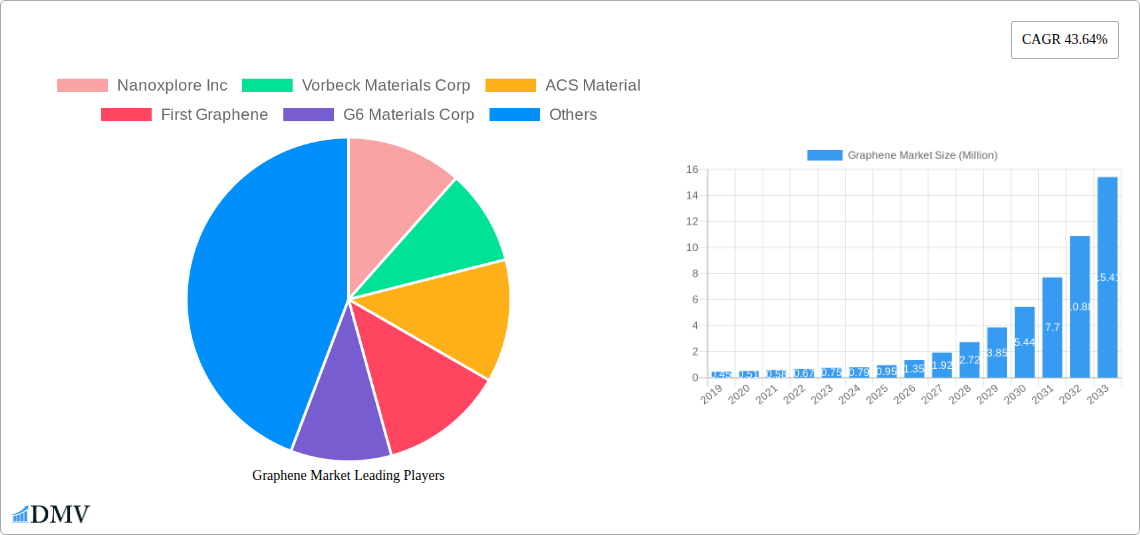
Graphene Market Market Size (In Million)
The market’s segmentation reveals a dynamic landscape. Graphene Sheets and Films are anticipated to dominate, driven by their versatility in flexible electronics and coatings. Nanoplatelets and Nanoribbons are also set to experience substantial growth due to their tailored properties for specific applications. Emerging trends point towards enhanced production techniques leading to higher purity and scalability, alongside the development of functionalized graphene for specialized performance. While the market’s growth is robust, certain restraints, such as the high cost of large-scale production and the need for standardized quality control, may present challenges. However, ongoing research and development efforts are actively addressing these hurdles, paving the way for wider commercialization and widespread adoption. The Asia Pacific region, particularly China and South Korea, is expected to lead this growth due to strong manufacturing capabilities and significant investments in research and innovation.
Graphene Market Company Market Share
Unlock the immense potential of the graphene industry with this in-depth market report. Covering the historical period of 2019–2024, the base year of 2025, and an extensive forecast period of 2025–2033, this report provides unparalleled insights into the global graphene market. Dive deep into market composition, industry evolution, leading regions, product innovations, growth drivers, obstacles, future opportunities, major players, key developments, and a strategic market forecast. This report is meticulously crafted for stakeholders seeking to understand market dynamics, identify investment opportunities, and navigate the rapidly expanding graphene landscape.
Graphene Market Market Composition & Trends
The graphene market is characterized by a dynamic blend of emerging technologies and established industrial applications. Market concentration is influenced by the ongoing research and development efforts and the increasing adoption of graphene-enhanced materials across various sectors. Innovation catalysts include breakthroughs in graphene production methods, leading to higher quality and lower cost materials, and the discovery of novel applications. Regulatory landscapes are evolving to support the safe and widespread integration of graphene. Substitute products, while present, often fall short in delivering the unique combination of properties offered by graphene, such as exceptional strength, conductivity, and flexibility. End-user profiles are increasingly diverse, spanning from advanced electronics and energy storage solutions to sophisticated biomedical applications and high-performance aerospace components. Mergers and acquisitions (M&A) activities are on the rise, signifying industry consolidation and strategic partnerships to accelerate market penetration and technological advancement. The market share distribution is gradually shifting as new players emerge and existing ones scale up their production capacities. M&A deal values are projected to increase significantly as companies seek to secure intellectual property and expand their market reach. The integration of graphene nanoplatelets and graphene oxide into composites and coatings represents a significant trend, driving demand for these specific product types. The electronics and telecommunication sector continues to be a primary driver of graphene adoption, with ongoing research into next-generation displays, semiconductors, and flexible electronics.
Graphene Market Industry Evolution
The graphene industry has witnessed a remarkable evolution, driven by relentless technological advancements and a growing understanding of its transformative potential. From its initial discovery, graphene has transitioned from a laboratory curiosity to a commercially viable material with a market growth trajectory that promises exponential expansion. The study period of 2019–2024 has seen significant investments in graphene manufacturing techniques, leading to improved scalability and reduced production costs. These advancements are crucial for meeting the burgeoning demand from various end-user industries. For instance, in the energy sector, the adoption of graphene in batteries and supercapacitors is revolutionizing energy storage capabilities, offering faster charging times and higher energy densities. This trend is supported by an estimated growth rate of XX% annually in this segment. Similarly, the bio-medical and healthcare industry is leveraging graphene's unique properties for drug delivery, biosensing, and advanced medical imaging, with adoption metrics showing a steady increase as regulatory approvals are granted and clinical trials yield positive results. The aerospace and defense sector is exploring graphene for lightweight yet incredibly strong composite materials, enhancing fuel efficiency and structural integrity. Consumer demand is increasingly shifting towards products that offer superior performance and sustainability, creating a fertile ground for graphene-enabled innovations. The forecast period of 2025–2033 is anticipated to see an acceleration in market penetration as production capacities scale up and a wider array of applications become commercially viable. Early adoption metrics from sectors like electronics and telecommunication for advanced displays and conductive inks are already indicating a strong demand signal. The industry's evolution is a testament to continuous innovation in material science and engineering, pushing the boundaries of what is possible with this remarkable two-dimensional material.
Leading Regions, Countries, or Segments in Graphene Market
The global graphene market is experiencing significant regional and segmental growth, with specific areas and product types demonstrating pronounced leadership.
- Dominant Product Type: Graphene Nanoplatelets are emerging as a leading product type due to their versatility and cost-effectiveness in bulk applications. Their widespread use in composites, coatings, and polymers drives significant market share. The forecast suggests a continued upward trend, fueled by demand for enhanced material properties.
- Key Driver for Nanoplatelets: Investment trends in sectors like automotive and construction, which increasingly utilize graphene nanoplatelets for lightweighting and improved durability, are major contributors.
- Leading End-user Industry: The Electronics and Telecommunication sector remains a cornerstone of the graphene market. The insatiable demand for faster, more efficient, and flexible electronic devices fuels the adoption of graphene in components like transistors, sensors, and advanced displays.
- Key Drivers for Electronics: Regulatory support for next-generation communication technologies (e.g., 5G) and significant R&D investments by major electronics manufacturers are pivotal growth catalysts. The pursuit of smaller, more powerful, and energy-efficient components inherently favors materials like graphene.
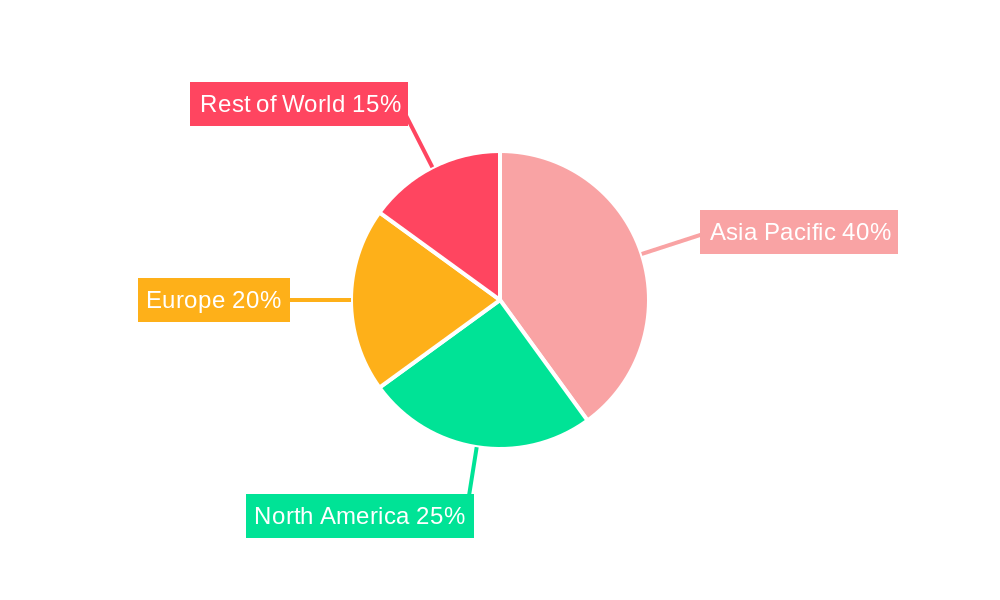
- Regional Dominance: Asia-Pacific, particularly China, is a significant contributor to the graphene market's growth, driven by its robust manufacturing capabilities and substantial government support for advanced materials research and development. The region benefits from a strong presence of graphene production facilities and a vast domestic market.
- Key Drivers for Asia-Pacific: Government initiatives promoting high-tech industries, extensive research infrastructure, and a large consumer base create a highly conducive environment for graphene market expansion. The presence of key players like Changzhou Two-Dimensional Carbon Technology Co Ltd and The Sixth Element (Changzhou) Materials Technology Co Ltd solidifies this dominance.
While Graphene Sheets and Films are crucial for highly specialized electronic applications, and Graphene Oxide finds significant use in biomedical research and flexible electronics, the sheer volume and diverse application range of Graphene Nanoplatelets currently position them as a primary growth segment. Similarly, while the Bio-medical and Healthcare, Energy, and Aerospace and Defense sectors represent substantial future markets, the immediate and broad-scale demand from Electronics and Telecommunication solidifies its current leadership. The ongoing advancements in graphene production technologies are further democratizing access to these advanced materials, accelerating adoption across all segments and regions.
Graphene Market Product Innovations
Product innovation in the graphene market is characterized by a relentless pursuit of enhanced performance and novel applications. Graphene Sheets and Films are achieving unprecedented levels of conductivity and transparency, enabling next-generation flexible displays and high-speed electronic components. Graphene Nanoplatelets are being engineered for superior dispersion and integration into polymers, yielding composites with exceptional mechanical strength, thermal conductivity, and electrical shielding capabilities. Graphene Oxide is finding new avenues in advanced drug delivery systems and biosensors, leveraging its biocompatibility and functionalization potential. Performance metrics such as electrical conductivity exceeding 10,000 S/cm and tensile strength of up to 130 GPa are becoming increasingly achievable, differentiating graphene-enhanced products. Unique selling propositions include the creation of lightweight yet incredibly durable materials, significantly improved energy storage solutions with faster charge/discharge cycles, and highly sensitive diagnostic tools.
Propelling Factors for Graphene Market Growth
The graphene market is propelled by several key factors, creating a robust growth trajectory.
- Technological Advancements: Breakthroughs in graphene production techniques, such as CVD (Chemical Vapor Deposition) and liquid-phase exfoliation, are leading to higher quality, larger scale, and more cost-effective graphene materials. This makes them increasingly accessible for commercial applications.
- Growing Demand from End-User Industries: The electronics sector's need for faster, smaller, and more efficient components, coupled with the energy sector's demand for advanced battery and supercapacitor solutions, are major drivers.
- Government Initiatives and R&D Funding: Significant government investments in advanced materials research and development worldwide are fostering innovation and accelerating the commercialization of graphene.
- Unique Material Properties: Graphene's exceptional strength, conductivity (electrical and thermal), flexibility, and barrier properties make it a highly sought-after material for a wide range of high-performance applications.
Obstacles in the Graphene Market Market
Despite its immense potential, the graphene market faces several obstacles that warrant careful consideration.
- High Production Costs: While improving, the cost of producing high-quality graphene at commercial scales remains a barrier for widespread adoption in some price-sensitive applications.
- Scalability Challenges: Transitioning from laboratory-scale production to mass industrial production of consistent, high-quality graphene can be complex and capital-intensive.
- Standardization and Quality Control: Developing industry-wide standards for graphene quality and characterization is crucial for ensuring consistent performance and building market confidence.
- Regulatory Hurdles: Navigating evolving health, safety, and environmental regulations associated with novel nanomaterials can slow down product development and market entry.
- Lack of Awareness and Education: A deeper understanding of graphene's capabilities and potential applications among potential end-users is still needed to accelerate market penetration.
Future Opportunities in Graphene Market
The graphene market is brimming with future opportunities, driven by ongoing innovation and evolving industry needs.
- Emergence of New Markets: The development of graphene-based sensors for environmental monitoring, wearable health trackers, and advanced agricultural applications opens up entirely new market segments.
- Next-Generation Energy Storage: Continued research into graphene-enhanced batteries and supercapacitors promises to revolutionize electric vehicles, grid storage, and portable electronics, offering faster charging and longer lifespans.
- Advanced Composites: The growing demand for lightweight, high-strength materials in aerospace, automotive, and construction industries presents a significant opportunity for graphene-reinforced composites.
- Biotechnology and Healthcare: Innovations in graphene-based drug delivery systems, biosensors for early disease detection, and tissue engineering hold immense promise for improving healthcare outcomes.
- Smart Textiles and Wearables: The integration of graphene into textiles for conductive properties, heating, and sensing capabilities opens up a vast market for smart clothing and advanced wearables.
Major Players in the Graphene Market Ecosystem
- Nanoxplore Inc
- Vorbeck Materials Corp
- ACS Material
- First Graphene
- G6 Materials Corp
- Changzhou Two-Dimensional Carbon Technology Co Ltd
- Morsh (Ningbo Moxi Technology Co Ltd)
- The Sixth Element (Changzhou) Materials Technology Co Ltd
- Perpetuus Advanced Materials PLC
- Xiamen Knano Graphene Technology Corporation Limited
- Neograf
- Universal Matter
- Grafoid Inc
- Graphene Production
- Global Graphene Group
- Graphenano Group
- Thomas Swan & Co Ltd
- Haydale Graphene Industries PLC
- Graphenea
- Elcora Advanced Materials Corp
- Versarien PLC
- Graphene Manufacturing Group Ltd
Key Developments in Graphene Market Industry
- March 2023: Universal Matter UK Limited, a wholly-owned subsidiary of Universal Matter Inc., announced the acquisition of Applied Graphene Materials UK Limited and Applied Graphene Materials LLC, the principal operating subsidiaries of Applied Graphene Materials PLC. Through the acquisition, the company has strengthened its market presence and expanded its product portfolio in the graphene sector.
- February 2023: Global Graphene Group announced that Honeycomb Battery Company, an advanced battery technology subsidiary of Global Graphene Group, Inc., signed a business combination agreement with Nubia Brand International Corp. to develop battery materials. Honeycomb Battery Company is expected to utilize graphene produced by the Global Graphene Group, signaling a significant advancement in the commercialization of graphene for energy storage solutions.
Strategic Graphene Market Market Forecast
The strategic graphene market forecast anticipates robust growth driven by accelerating adoption across diverse sectors and continuous innovation in graphene production. The increasing demand for high-performance materials in electronics, energy storage, and aerospace, coupled with advancements in composite technologies, will be key growth catalysts. The forecast period of 2025–2033 is expected to witness a significant expansion in market size as production costs decline and new applications gain commercial traction. Government initiatives promoting advanced materials and the growing awareness of graphene's unique properties will further fuel market penetration. Strategic partnerships and M&A activities are anticipated to consolidate the market and accelerate the development of next-generation graphene-enhanced products, positioning the market for substantial future potential.
Graphene Market Segmentation
-
1. Product Type
- 1.1. Graphene Sheets and Films
- 1.2. Nanoribbons
- 1.3. Nanoplatelets
- 1.4. Graphene Oxide
- 1.5. Other Product Types
-
2. End-user Industry
- 2.1. Electronics and Telecommunication
- 2.2. Bio-medical and Healthcare
- 2.3. Energy
- 2.4. Aerospace and Defense
- 2.5. Other End-user Industries
Graphene Market Segmentation By Geography
-
1. Asia Pacific
- 1.1. China
- 1.2. India
- 1.3. Japan
- 1.4. South Korea
- 1.5. Malaysia
- 1.6. Thailand
- 1.7. Indonesia
- 1.8. Vietnam
- 1.9. Rest of Asia Pacific
-
2. North America
- 2.1. United States
- 2.2. Canada
- 2.3. Mexico
-
3. Europe
- 3.1. Germany
- 3.2. United Kingdom
- 3.3. France
- 3.4. Italy
- 3.5. Spain
- 3.6. NORDIC Countries
- 3.7. Turkey
- 3.8. Russia
- 3.9. Rest of Europe
-
4. South America
- 4.1. Brazil
- 4.2. Argentina
- 4.3. Colombia
- 4.4. Rest of South America
-
5. Middle East and Africa
- 5.1. Saudi Arabia
- 5.2. Qatar
- 5.3. United Arab Emirates
- 5.4. Nigeria
- 5.5. Egypt
- 5.6. South Africa
- 5.7. Rest of Middle East and Africa
Graphene Market Regional Market Share
Geographic Coverage of Graphene Market
Graphene Market REPORT HIGHLIGHTS
| Aspects | Details |
|---|---|
| Study Period | 2020-2034 |
| Base Year | 2025 |
| Estimated Year | 2026 |
| Forecast Period | 2026-2034 |
| Historical Period | 2020-2025 |
| Growth Rate | CAGR of 43.64% from 2020-2034 |
| Segmentation |
|
Table of Contents
- 1. Introduction
- 1.1. Research Scope
- 1.2. Market Segmentation
- 1.3. Research Objective
- 1.4. Definitions and Assumptions
- 2. Executive Summary
- 2.1. Market Snapshot
- 3. Market Dynamics
- 3.1. Market Drivers
- 3.2. Market Restrains
- 3.3. Market Trends
- 3.4. Market Opportunities
- 4. Market Factor Analysis
- 4.1. Porters Five Forces
- 4.1.1. Bargaining Power of Suppliers
- 4.1.2. Bargaining Power of Buyers
- 4.1.3. Threat of New Entrants
- 4.1.4. Threat of Substitutes
- 4.1.5. Competitive Rivalry
- 4.2. PESTEL analysis
- 4.3. BCG Analysis
- 4.3.1. Stars (High Growth, High Market Share)
- 4.3.2. Cash Cows (Low Growth, High Market Share)
- 4.3.3. Question Mark (High Growth, Low Market Share)
- 4.3.4. Dogs (Low Growth, Low Market Share)
- 4.4. Ansoff Matrix Analysis
- 4.5. Supply Chain Analysis
- 4.6. Regulatory Landscape
- 4.7. Current Market Potential and Opportunity Assessment (TAM–SAM–SOM Framework)
- 4.8. DMV Analyst Note
- 4.1. Porters Five Forces
- 5. Market Analysis, Insights and Forecast 2021-2033
- 5.1. Market Analysis, Insights and Forecast - by Product Type
- 5.1.1. Graphene Sheets and Films
- 5.1.2. Nanoribbons
- 5.1.3. Nanoplatelets
- 5.1.4. Graphene Oxide
- 5.1.5. Other Product Types
- 5.2. Market Analysis, Insights and Forecast - by End-user Industry
- 5.2.1. Electronics and Telecommunication
- 5.2.2. Bio-medical and Healthcare
- 5.2.3. Energy
- 5.2.4. Aerospace and Defense
- 5.2.5. Other End-user Industries
- 5.3. Market Analysis, Insights and Forecast - by Region
- 5.3.1. Asia Pacific
- 5.3.2. North America
- 5.3.3. Europe
- 5.3.4. South America
- 5.3.5. Middle East and Africa
- 5.1. Market Analysis, Insights and Forecast - by Product Type
- 6. Global Graphene Market Analysis, Insights and Forecast, 2021-2033
- 6.1. Market Analysis, Insights and Forecast - by Product Type
- 6.1.1. Graphene Sheets and Films
- 6.1.2. Nanoribbons
- 6.1.3. Nanoplatelets
- 6.1.4. Graphene Oxide
- 6.1.5. Other Product Types
- 6.2. Market Analysis, Insights and Forecast - by End-user Industry
- 6.2.1. Electronics and Telecommunication
- 6.2.2. Bio-medical and Healthcare
- 6.2.3. Energy
- 6.2.4. Aerospace and Defense
- 6.2.5. Other End-user Industries
- 6.1. Market Analysis, Insights and Forecast - by Product Type
- 7. Asia Pacific Graphene Market Analysis, Insights and Forecast, 2020-2032
- 7.1. Market Analysis, Insights and Forecast - by Product Type
- 7.1.1. Graphene Sheets and Films
- 7.1.2. Nanoribbons
- 7.1.3. Nanoplatelets
- 7.1.4. Graphene Oxide
- 7.1.5. Other Product Types
- 7.2. Market Analysis, Insights and Forecast - by End-user Industry
- 7.2.1. Electronics and Telecommunication
- 7.2.2. Bio-medical and Healthcare
- 7.2.3. Energy
- 7.2.4. Aerospace and Defense
- 7.2.5. Other End-user Industries
- 7.1. Market Analysis, Insights and Forecast - by Product Type
- 8. North America Graphene Market Analysis, Insights and Forecast, 2020-2032
- 8.1. Market Analysis, Insights and Forecast - by Product Type
- 8.1.1. Graphene Sheets and Films
- 8.1.2. Nanoribbons
- 8.1.3. Nanoplatelets
- 8.1.4. Graphene Oxide
- 8.1.5. Other Product Types
- 8.2. Market Analysis, Insights and Forecast - by End-user Industry
- 8.2.1. Electronics and Telecommunication
- 8.2.2. Bio-medical and Healthcare
- 8.2.3. Energy
- 8.2.4. Aerospace and Defense
- 8.2.5. Other End-user Industries
- 8.1. Market Analysis, Insights and Forecast - by Product Type
- 9. Europe Graphene Market Analysis, Insights and Forecast, 2020-2032
- 9.1. Market Analysis, Insights and Forecast - by Product Type
- 9.1.1. Graphene Sheets and Films
- 9.1.2. Nanoribbons
- 9.1.3. Nanoplatelets
- 9.1.4. Graphene Oxide
- 9.1.5. Other Product Types
- 9.2. Market Analysis, Insights and Forecast - by End-user Industry
- 9.2.1. Electronics and Telecommunication
- 9.2.2. Bio-medical and Healthcare
- 9.2.3. Energy
- 9.2.4. Aerospace and Defense
- 9.2.5. Other End-user Industries
- 9.1. Market Analysis, Insights and Forecast - by Product Type
- 10. South America Graphene Market Analysis, Insights and Forecast, 2020-2032
- 10.1. Market Analysis, Insights and Forecast - by Product Type
- 10.1.1. Graphene Sheets and Films
- 10.1.2. Nanoribbons
- 10.1.3. Nanoplatelets
- 10.1.4. Graphene Oxide
- 10.1.5. Other Product Types
- 10.2. Market Analysis, Insights and Forecast - by End-user Industry
- 10.2.1. Electronics and Telecommunication
- 10.2.2. Bio-medical and Healthcare
- 10.2.3. Energy
- 10.2.4. Aerospace and Defense
- 10.2.5. Other End-user Industries
- 10.1. Market Analysis, Insights and Forecast - by Product Type
- 11. Middle East and Africa Graphene Market Analysis, Insights and Forecast, 2020-2032
- 11.1. Market Analysis, Insights and Forecast - by Product Type
- 11.1.1. Graphene Sheets and Films
- 11.1.2. Nanoribbons
- 11.1.3. Nanoplatelets
- 11.1.4. Graphene Oxide
- 11.1.5. Other Product Types
- 11.2. Market Analysis, Insights and Forecast - by End-user Industry
- 11.2.1. Electronics and Telecommunication
- 11.2.2. Bio-medical and Healthcare
- 11.2.3. Energy
- 11.2.4. Aerospace and Defense
- 11.2.5. Other End-user Industries
- 11.1. Market Analysis, Insights and Forecast - by Product Type
- 12. Competitive Analysis
- 12.1. Company Profiles
- 12.1.1 Nanoxplore Inc
- 12.1.1.1. Company Overview
- 12.1.1.2. Products
- 12.1.1.3. Company Financials
- 12.1.1.4. SWOT Analysis
- 12.1.2 Vorbeck Materials Corp
- 12.1.2.1. Company Overview
- 12.1.2.2. Products
- 12.1.2.3. Company Financials
- 12.1.2.4. SWOT Analysis
- 12.1.3 ACS Material
- 12.1.3.1. Company Overview
- 12.1.3.2. Products
- 12.1.3.3. Company Financials
- 12.1.3.4. SWOT Analysis
- 12.1.4 First Graphene
- 12.1.4.1. Company Overview
- 12.1.4.2. Products
- 12.1.4.3. Company Financials
- 12.1.4.4. SWOT Analysis
- 12.1.5 G6 Materials Corp
- 12.1.5.1. Company Overview
- 12.1.5.2. Products
- 12.1.5.3. Company Financials
- 12.1.5.4. SWOT Analysis
- 12.1.6 Changzhou Two-Dimensional Carbon Technology Co Ltd
- 12.1.6.1. Company Overview
- 12.1.6.2. Products
- 12.1.6.3. Company Financials
- 12.1.6.4. SWOT Analysis
- 12.1.7 Morsh (Ningbo Moxi Technology Co Ltd)
- 12.1.7.1. Company Overview
- 12.1.7.2. Products
- 12.1.7.3. Company Financials
- 12.1.7.4. SWOT Analysis
- 12.1.8 The Sixth Element (Changzhou) Materials Technology Co Ltd
- 12.1.8.1. Company Overview
- 12.1.8.2. Products
- 12.1.8.3. Company Financials
- 12.1.8.4. SWOT Analysis
- 12.1.9 Perpetuus Advanced Materials PLC
- 12.1.9.1. Company Overview
- 12.1.9.2. Products
- 12.1.9.3. Company Financials
- 12.1.9.4. SWOT Analysis
- 12.1.10 Xiamen Knano Graphene Technology Corporation Limited*List Not Exhaustive
- 12.1.10.1. Company Overview
- 12.1.10.2. Products
- 12.1.10.3. Company Financials
- 12.1.10.4. SWOT Analysis
- 12.1.11 Neograf
- 12.1.11.1. Company Overview
- 12.1.11.2. Products
- 12.1.11.3. Company Financials
- 12.1.11.4. SWOT Analysis
- 12.1.12 Universal Matter
- 12.1.12.1. Company Overview
- 12.1.12.2. Products
- 12.1.12.3. Company Financials
- 12.1.12.4. SWOT Analysis
- 12.1.13 Grafoid Inc
- 12.1.13.1. Company Overview
- 12.1.13.2. Products
- 12.1.13.3. Company Financials
- 12.1.13.4. SWOT Analysis
- 12.1.14 Graphene Production
- 12.1.14.1. Company Overview
- 12.1.14.2. Products
- 12.1.14.3. Company Financials
- 12.1.14.4. SWOT Analysis
- 12.1.15 Global Graphene Group
- 12.1.15.1. Company Overview
- 12.1.15.2. Products
- 12.1.15.3. Company Financials
- 12.1.15.4. SWOT Analysis
- 12.1.16 Graphenano Group
- 12.1.16.1. Company Overview
- 12.1.16.2. Products
- 12.1.16.3. Company Financials
- 12.1.16.4. SWOT Analysis
- 12.1.17 Thomas Swan & Co Ltd
- 12.1.17.1. Company Overview
- 12.1.17.2. Products
- 12.1.17.3. Company Financials
- 12.1.17.4. SWOT Analysis
- 12.1.18 Haydale Graphene Industries PLC
- 12.1.18.1. Company Overview
- 12.1.18.2. Products
- 12.1.18.3. Company Financials
- 12.1.18.4. SWOT Analysis
- 12.1.19 Graphenea
- 12.1.19.1. Company Overview
- 12.1.19.2. Products
- 12.1.19.3. Company Financials
- 12.1.19.4. SWOT Analysis
- 12.1.20 Elcora Advanced Materials Corp
- 12.1.20.1. Company Overview
- 12.1.20.2. Products
- 12.1.20.3. Company Financials
- 12.1.20.4. SWOT Analysis
- 12.1.21 Versarien PLC
- 12.1.21.1. Company Overview
- 12.1.21.2. Products
- 12.1.21.3. Company Financials
- 12.1.21.4. SWOT Analysis
- 12.1.22 Graphene Manufacturing Group Ltd
- 12.1.22.1. Company Overview
- 12.1.22.2. Products
- 12.1.22.3. Company Financials
- 12.1.22.4. SWOT Analysis
- 12.1.1 Nanoxplore Inc
- 12.2. Market Entropy
- 12.2.1 Company's Key Areas Served
- 12.2.2 Recent Developments
- 12.3. Company Market Share Analysis 2025
- 12.3.1 Top 5 Companies Market Share Analysis
- 12.3.2 Top 3 Companies Market Share Analysis
- 12.4. List of Potential Customers
- 13. Research Methodology
List of Figures
- Figure 1: Global Graphene Market Revenue Breakdown (Million, %) by Region 2025 & 2033
- Figure 2: Asia Pacific Graphene Market Revenue (Million), by Product Type 2025 & 2033
- Figure 3: Asia Pacific Graphene Market Revenue Share (%), by Product Type 2025 & 2033
- Figure 4: Asia Pacific Graphene Market Revenue (Million), by End-user Industry 2025 & 2033
- Figure 5: Asia Pacific Graphene Market Revenue Share (%), by End-user Industry 2025 & 2033
- Figure 6: Asia Pacific Graphene Market Revenue (Million), by Country 2025 & 2033
- Figure 7: Asia Pacific Graphene Market Revenue Share (%), by Country 2025 & 2033
- Figure 8: North America Graphene Market Revenue (Million), by Product Type 2025 & 2033
- Figure 9: North America Graphene Market Revenue Share (%), by Product Type 2025 & 2033
- Figure 10: North America Graphene Market Revenue (Million), by End-user Industry 2025 & 2033
- Figure 11: North America Graphene Market Revenue Share (%), by End-user Industry 2025 & 2033
- Figure 12: North America Graphene Market Revenue (Million), by Country 2025 & 2033
- Figure 13: North America Graphene Market Revenue Share (%), by Country 2025 & 2033
- Figure 14: Europe Graphene Market Revenue (Million), by Product Type 2025 & 2033
- Figure 15: Europe Graphene Market Revenue Share (%), by Product Type 2025 & 2033
- Figure 16: Europe Graphene Market Revenue (Million), by End-user Industry 2025 & 2033
- Figure 17: Europe Graphene Market Revenue Share (%), by End-user Industry 2025 & 2033
- Figure 18: Europe Graphene Market Revenue (Million), by Country 2025 & 2033
- Figure 19: Europe Graphene Market Revenue Share (%), by Country 2025 & 2033
- Figure 20: South America Graphene Market Revenue (Million), by Product Type 2025 & 2033
- Figure 21: South America Graphene Market Revenue Share (%), by Product Type 2025 & 2033
- Figure 22: South America Graphene Market Revenue (Million), by End-user Industry 2025 & 2033
- Figure 23: South America Graphene Market Revenue Share (%), by End-user Industry 2025 & 2033
- Figure 24: South America Graphene Market Revenue (Million), by Country 2025 & 2033
- Figure 25: South America Graphene Market Revenue Share (%), by Country 2025 & 2033
- Figure 26: Middle East and Africa Graphene Market Revenue (Million), by Product Type 2025 & 2033
- Figure 27: Middle East and Africa Graphene Market Revenue Share (%), by Product Type 2025 & 2033
- Figure 28: Middle East and Africa Graphene Market Revenue (Million), by End-user Industry 2025 & 2033
- Figure 29: Middle East and Africa Graphene Market Revenue Share (%), by End-user Industry 2025 & 2033
- Figure 30: Middle East and Africa Graphene Market Revenue (Million), by Country 2025 & 2033
- Figure 31: Middle East and Africa Graphene Market Revenue Share (%), by Country 2025 & 2033
List of Tables
- Table 1: Global Graphene Market Revenue Million Forecast, by Product Type 2020 & 2033
- Table 2: Global Graphene Market Revenue Million Forecast, by End-user Industry 2020 & 2033
- Table 3: Global Graphene Market Revenue Million Forecast, by Region 2020 & 2033
- Table 4: Global Graphene Market Revenue Million Forecast, by Product Type 2020 & 2033
- Table 5: Global Graphene Market Revenue Million Forecast, by End-user Industry 2020 & 2033
- Table 6: Global Graphene Market Revenue Million Forecast, by Country 2020 & 2033
- Table 7: China Graphene Market Revenue (Million) Forecast, by Application 2020 & 2033
- Table 8: India Graphene Market Revenue (Million) Forecast, by Application 2020 & 2033
- Table 9: Japan Graphene Market Revenue (Million) Forecast, by Application 2020 & 2033
- Table 10: South Korea Graphene Market Revenue (Million) Forecast, by Application 2020 & 2033
- Table 11: Malaysia Graphene Market Revenue (Million) Forecast, by Application 2020 & 2033
- Table 12: Thailand Graphene Market Revenue (Million) Forecast, by Application 2020 & 2033
- Table 13: Indonesia Graphene Market Revenue (Million) Forecast, by Application 2020 & 2033
- Table 14: Vietnam Graphene Market Revenue (Million) Forecast, by Application 2020 & 2033
- Table 15: Rest of Asia Pacific Graphene Market Revenue (Million) Forecast, by Application 2020 & 2033
- Table 16: Global Graphene Market Revenue Million Forecast, by Product Type 2020 & 2033
- Table 17: Global Graphene Market Revenue Million Forecast, by End-user Industry 2020 & 2033
- Table 18: Global Graphene Market Revenue Million Forecast, by Country 2020 & 2033
- Table 19: United States Graphene Market Revenue (Million) Forecast, by Application 2020 & 2033
- Table 20: Canada Graphene Market Revenue (Million) Forecast, by Application 2020 & 2033
- Table 21: Mexico Graphene Market Revenue (Million) Forecast, by Application 2020 & 2033
- Table 22: Global Graphene Market Revenue Million Forecast, by Product Type 2020 & 2033
- Table 23: Global Graphene Market Revenue Million Forecast, by End-user Industry 2020 & 2033
- Table 24: Global Graphene Market Revenue Million Forecast, by Country 2020 & 2033
- Table 25: Germany Graphene Market Revenue (Million) Forecast, by Application 2020 & 2033
- Table 26: United Kingdom Graphene Market Revenue (Million) Forecast, by Application 2020 & 2033
- Table 27: France Graphene Market Revenue (Million) Forecast, by Application 2020 & 2033
- Table 28: Italy Graphene Market Revenue (Million) Forecast, by Application 2020 & 2033
- Table 29: Spain Graphene Market Revenue (Million) Forecast, by Application 2020 & 2033
- Table 30: NORDIC Countries Graphene Market Revenue (Million) Forecast, by Application 2020 & 2033
- Table 31: Turkey Graphene Market Revenue (Million) Forecast, by Application 2020 & 2033
- Table 32: Russia Graphene Market Revenue (Million) Forecast, by Application 2020 & 2033
- Table 33: Rest of Europe Graphene Market Revenue (Million) Forecast, by Application 2020 & 2033
- Table 34: Global Graphene Market Revenue Million Forecast, by Product Type 2020 & 2033
- Table 35: Global Graphene Market Revenue Million Forecast, by End-user Industry 2020 & 2033
- Table 36: Global Graphene Market Revenue Million Forecast, by Country 2020 & 2033
- Table 37: Brazil Graphene Market Revenue (Million) Forecast, by Application 2020 & 2033
- Table 38: Argentina Graphene Market Revenue (Million) Forecast, by Application 2020 & 2033
- Table 39: Colombia Graphene Market Revenue (Million) Forecast, by Application 2020 & 2033
- Table 40: Rest of South America Graphene Market Revenue (Million) Forecast, by Application 2020 & 2033
- Table 41: Global Graphene Market Revenue Million Forecast, by Product Type 2020 & 2033
- Table 42: Global Graphene Market Revenue Million Forecast, by End-user Industry 2020 & 2033
- Table 43: Global Graphene Market Revenue Million Forecast, by Country 2020 & 2033
- Table 44: Saudi Arabia Graphene Market Revenue (Million) Forecast, by Application 2020 & 2033
- Table 45: Qatar Graphene Market Revenue (Million) Forecast, by Application 2020 & 2033
- Table 46: United Arab Emirates Graphene Market Revenue (Million) Forecast, by Application 2020 & 2033
- Table 47: Nigeria Graphene Market Revenue (Million) Forecast, by Application 2020 & 2033
- Table 48: Egypt Graphene Market Revenue (Million) Forecast, by Application 2020 & 2033
- Table 49: South Africa Graphene Market Revenue (Million) Forecast, by Application 2020 & 2033
- Table 50: Rest of Middle East and Africa Graphene Market Revenue (Million) Forecast, by Application 2020 & 2033
Frequently Asked Questions
1. What is the projected Compound Annual Growth Rate (CAGR) of the Graphene Market?
The projected CAGR is approximately 43.64%.
2. Which companies are prominent players in the Graphene Market?
Key companies in the market include Nanoxplore Inc, Vorbeck Materials Corp, ACS Material, First Graphene, G6 Materials Corp, Changzhou Two-Dimensional Carbon Technology Co Ltd, Morsh (Ningbo Moxi Technology Co Ltd), The Sixth Element (Changzhou) Materials Technology Co Ltd, Perpetuus Advanced Materials PLC, Xiamen Knano Graphene Technology Corporation Limited*List Not Exhaustive, Neograf, Universal Matter, Grafoid Inc, Graphene Production, Global Graphene Group, Graphenano Group, Thomas Swan & Co Ltd, Haydale Graphene Industries PLC, Graphenea, Elcora Advanced Materials Corp, Versarien PLC, Graphene Manufacturing Group Ltd.
3. What are the main segments of the Graphene Market?
The market segments include Product Type, End-user Industry.
4. Can you provide details about the market size?
The market size is estimated to be USD 0.79 Million as of 2022.
5. What are some drivers contributing to market growth?
Graphene Aiding the Aerospace Industry; Rising Demand for Printed Electronics.
6. What are the notable trends driving market growth?
Electronics and Telecommunication Segment to Dominate the Market.
7. Are there any restraints impacting market growth?
Higher Costs of Technology.
8. Can you provide examples of recent developments in the market?
In March 2023, Universal Matter UK Limited, a wholly-owned subsidiary of Universal Matter Inc., announced the acquisition of Applied Graphene Materials UK Limited and Applied Graphene Materials LLC, the principal operating subsidiaries of Applied Graphene Materials PLC. Through the acquisition, the company has strengthened its market presence.
9. What pricing options are available for accessing the report?
Pricing options include single-user, multi-user, and enterprise licenses priced at USD 4750, USD 5250, and USD 8750 respectively.
10. Is the market size provided in terms of value or volume?
The market size is provided in terms of value, measured in Million.
11. Are there any specific market keywords associated with the report?
Yes, the market keyword associated with the report is "Graphene Market," which aids in identifying and referencing the specific market segment covered.
12. How do I determine which pricing option suits my needs best?
The pricing options vary based on user requirements and access needs. Individual users may opt for single-user licenses, while businesses requiring broader access may choose multi-user or enterprise licenses for cost-effective access to the report.
13. Are there any additional resources or data provided in the Graphene Market report?
While the report offers comprehensive insights, it's advisable to review the specific contents or supplementary materials provided to ascertain if additional resources or data are available.
14. How can I stay updated on further developments or reports in the Graphene Market?
To stay informed about further developments, trends, and reports in the Graphene Market, consider subscribing to industry newsletters, following relevant companies and organizations, or regularly checking reputable industry news sources and publications.
Methodology
Step 1 - Identification of Relevant Samples Size from Population Database


Step 2 - Approaches for Defining Global Market Size (Value, Volume* & Price*)

Note*: In applicable scenarios
Step 3 - Data Sources
Primary Research
- Web Analytics
- Survey Reports
- Research Institute
- Latest Research Reports
- Opinion Leaders
Secondary Research
- Annual Reports
- White Paper
- Latest Press Release
- Industry Association
- Paid Database
- Investor Presentations

Step 4 - Data Triangulation
Involves using different sources of information in order to increase the validity of a study
These sources are likely to be stakeholders in a program - participants, other researchers, program staff, other community members, and so on.
Then we put all data in single framework & apply various statistical tools to find out the dynamic on the market.
During the analysis stage, feedback from the stakeholder groups would be compared to determine areas of agreement as well as areas of divergence