

Key Insights
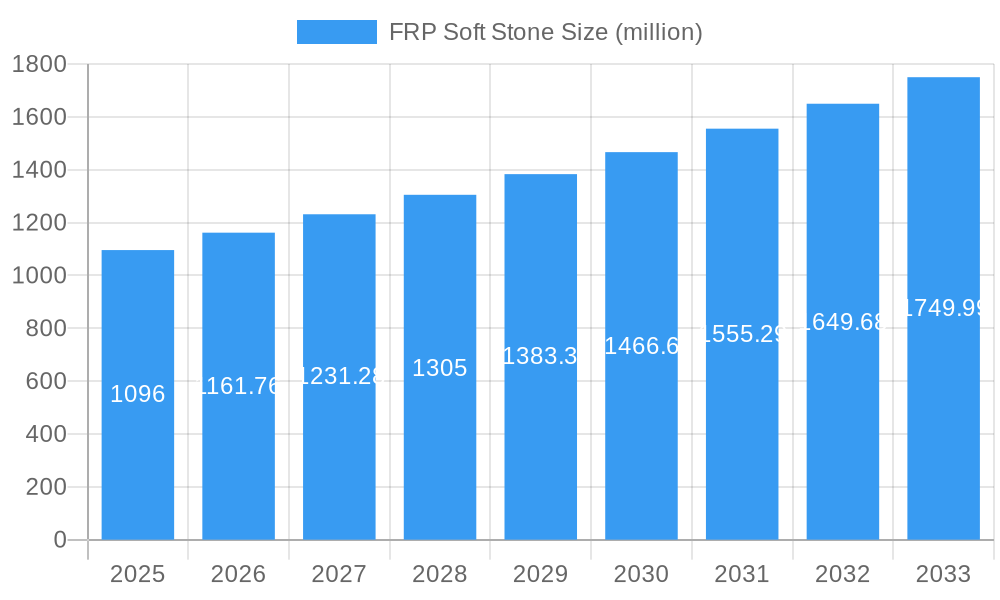
The FRP Soft Stone market, valued at $1096 million in 2025, exhibits robust growth potential, projected to expand at a compound annual growth rate (CAGR) of 6% from 2025 to 2033. This growth is fueled by several key drivers. Increasing demand for lightweight, durable, and aesthetically pleasing building materials in construction projects across residential, commercial, and infrastructure sectors is a primary factor. The material's versatility, enabling intricate designs and seamless integration with other materials, further enhances its appeal. Furthermore, the rising awareness of sustainability and the eco-friendly nature of FRP Soft Stone, compared to traditional stone alternatives, contributes significantly to market expansion. The growing adoption of prefabricated building components and the need for faster construction timelines also positively impact market growth. However, challenges exist. Price competitiveness against traditional materials and potential variations in product quality across different manufacturers can act as market restraints. Nevertheless, continuous advancements in manufacturing techniques and the development of new applications are poised to mitigate these challenges, pushing market expansion.
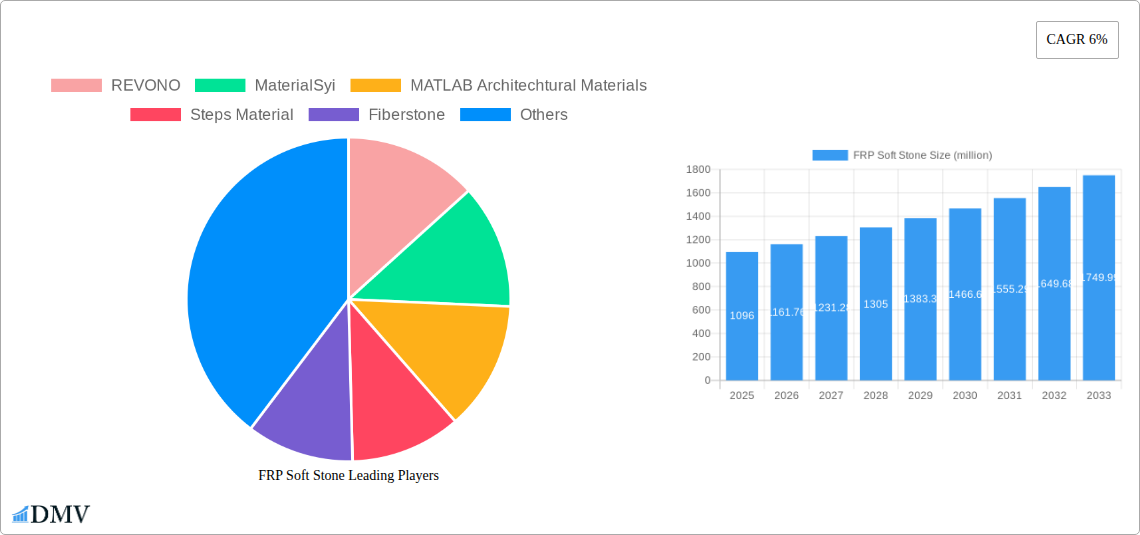
FRP Soft Stone Market Size (In Billion)
The competitive landscape is characterized by a mix of established players and emerging companies. Key players such as REVONO, MaterialSyi, and Huntsman Corporation are actively engaged in expanding their product portfolios and geographical reach. Innovation in terms of material compositions, improved durability, and enhanced aesthetic options are major areas of competitive focus. The market is segmented by application (e.g., interior cladding, exterior cladding, landscaping), product type (e.g., panels, tiles), and geography. Regional variations in growth rates are expected, with regions experiencing rapid infrastructure development likely to showcase higher adoption rates. Future market projections suggest a consistent upward trend, driven by technological advancements and expanding applications within the construction and design industry, particularly in developing economies.
FRP Soft Stone Company Market Share
FRP Soft Stone Market Report: A Comprehensive Analysis (2019-2033)
This insightful report provides a comprehensive analysis of the FRP Soft Stone market, projecting a multi-million dollar valuation by 2033. It delves into market dynamics, technological advancements, competitive landscapes, and future growth opportunities, offering invaluable insights for stakeholders across the industry. The study period covers 2019-2033, with 2025 as the base and estimated year. The forecast period spans 2025-2033, building upon historical data from 2019-2024. Key players like REVONO, MaterialSyi, and Strongwell Corporation are profiled, alongside an examination of industry developments and market segmentation.
FRP Soft Stone Market Composition & Trends
This section meticulously analyzes the FRP Soft Stone market's structure, revealing concentration levels and identifying key innovation drivers. We examine the regulatory landscape, exploring its impact on market growth and the emergence of substitute products. Furthermore, we profile end-user segments and their evolving needs, analyzing recent M&A activities, including deal values and their implications for market share distribution. The analysis considers market share distribution among top players, estimating that the top 5 companies collectively hold approximately xx% of the market. M&A activities during the historical period totaled an estimated xx million USD, primarily driven by efforts to consolidate market share and expand product portfolios. Innovation is primarily driven by the development of new resin systems and fiber reinforcement technologies, seeking improvements in durability, aesthetics, and cost-effectiveness.
- Market Concentration: Highlighted by the market share of leading players.
- Innovation Catalysts: Focus on material science advancements and sustainability concerns.
- Regulatory Landscape: Examination of relevant building codes and environmental regulations.
- Substitute Products: Analysis of competing materials like natural stone and other composites.
- End-User Profiles: Detailed segmentation by application (e.g., construction, interior design).
- M&A Activities: Review of mergers and acquisitions, including deal values and strategic rationale.
FRP Soft Stone Industry Evolution
This section provides a detailed historical overview and future projections of the FRP Soft Stone market. We examine growth trajectories from 2019 to 2024, noting a Compound Annual Growth Rate (CAGR) of xx% and projecting a CAGR of xx% during the forecast period. This growth is fueled by technological advancements, such as improved manufacturing processes leading to enhanced product performance and reduced costs. Additionally, we analyze shifting consumer demands, focusing on the increasing preference for sustainable and aesthetically pleasing building materials. The adoption rate of FRP Soft Stone has seen substantial growth, increasing by xx% from 2020 to 2024. Future projections indicate continued growth driven by advancements in material science, leading to increased durability and fire resistance. Factors such as rising construction activities in developing economies and growing environmental awareness are contributing significantly to this growth trajectory.
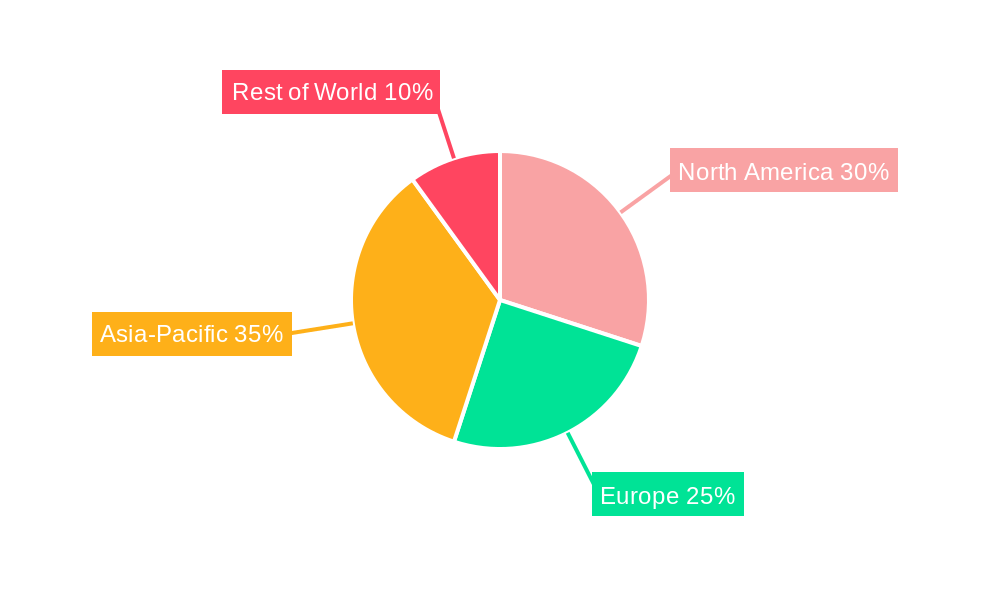
Leading Regions, Countries, or Segments in FRP Soft Stone
This section identifies the dominant regions and segments within the FRP Soft Stone market. Our analysis indicates that [Region Name] currently holds the largest market share, driven by several key factors.
- Key Drivers in [Region Name]:
- Strong government investment in infrastructure projects.
- Favorable regulatory policies promoting the use of sustainable materials.
- High construction activity fueled by economic growth.
- A well-established supply chain.
[Region Name]'s dominance stems from its robust construction sector and supportive government policies promoting sustainable building practices. The region's thriving economy and established infrastructure further contribute to its leading position in FRP Soft Stone adoption. The high demand coupled with a supportive regulatory environment has attracted significant investments in manufacturing and R&D activities within this region, solidifying its market leadership.
FRP Soft Stone Product Innovations
Recent innovations in FRP Soft Stone focus on enhancing its durability, aesthetics, and ease of installation. New resin systems and fiber reinforcement techniques have yielded products with improved resistance to weathering, UV degradation, and impact damage. These advancements have expanded the application possibilities of FRP Soft Stone into various construction and interior design projects, further fueled by the introduction of custom coloring and texturing options. Unique selling propositions include its lightweight nature, superior strength-to-weight ratio, and environmentally friendly properties.
Propelling Factors for FRP Soft Stone Growth
The FRP Soft Stone market is experiencing significant growth due to a confluence of factors. Technological advancements continue to improve product performance and reduce manufacturing costs, enhancing its competitiveness. Economically, the increasing demand for sustainable and durable building materials, coupled with rising construction activity worldwide, fuels market expansion. Supportive government regulations promoting sustainable building practices further contribute to its growth trajectory. The rising consumer preference for aesthetically pleasing and low-maintenance materials is another significant driver.
Obstacles in the FRP Soft Stone Market
Despite its growth potential, the FRP Soft Stone market faces challenges. Strict environmental regulations regarding the disposal of composite materials can hinder growth. Supply chain disruptions, including fluctuations in raw material prices and manufacturing capacity constraints, pose significant risks. Furthermore, intense competition from established players and the emergence of substitute materials present a persistent challenge, impacting profit margins and market share.
Future Opportunities in FRP Soft Stone
The future of FRP Soft Stone is bright, with significant opportunities arising from expanding into new markets, particularly in developing economies with burgeoning construction sectors. Further technological advancements, focusing on improved fire resistance and enhanced aesthetic properties, will drive innovation. Emerging consumer trends favoring sustainable and customizable building materials will create significant demand. The adoption of innovative manufacturing techniques will play a vital role in reducing production costs and expanding market accessibility.
Major Players in the FRP Soft Stone Ecosystem
- REVONO
- MaterialSyi
- MATLAB Architectural Materials
- Steps Material
- Fiberstone
- Huntsman Corporation
- Greenfiber
- Mondo Polymer Technologies
- Alstrong Enterprises India
- Strongwell Corporation
- Creative Composites Group
- Fiber-Tech Industries
- StonCor Group
- Tufcot Engineering Ltd
- FlexForm Technologies
- 3AC Core Materials
Key Developments in FRP Soft Stone Industry
- 2022 Q3: Strongwell Corporation launched a new line of high-performance FRP Soft Stone panels.
- 2023 Q1: A major merger between two leading FRP Soft Stone manufacturers resulted in a significant increase in market share for the combined entity.
- 2024 Q4: Several new patents were filed for improved manufacturing processes and material formulations. (Further details are needed to complete this section)
Strategic FRP Soft Stone Market Forecast
The FRP Soft Stone market is poised for continued strong growth throughout the forecast period, driven by technological advancements, supportive regulations, and expanding construction activity. The market’s potential is substantial, with untapped opportunities in emerging markets and new applications. Innovation in material science and manufacturing processes will be key to maintaining this growth trajectory and enhancing the competitiveness of FRP Soft Stone in the global marketplace. Continued investments in R&D and strategic partnerships are expected to further consolidate market share among key players.
FRP Soft Stone Segmentation
-
1. Application
- 1.1. Residential
- 1.2. Commercial
-
2. Types
- 2.1. Carbon Fiber Reinforced Polymer
- 2.2. Aramid Fiber Reinforced Polymer
- 2.3. Glass Reinforced Polymer
- 2.4. Others
FRP Soft Stone Segmentation By Geography
-
1. North America
- 1.1. United States
- 1.2. Canada
- 1.3. Mexico
-
2. South America
- 2.1. Brazil
- 2.2. Argentina
- 2.3. Rest of South America
-
3. Europe
- 3.1. United Kingdom
- 3.2. Germany
- 3.3. France
- 3.4. Italy
- 3.5. Spain
- 3.6. Russia
- 3.7. Benelux
- 3.8. Nordics
- 3.9. Rest of Europe
-
4. Middle East & Africa
- 4.1. Turkey
- 4.2. Israel
- 4.3. GCC
- 4.4. North Africa
- 4.5. South Africa
- 4.6. Rest of Middle East & Africa
-
5. Asia Pacific
- 5.1. China
- 5.2. India
- 5.3. Japan
- 5.4. South Korea
- 5.5. ASEAN
- 5.6. Oceania
- 5.7. Rest of Asia Pacific
FRP Soft Stone Regional Market Share
Geographic Coverage of FRP Soft Stone
FRP Soft Stone REPORT HIGHLIGHTS
| Aspects | Details |
|---|---|
| Study Period | 2020-2034 |
| Base Year | 2025 |
| Estimated Year | 2026 |
| Forecast Period | 2026-2034 |
| Historical Period | 2020-2025 |
| Growth Rate | CAGR of 6% from 2020-2034 |
| Segmentation |
|
Table of Contents
- 1. Introduction
- 1.1. Research Scope
- 1.2. Market Segmentation
- 1.3. Research Methodology
- 1.4. Definitions and Assumptions
- 2. Executive Summary
- 2.1. Introduction
- 3. Market Dynamics
- 3.1. Introduction
- 3.2. Market Drivers
- 3.3. Market Restrains
- 3.4. Market Trends
- 4. Market Factor Analysis
- 4.1. Porters Five Forces
- 4.2. Supply/Value Chain
- 4.3. PESTEL analysis
- 4.4. Market Entropy
- 4.5. Patent/Trademark Analysis
- 5. Global FRP Soft Stone Analysis, Insights and Forecast, 2020-2032
- 5.1. Market Analysis, Insights and Forecast - by Application
- 5.1.1. Residential
- 5.1.2. Commercial
- 5.2. Market Analysis, Insights and Forecast - by Types
- 5.2.1. Carbon Fiber Reinforced Polymer
- 5.2.2. Aramid Fiber Reinforced Polymer
- 5.2.3. Glass Reinforced Polymer
- 5.2.4. Others
- 5.3. Market Analysis, Insights and Forecast - by Region
- 5.3.1. North America
- 5.3.2. South America
- 5.3.3. Europe
- 5.3.4. Middle East & Africa
- 5.3.5. Asia Pacific
- 5.1. Market Analysis, Insights and Forecast - by Application
- 6. North America FRP Soft Stone Analysis, Insights and Forecast, 2020-2032
- 6.1. Market Analysis, Insights and Forecast - by Application
- 6.1.1. Residential
- 6.1.2. Commercial
- 6.2. Market Analysis, Insights and Forecast - by Types
- 6.2.1. Carbon Fiber Reinforced Polymer
- 6.2.2. Aramid Fiber Reinforced Polymer
- 6.2.3. Glass Reinforced Polymer
- 6.2.4. Others
- 6.1. Market Analysis, Insights and Forecast - by Application
- 7. South America FRP Soft Stone Analysis, Insights and Forecast, 2020-2032
- 7.1. Market Analysis, Insights and Forecast - by Application
- 7.1.1. Residential
- 7.1.2. Commercial
- 7.2. Market Analysis, Insights and Forecast - by Types
- 7.2.1. Carbon Fiber Reinforced Polymer
- 7.2.2. Aramid Fiber Reinforced Polymer
- 7.2.3. Glass Reinforced Polymer
- 7.2.4. Others
- 7.1. Market Analysis, Insights and Forecast - by Application
- 8. Europe FRP Soft Stone Analysis, Insights and Forecast, 2020-2032
- 8.1. Market Analysis, Insights and Forecast - by Application
- 8.1.1. Residential
- 8.1.2. Commercial
- 8.2. Market Analysis, Insights and Forecast - by Types
- 8.2.1. Carbon Fiber Reinforced Polymer
- 8.2.2. Aramid Fiber Reinforced Polymer
- 8.2.3. Glass Reinforced Polymer
- 8.2.4. Others
- 8.1. Market Analysis, Insights and Forecast - by Application
- 9. Middle East & Africa FRP Soft Stone Analysis, Insights and Forecast, 2020-2032
- 9.1. Market Analysis, Insights and Forecast - by Application
- 9.1.1. Residential
- 9.1.2. Commercial
- 9.2. Market Analysis, Insights and Forecast - by Types
- 9.2.1. Carbon Fiber Reinforced Polymer
- 9.2.2. Aramid Fiber Reinforced Polymer
- 9.2.3. Glass Reinforced Polymer
- 9.2.4. Others
- 9.1. Market Analysis, Insights and Forecast - by Application
- 10. Asia Pacific FRP Soft Stone Analysis, Insights and Forecast, 2020-2032
- 10.1. Market Analysis, Insights and Forecast - by Application
- 10.1.1. Residential
- 10.1.2. Commercial
- 10.2. Market Analysis, Insights and Forecast - by Types
- 10.2.1. Carbon Fiber Reinforced Polymer
- 10.2.2. Aramid Fiber Reinforced Polymer
- 10.2.3. Glass Reinforced Polymer
- 10.2.4. Others
- 10.1. Market Analysis, Insights and Forecast - by Application
- 11. Competitive Analysis
- 11.1. Global Market Share Analysis 2025
- 11.2. Company Profiles
- 11.2.1 REVONO
- 11.2.1.1. Overview
- 11.2.1.2. Products
- 11.2.1.3. SWOT Analysis
- 11.2.1.4. Recent Developments
- 11.2.1.5. Financials (Based on Availability)
- 11.2.2 MaterialSyi
- 11.2.2.1. Overview
- 11.2.2.2. Products
- 11.2.2.3. SWOT Analysis
- 11.2.2.4. Recent Developments
- 11.2.2.5. Financials (Based on Availability)
- 11.2.3 MATLAB Architechtural Materials
- 11.2.3.1. Overview
- 11.2.3.2. Products
- 11.2.3.3. SWOT Analysis
- 11.2.3.4. Recent Developments
- 11.2.3.5. Financials (Based on Availability)
- 11.2.4 Steps Material
- 11.2.4.1. Overview
- 11.2.4.2. Products
- 11.2.4.3. SWOT Analysis
- 11.2.4.4. Recent Developments
- 11.2.4.5. Financials (Based on Availability)
- 11.2.5 Fiberstone
- 11.2.5.1. Overview
- 11.2.5.2. Products
- 11.2.5.3. SWOT Analysis
- 11.2.5.4. Recent Developments
- 11.2.5.5. Financials (Based on Availability)
- 11.2.6 Huntsman Corporation
- 11.2.6.1. Overview
- 11.2.6.2. Products
- 11.2.6.3. SWOT Analysis
- 11.2.6.4. Recent Developments
- 11.2.6.5. Financials (Based on Availability)
- 11.2.7 Greenfiber
- 11.2.7.1. Overview
- 11.2.7.2. Products
- 11.2.7.3. SWOT Analysis
- 11.2.7.4. Recent Developments
- 11.2.7.5. Financials (Based on Availability)
- 11.2.8 Mondo Polymer Technologies
- 11.2.8.1. Overview
- 11.2.8.2. Products
- 11.2.8.3. SWOT Analysis
- 11.2.8.4. Recent Developments
- 11.2.8.5. Financials (Based on Availability)
- 11.2.9 Alstrong Enterprises India
- 11.2.9.1. Overview
- 11.2.9.2. Products
- 11.2.9.3. SWOT Analysis
- 11.2.9.4. Recent Developments
- 11.2.9.5. Financials (Based on Availability)
- 11.2.10 Strongwell Corporation
- 11.2.10.1. Overview
- 11.2.10.2. Products
- 11.2.10.3. SWOT Analysis
- 11.2.10.4. Recent Developments
- 11.2.10.5. Financials (Based on Availability)
- 11.2.11 Creative Composites Group
- 11.2.11.1. Overview
- 11.2.11.2. Products
- 11.2.11.3. SWOT Analysis
- 11.2.11.4. Recent Developments
- 11.2.11.5. Financials (Based on Availability)
- 11.2.12 Fiber-Tech Industries
- 11.2.12.1. Overview
- 11.2.12.2. Products
- 11.2.12.3. SWOT Analysis
- 11.2.12.4. Recent Developments
- 11.2.12.5. Financials (Based on Availability)
- 11.2.13 StonCor Group
- 11.2.13.1. Overview
- 11.2.13.2. Products
- 11.2.13.3. SWOT Analysis
- 11.2.13.4. Recent Developments
- 11.2.13.5. Financials (Based on Availability)
- 11.2.14 Tufcot Engineering Ltd
- 11.2.14.1. Overview
- 11.2.14.2. Products
- 11.2.14.3. SWOT Analysis
- 11.2.14.4. Recent Developments
- 11.2.14.5. Financials (Based on Availability)
- 11.2.15 FlexForm Technologies
- 11.2.15.1. Overview
- 11.2.15.2. Products
- 11.2.15.3. SWOT Analysis
- 11.2.15.4. Recent Developments
- 11.2.15.5. Financials (Based on Availability)
- 11.2.16 3AC Core Materials
- 11.2.16.1. Overview
- 11.2.16.2. Products
- 11.2.16.3. SWOT Analysis
- 11.2.16.4. Recent Developments
- 11.2.16.5. Financials (Based on Availability)
- 11.2.1 REVONO
List of Figures
- Figure 1: Global FRP Soft Stone Revenue Breakdown (million, %) by Region 2025 & 2033
- Figure 2: Global FRP Soft Stone Volume Breakdown (K, %) by Region 2025 & 2033
- Figure 3: North America FRP Soft Stone Revenue (million), by Application 2025 & 2033
- Figure 4: North America FRP Soft Stone Volume (K), by Application 2025 & 2033
- Figure 5: North America FRP Soft Stone Revenue Share (%), by Application 2025 & 2033
- Figure 6: North America FRP Soft Stone Volume Share (%), by Application 2025 & 2033
- Figure 7: North America FRP Soft Stone Revenue (million), by Types 2025 & 2033
- Figure 8: North America FRP Soft Stone Volume (K), by Types 2025 & 2033
- Figure 9: North America FRP Soft Stone Revenue Share (%), by Types 2025 & 2033
- Figure 10: North America FRP Soft Stone Volume Share (%), by Types 2025 & 2033
- Figure 11: North America FRP Soft Stone Revenue (million), by Country 2025 & 2033
- Figure 12: North America FRP Soft Stone Volume (K), by Country 2025 & 2033
- Figure 13: North America FRP Soft Stone Revenue Share (%), by Country 2025 & 2033
- Figure 14: North America FRP Soft Stone Volume Share (%), by Country 2025 & 2033
- Figure 15: South America FRP Soft Stone Revenue (million), by Application 2025 & 2033
- Figure 16: South America FRP Soft Stone Volume (K), by Application 2025 & 2033
- Figure 17: South America FRP Soft Stone Revenue Share (%), by Application 2025 & 2033
- Figure 18: South America FRP Soft Stone Volume Share (%), by Application 2025 & 2033
- Figure 19: South America FRP Soft Stone Revenue (million), by Types 2025 & 2033
- Figure 20: South America FRP Soft Stone Volume (K), by Types 2025 & 2033
- Figure 21: South America FRP Soft Stone Revenue Share (%), by Types 2025 & 2033
- Figure 22: South America FRP Soft Stone Volume Share (%), by Types 2025 & 2033
- Figure 23: South America FRP Soft Stone Revenue (million), by Country 2025 & 2033
- Figure 24: South America FRP Soft Stone Volume (K), by Country 2025 & 2033
- Figure 25: South America FRP Soft Stone Revenue Share (%), by Country 2025 & 2033
- Figure 26: South America FRP Soft Stone Volume Share (%), by Country 2025 & 2033
- Figure 27: Europe FRP Soft Stone Revenue (million), by Application 2025 & 2033
- Figure 28: Europe FRP Soft Stone Volume (K), by Application 2025 & 2033
- Figure 29: Europe FRP Soft Stone Revenue Share (%), by Application 2025 & 2033
- Figure 30: Europe FRP Soft Stone Volume Share (%), by Application 2025 & 2033
- Figure 31: Europe FRP Soft Stone Revenue (million), by Types 2025 & 2033
- Figure 32: Europe FRP Soft Stone Volume (K), by Types 2025 & 2033
- Figure 33: Europe FRP Soft Stone Revenue Share (%), by Types 2025 & 2033
- Figure 34: Europe FRP Soft Stone Volume Share (%), by Types 2025 & 2033
- Figure 35: Europe FRP Soft Stone Revenue (million), by Country 2025 & 2033
- Figure 36: Europe FRP Soft Stone Volume (K), by Country 2025 & 2033
- Figure 37: Europe FRP Soft Stone Revenue Share (%), by Country 2025 & 2033
- Figure 38: Europe FRP Soft Stone Volume Share (%), by Country 2025 & 2033
- Figure 39: Middle East & Africa FRP Soft Stone Revenue (million), by Application 2025 & 2033
- Figure 40: Middle East & Africa FRP Soft Stone Volume (K), by Application 2025 & 2033
- Figure 41: Middle East & Africa FRP Soft Stone Revenue Share (%), by Application 2025 & 2033
- Figure 42: Middle East & Africa FRP Soft Stone Volume Share (%), by Application 2025 & 2033
- Figure 43: Middle East & Africa FRP Soft Stone Revenue (million), by Types 2025 & 2033
- Figure 44: Middle East & Africa FRP Soft Stone Volume (K), by Types 2025 & 2033
- Figure 45: Middle East & Africa FRP Soft Stone Revenue Share (%), by Types 2025 & 2033
- Figure 46: Middle East & Africa FRP Soft Stone Volume Share (%), by Types 2025 & 2033
- Figure 47: Middle East & Africa FRP Soft Stone Revenue (million), by Country 2025 & 2033
- Figure 48: Middle East & Africa FRP Soft Stone Volume (K), by Country 2025 & 2033
- Figure 49: Middle East & Africa FRP Soft Stone Revenue Share (%), by Country 2025 & 2033
- Figure 50: Middle East & Africa FRP Soft Stone Volume Share (%), by Country 2025 & 2033
- Figure 51: Asia Pacific FRP Soft Stone Revenue (million), by Application 2025 & 2033
- Figure 52: Asia Pacific FRP Soft Stone Volume (K), by Application 2025 & 2033
- Figure 53: Asia Pacific FRP Soft Stone Revenue Share (%), by Application 2025 & 2033
- Figure 54: Asia Pacific FRP Soft Stone Volume Share (%), by Application 2025 & 2033
- Figure 55: Asia Pacific FRP Soft Stone Revenue (million), by Types 2025 & 2033
- Figure 56: Asia Pacific FRP Soft Stone Volume (K), by Types 2025 & 2033
- Figure 57: Asia Pacific FRP Soft Stone Revenue Share (%), by Types 2025 & 2033
- Figure 58: Asia Pacific FRP Soft Stone Volume Share (%), by Types 2025 & 2033
- Figure 59: Asia Pacific FRP Soft Stone Revenue (million), by Country 2025 & 2033
- Figure 60: Asia Pacific FRP Soft Stone Volume (K), by Country 2025 & 2033
- Figure 61: Asia Pacific FRP Soft Stone Revenue Share (%), by Country 2025 & 2033
- Figure 62: Asia Pacific FRP Soft Stone Volume Share (%), by Country 2025 & 2033
List of Tables
- Table 1: Global FRP Soft Stone Revenue million Forecast, by Application 2020 & 2033
- Table 2: Global FRP Soft Stone Volume K Forecast, by Application 2020 & 2033
- Table 3: Global FRP Soft Stone Revenue million Forecast, by Types 2020 & 2033
- Table 4: Global FRP Soft Stone Volume K Forecast, by Types 2020 & 2033
- Table 5: Global FRP Soft Stone Revenue million Forecast, by Region 2020 & 2033
- Table 6: Global FRP Soft Stone Volume K Forecast, by Region 2020 & 2033
- Table 7: Global FRP Soft Stone Revenue million Forecast, by Application 2020 & 2033
- Table 8: Global FRP Soft Stone Volume K Forecast, by Application 2020 & 2033
- Table 9: Global FRP Soft Stone Revenue million Forecast, by Types 2020 & 2033
- Table 10: Global FRP Soft Stone Volume K Forecast, by Types 2020 & 2033
- Table 11: Global FRP Soft Stone Revenue million Forecast, by Country 2020 & 2033
- Table 12: Global FRP Soft Stone Volume K Forecast, by Country 2020 & 2033
- Table 13: United States FRP Soft Stone Revenue (million) Forecast, by Application 2020 & 2033
- Table 14: United States FRP Soft Stone Volume (K) Forecast, by Application 2020 & 2033
- Table 15: Canada FRP Soft Stone Revenue (million) Forecast, by Application 2020 & 2033
- Table 16: Canada FRP Soft Stone Volume (K) Forecast, by Application 2020 & 2033
- Table 17: Mexico FRP Soft Stone Revenue (million) Forecast, by Application 2020 & 2033
- Table 18: Mexico FRP Soft Stone Volume (K) Forecast, by Application 2020 & 2033
- Table 19: Global FRP Soft Stone Revenue million Forecast, by Application 2020 & 2033
- Table 20: Global FRP Soft Stone Volume K Forecast, by Application 2020 & 2033
- Table 21: Global FRP Soft Stone Revenue million Forecast, by Types 2020 & 2033
- Table 22: Global FRP Soft Stone Volume K Forecast, by Types 2020 & 2033
- Table 23: Global FRP Soft Stone Revenue million Forecast, by Country 2020 & 2033
- Table 24: Global FRP Soft Stone Volume K Forecast, by Country 2020 & 2033
- Table 25: Brazil FRP Soft Stone Revenue (million) Forecast, by Application 2020 & 2033
- Table 26: Brazil FRP Soft Stone Volume (K) Forecast, by Application 2020 & 2033
- Table 27: Argentina FRP Soft Stone Revenue (million) Forecast, by Application 2020 & 2033
- Table 28: Argentina FRP Soft Stone Volume (K) Forecast, by Application 2020 & 2033
- Table 29: Rest of South America FRP Soft Stone Revenue (million) Forecast, by Application 2020 & 2033
- Table 30: Rest of South America FRP Soft Stone Volume (K) Forecast, by Application 2020 & 2033
- Table 31: Global FRP Soft Stone Revenue million Forecast, by Application 2020 & 2033
- Table 32: Global FRP Soft Stone Volume K Forecast, by Application 2020 & 2033
- Table 33: Global FRP Soft Stone Revenue million Forecast, by Types 2020 & 2033
- Table 34: Global FRP Soft Stone Volume K Forecast, by Types 2020 & 2033
- Table 35: Global FRP Soft Stone Revenue million Forecast, by Country 2020 & 2033
- Table 36: Global FRP Soft Stone Volume K Forecast, by Country 2020 & 2033
- Table 37: United Kingdom FRP Soft Stone Revenue (million) Forecast, by Application 2020 & 2033
- Table 38: United Kingdom FRP Soft Stone Volume (K) Forecast, by Application 2020 & 2033
- Table 39: Germany FRP Soft Stone Revenue (million) Forecast, by Application 2020 & 2033
- Table 40: Germany FRP Soft Stone Volume (K) Forecast, by Application 2020 & 2033
- Table 41: France FRP Soft Stone Revenue (million) Forecast, by Application 2020 & 2033
- Table 42: France FRP Soft Stone Volume (K) Forecast, by Application 2020 & 2033
- Table 43: Italy FRP Soft Stone Revenue (million) Forecast, by Application 2020 & 2033
- Table 44: Italy FRP Soft Stone Volume (K) Forecast, by Application 2020 & 2033
- Table 45: Spain FRP Soft Stone Revenue (million) Forecast, by Application 2020 & 2033
- Table 46: Spain FRP Soft Stone Volume (K) Forecast, by Application 2020 & 2033
- Table 47: Russia FRP Soft Stone Revenue (million) Forecast, by Application 2020 & 2033
- Table 48: Russia FRP Soft Stone Volume (K) Forecast, by Application 2020 & 2033
- Table 49: Benelux FRP Soft Stone Revenue (million) Forecast, by Application 2020 & 2033
- Table 50: Benelux FRP Soft Stone Volume (K) Forecast, by Application 2020 & 2033
- Table 51: Nordics FRP Soft Stone Revenue (million) Forecast, by Application 2020 & 2033
- Table 52: Nordics FRP Soft Stone Volume (K) Forecast, by Application 2020 & 2033
- Table 53: Rest of Europe FRP Soft Stone Revenue (million) Forecast, by Application 2020 & 2033
- Table 54: Rest of Europe FRP Soft Stone Volume (K) Forecast, by Application 2020 & 2033
- Table 55: Global FRP Soft Stone Revenue million Forecast, by Application 2020 & 2033
- Table 56: Global FRP Soft Stone Volume K Forecast, by Application 2020 & 2033
- Table 57: Global FRP Soft Stone Revenue million Forecast, by Types 2020 & 2033
- Table 58: Global FRP Soft Stone Volume K Forecast, by Types 2020 & 2033
- Table 59: Global FRP Soft Stone Revenue million Forecast, by Country 2020 & 2033
- Table 60: Global FRP Soft Stone Volume K Forecast, by Country 2020 & 2033
- Table 61: Turkey FRP Soft Stone Revenue (million) Forecast, by Application 2020 & 2033
- Table 62: Turkey FRP Soft Stone Volume (K) Forecast, by Application 2020 & 2033
- Table 63: Israel FRP Soft Stone Revenue (million) Forecast, by Application 2020 & 2033
- Table 64: Israel FRP Soft Stone Volume (K) Forecast, by Application 2020 & 2033
- Table 65: GCC FRP Soft Stone Revenue (million) Forecast, by Application 2020 & 2033
- Table 66: GCC FRP Soft Stone Volume (K) Forecast, by Application 2020 & 2033
- Table 67: North Africa FRP Soft Stone Revenue (million) Forecast, by Application 2020 & 2033
- Table 68: North Africa FRP Soft Stone Volume (K) Forecast, by Application 2020 & 2033
- Table 69: South Africa FRP Soft Stone Revenue (million) Forecast, by Application 2020 & 2033
- Table 70: South Africa FRP Soft Stone Volume (K) Forecast, by Application 2020 & 2033
- Table 71: Rest of Middle East & Africa FRP Soft Stone Revenue (million) Forecast, by Application 2020 & 2033
- Table 72: Rest of Middle East & Africa FRP Soft Stone Volume (K) Forecast, by Application 2020 & 2033
- Table 73: Global FRP Soft Stone Revenue million Forecast, by Application 2020 & 2033
- Table 74: Global FRP Soft Stone Volume K Forecast, by Application 2020 & 2033
- Table 75: Global FRP Soft Stone Revenue million Forecast, by Types 2020 & 2033
- Table 76: Global FRP Soft Stone Volume K Forecast, by Types 2020 & 2033
- Table 77: Global FRP Soft Stone Revenue million Forecast, by Country 2020 & 2033
- Table 78: Global FRP Soft Stone Volume K Forecast, by Country 2020 & 2033
- Table 79: China FRP Soft Stone Revenue (million) Forecast, by Application 2020 & 2033
- Table 80: China FRP Soft Stone Volume (K) Forecast, by Application 2020 & 2033
- Table 81: India FRP Soft Stone Revenue (million) Forecast, by Application 2020 & 2033
- Table 82: India FRP Soft Stone Volume (K) Forecast, by Application 2020 & 2033
- Table 83: Japan FRP Soft Stone Revenue (million) Forecast, by Application 2020 & 2033
- Table 84: Japan FRP Soft Stone Volume (K) Forecast, by Application 2020 & 2033
- Table 85: South Korea FRP Soft Stone Revenue (million) Forecast, by Application 2020 & 2033
- Table 86: South Korea FRP Soft Stone Volume (K) Forecast, by Application 2020 & 2033
- Table 87: ASEAN FRP Soft Stone Revenue (million) Forecast, by Application 2020 & 2033
- Table 88: ASEAN FRP Soft Stone Volume (K) Forecast, by Application 2020 & 2033
- Table 89: Oceania FRP Soft Stone Revenue (million) Forecast, by Application 2020 & 2033
- Table 90: Oceania FRP Soft Stone Volume (K) Forecast, by Application 2020 & 2033
- Table 91: Rest of Asia Pacific FRP Soft Stone Revenue (million) Forecast, by Application 2020 & 2033
- Table 92: Rest of Asia Pacific FRP Soft Stone Volume (K) Forecast, by Application 2020 & 2033
Frequently Asked Questions
1. What is the projected Compound Annual Growth Rate (CAGR) of the FRP Soft Stone?
The projected CAGR is approximately 6%.
2. Which companies are prominent players in the FRP Soft Stone?
Key companies in the market include REVONO, MaterialSyi, MATLAB Architechtural Materials, Steps Material, Fiberstone, Huntsman Corporation, Greenfiber, Mondo Polymer Technologies, Alstrong Enterprises India, Strongwell Corporation, Creative Composites Group, Fiber-Tech Industries, StonCor Group, Tufcot Engineering Ltd, FlexForm Technologies, 3AC Core Materials.
3. What are the main segments of the FRP Soft Stone?
The market segments include Application, Types.
4. Can you provide details about the market size?
The market size is estimated to be USD 1096 million as of 2022.
5. What are some drivers contributing to market growth?
N/A
6. What are the notable trends driving market growth?
N/A
7. Are there any restraints impacting market growth?
N/A
8. Can you provide examples of recent developments in the market?
N/A
9. What pricing options are available for accessing the report?
Pricing options include single-user, multi-user, and enterprise licenses priced at USD 3950.00, USD 5925.00, and USD 7900.00 respectively.
10. Is the market size provided in terms of value or volume?
The market size is provided in terms of value, measured in million and volume, measured in K.
11. Are there any specific market keywords associated with the report?
Yes, the market keyword associated with the report is "FRP Soft Stone," which aids in identifying and referencing the specific market segment covered.
12. How do I determine which pricing option suits my needs best?
The pricing options vary based on user requirements and access needs. Individual users may opt for single-user licenses, while businesses requiring broader access may choose multi-user or enterprise licenses for cost-effective access to the report.
13. Are there any additional resources or data provided in the FRP Soft Stone report?
While the report offers comprehensive insights, it's advisable to review the specific contents or supplementary materials provided to ascertain if additional resources or data are available.
14. How can I stay updated on further developments or reports in the FRP Soft Stone?
To stay informed about further developments, trends, and reports in the FRP Soft Stone, consider subscribing to industry newsletters, following relevant companies and organizations, or regularly checking reputable industry news sources and publications.
Methodology
Step 1 - Identification of Relevant Samples Size from Population Database


Step 2 - Approaches for Defining Global Market Size (Value, Volume* & Price*)

Note*: In applicable scenarios
Step 3 - Data Sources
Primary Research
- Web Analytics
- Survey Reports
- Research Institute
- Latest Research Reports
- Opinion Leaders
Secondary Research
- Annual Reports
- White Paper
- Latest Press Release
- Industry Association
- Paid Database
- Investor Presentations

Step 4 - Data Triangulation
Involves using different sources of information in order to increase the validity of a study
These sources are likely to be stakeholders in a program - participants, other researchers, program staff, other community members, and so on.
Then we put all data in single framework & apply various statistical tools to find out the dynamic on the market.
During the analysis stage, feedback from the stakeholder groups would be compared to determine areas of agreement as well as areas of divergence