

Key Insights
The global Ballistic Composites market is poised for significant expansion, projected to reach a substantial valuation in the coming years. Driven by an ever-increasing demand for lightweight yet robust protection solutions across defense, law enforcement, and automotive sectors, the market is witnessing robust growth with a Compound Annual Growth Rate (CAGR) exceeding 4.00%. This upward trajectory is fueled by the inherent advantages of ballistic composites, including their superior strength-to-weight ratio compared to traditional materials. The adoption of advanced fiber types such as Aramids and Ultra-high-molecular Weight Polyethylene (UHMWPE) is a key enabler, offering enhanced ballistic performance. Furthermore, the development of innovative polymer and polymer-ceramic matrix types is contributing to improved durability and impact resistance, making these composites indispensable for critical applications. The increasing focus on personnel safety in high-risk environments and the ongoing advancements in material science are expected to sustain this positive market momentum.
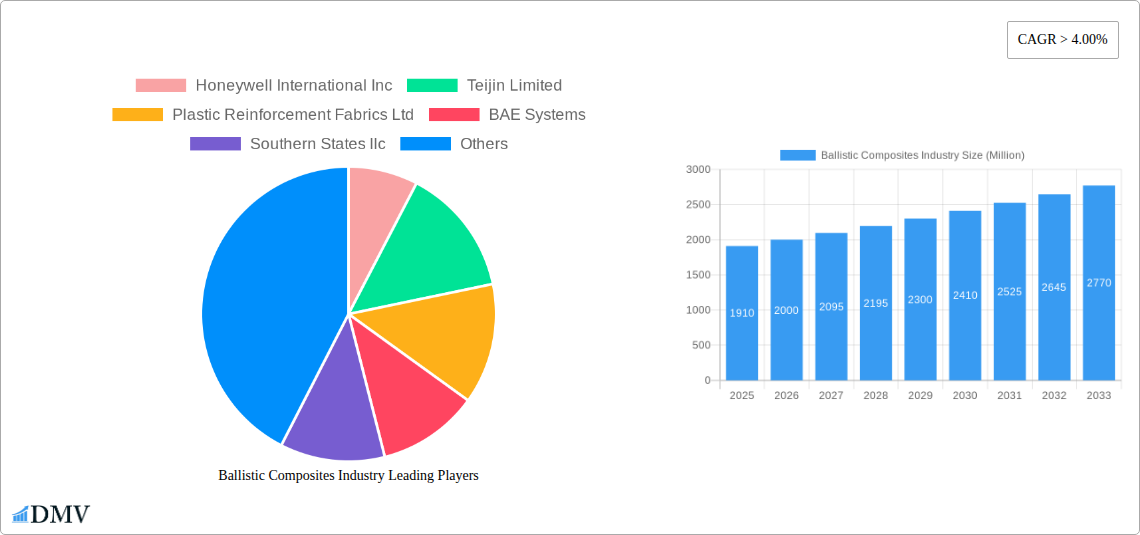
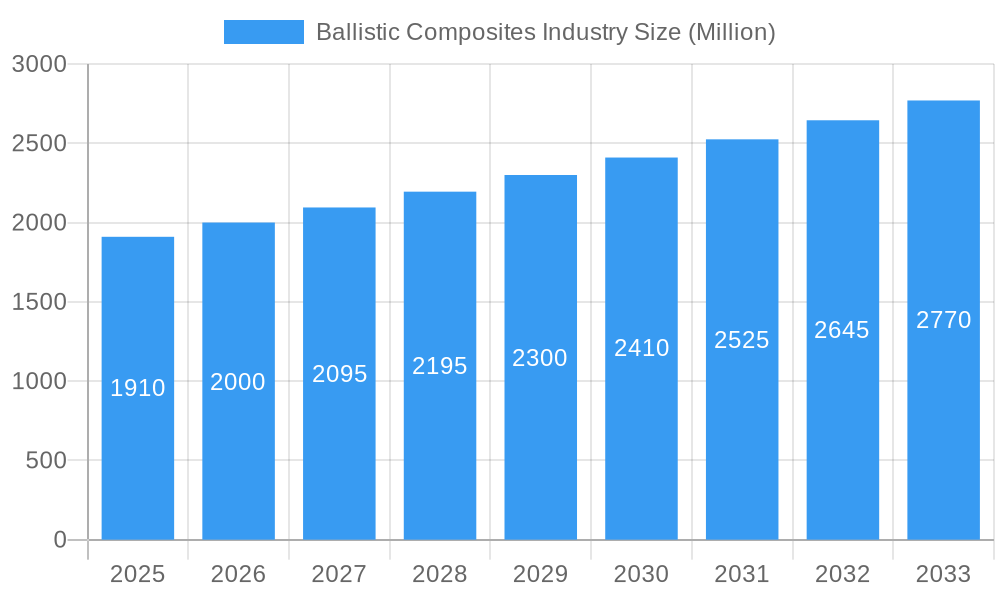
Ballistic Composites Industry Market Size (In Billion)
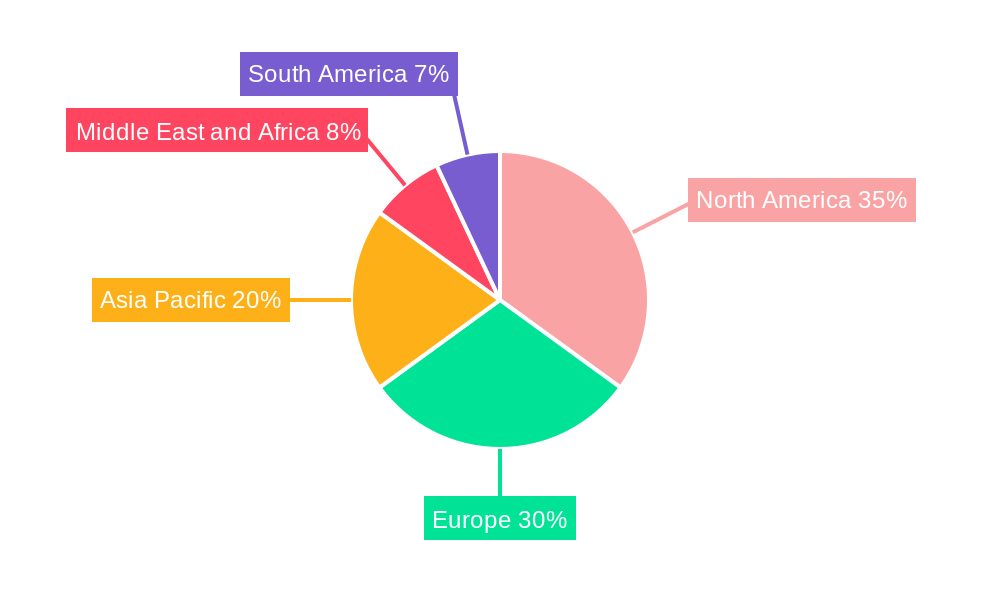
The market's growth is further propelled by critical applications such as vehicle armor, where the reduction in weight translates to improved fuel efficiency and maneuverability without compromising protection. Body armor and helmet and face protection segments are also experiencing substantial demand, driven by global security concerns and the need for advanced personal protective equipment for military and law enforcement personnel. Emerging applications in areas like civilian aviation and high-security infrastructure also represent untapped potential. Geographically, North America and Europe currently lead the market due to established defense industries and stringent safety regulations. However, the Asia Pacific region, particularly China and India, is emerging as a rapidly growing market, fueled by increasing defense expenditure and the adoption of advanced technologies. While the market is robust, potential restraints may include the high cost of raw materials and manufacturing processes, as well as the need for specialized expertise in production and application. Continuous innovation in material development and manufacturing techniques will be crucial for overcoming these challenges and unlocking the full potential of the ballistic composites industry.
Ballistic Composites Industry Company Market Share
Ballistic Composites Industry Market Composition & Trends
The global ballistic composites market, valued at an estimated 500 Million in the base year 2025 and projected to reach 1500 Million by 2033, is characterized by dynamic growth and evolving technological landscapes. The market exhibits moderate concentration, with key players like Honeywell International Inc., Teijin Limited, BAE Systems, and DuPont holding significant market share. Innovation is a primary catalyst, driven by the relentless demand for lighter, stronger, and more versatile protective solutions. Regulatory frameworks, particularly those concerning defense and security standards, play a crucial role in shaping market entry and product development. Substitute products, while present, often fall short of the performance metrics offered by advanced ballistic composites, especially in high-threat environments. End-user profiles are diverse, spanning military, law enforcement, and increasingly, civilian applications requiring enhanced personal safety. Mergers and acquisitions (M&A) are expected to shape the competitive landscape, with estimated M&A deal values in the range of 50 Million to 100 Million over the forecast period, as companies seek to consolidate market presence and acquire specialized technologies.
- Market Share Distribution: Leading companies are expected to collectively hold over 60% of the market by 2033.
- M&A Deal Values: An average of 2-3 significant M&A deals anticipated annually, with values ranging from 20 Million to 60 Million per transaction.
Ballistic Composites Industry Industry Evolution
The ballistic composites industry has undergone a remarkable transformation, evolving from rudimentary protective materials to sophisticated, engineered solutions. The historical period (2019-2024) saw steady growth, fueled by increased geopolitical instability and rising defense budgets worldwide. The base year, 2025, marks a pivotal point, with the market poised for accelerated expansion. The forecast period (2025-2033) is anticipated to witness a Compound Annual Growth Rate (CAGR) of approximately 10-12%. This robust growth is underpinned by continuous technological advancements. The development and widespread adoption of advanced fiber types like Ultra-high-molecular Weight Polyethylene (UHMWPE) and enhanced aramids have revolutionized performance, offering superior ballistic resistance at reduced weights. Matrix materials are also evolving, with the increasing integration of advanced polymers and ceramic reinforcements to create hybrid composites with exceptional energy absorption capabilities. Shifting consumer demands are evident not only in military and law enforcement sectors but also in the burgeoning market for civilian safety products. The emphasis is shifting from mere protection to enhanced mobility, comfort, and multi-functional capabilities. Adoption metrics for advanced ballistic composite materials in new vehicle designs and personal protective equipment (PPE) are projected to increase by over 25% within the next five years. The industry is moving towards more integrated and intelligent ballistic solutions, incorporating sensor technologies and self-healing properties, further driving innovation and market expansion. The proactive approach of manufacturers in addressing the need for lighter, more flexible, and effective armor systems will continue to shape this evolution, ensuring sustained market relevance and growth. The increasing investment in research and development by major players is a testament to the industry’s commitment to pushing the boundaries of material science and engineering in the realm of protection.
Leading Regions, Countries, or Segments in Ballistic Composites Industry
The global ballistic composites market is experiencing significant regional dominance, with North America emerging as the leading region, driven by robust governmental spending on defense and homeland security, coupled with a strong emphasis on technological innovation. The United States, in particular, spearheads this growth, supported by extensive research and development initiatives and the presence of major defense contractors. Within the broader market segments, Ultra-high-molecular Weight Polyethylene (UHMWPE) stands out as the most dominant fiber type. Its exceptional strength-to-weight ratio, flexibility, and resistance to moisture and chemicals make it the material of choice for a wide array of ballistic applications. The demand for UHMWPE is projected to grow at a CAGR of over 15% during the forecast period, significantly outpacing other fiber types.
In terms of matrix type, Polymer matrices continue to hold the largest market share due to their cost-effectiveness and versatility. However, Polymer-ceramic composites are gaining substantial traction, especially in applications requiring enhanced protection against high-velocity threats and fragment penetration, with their market share projected to expand by approximately 30% within the next decade.
The Vehicle Armor segment is the most significant application area, accounting for an estimated 40% of the total market value. This is attributed to the ongoing need to protect military vehicles, law enforcement cruisers, and armored personnel carriers from a wide range of threats. Following closely is the Body Armor segment, which is experiencing rapid growth due to advancements in lighter and more flexible ballistic vests, driven by the innovations seen in the November 2023 period. The Helmet and Face Protection segment also represents a critical and growing market.
Key drivers for regional dominance and segment growth include:
- Investment Trends: Significant defense procurement programs and ongoing R&D investments in North America and Europe.
- Regulatory Support: Stringent safety regulations and military standards mandating the use of high-performance ballistic materials.
- Technological Advancements: Continuous breakthroughs in material science leading to superior ballistic protection and reduced weight.
- End-User Demand: Increasing threat assessments leading to a higher demand for advanced personal and vehicle protection.
- Geopolitical Factors: Global security concerns and the need for advanced defense capabilities fueling market expansion.
Ballistic Composites Industry Product Innovations
Product innovation in the ballistic composites industry is rapidly transforming protective capabilities. Companies are developing next-generation materials that offer superior ballistic performance at significantly reduced weights. For instance, advancements in UHMWPE fiber technology are leading to lighter, more flexible body armor that enhances wearer mobility and comfort without compromising protection. Hybrid composite structures, combining advanced polymers with ceramics, are demonstrating remarkable effectiveness against a broader spectrum of threats. Integris Composites' recent launches exemplify this trend, introducing Rapid Don/Doff body armor vests that reduce donning and doffing time by 50% or more, a critical innovation for law enforcement and military units. Furthermore, customizable ballistic shields and vests, like those showcased at Milipol Paris, highlight a move towards user-centric design and adaptable protection solutions. These innovations directly address the evolving operational needs and performance demands of end-users.
Propelling Factors for Ballistic Composites Industry Growth
Several key factors are propelling the growth of the ballistic composites industry. Firstly, escalating geopolitical tensions and the persistent threat of terrorism worldwide are driving increased defense spending and a demand for advanced protection solutions. Secondly, continuous technological advancements in material science, particularly in the development of stronger, lighter, and more flexible composite materials like UHMWPE and advanced aramids, are expanding application possibilities and enhancing performance. Thirdly, stringent safety regulations and standards in military, law enforcement, and increasingly in civilian sectors mandate the use of high-performance ballistic protection. Finally, the growing emphasis on occupant safety in vehicles, from armored personnel carriers to civilian SUVs, is creating substantial demand for lightweight and effective ballistic composite solutions.
Obstacles in the Ballistic Composites Industry Market
Despite robust growth, the ballistic composites industry faces several obstacles. High research and development costs associated with creating advanced materials can limit market entry for smaller players. Stringent and evolving regulatory compliance, while a driver, also presents a significant hurdle requiring extensive testing and certification. Supply chain disruptions, particularly for specialized raw materials like advanced fibers, can impact production timelines and costs. Intense competition among established players and emerging innovators also exerts downward pressure on pricing. Furthermore, the initial cost of advanced ballistic composite solutions can be a barrier for some end-users, particularly in budget-constrained environments.
Future Opportunities in Ballistic Composites Industry
The future of the ballistic composites industry is rich with opportunity. The ongoing development of "smart" composites, incorporating sensors for threat detection or self-healing capabilities, represents a significant frontier. Expansion into new markets, such as enhanced protection for critical infrastructure and unmanned aerial vehicles (UAVs), presents substantial growth potential. The increasing demand for lightweight and comfortable personal protective equipment in non-military applications, like high-risk construction or security roles, offers a burgeoning segment. Furthermore, advancements in sustainable composite manufacturing and recycling processes could open new avenues and address environmental concerns, enhancing market appeal. The potential for integration with other advanced materials and technologies will also drive novel applications.
Major Players in the Ballistic Composites Industry Ecosystem
- Honeywell International Inc.
- Teijin Limited
- Plastic Reinforcement Fabrics Ltd
- BAE Systems
- Southern States llc
- Roihu Inc
- Barrday Inc
- TenCate Protective Fabrics
- MKU LIMITED
- Coherent Corp
- Integris
- Morgan Advanced Materials
- DSM
- DuPont
- Gaffco Ballistics
- Gurit Holding AG
- ArmorCore
Key Developments in Ballistic Composites Industry Industry
- November 2023: Integris Composites developed a new system of ballistic vest gear for law enforcement and military units, launching the company’s new Rapid Don/Doff body armor vests. This equipment dramatically reduces the time for donning and doffing one’s body armor rig—by 50% or more, significantly enhancing operational readiness.
- November 2023: Integris Composites launched customizable ballistic shields and vests, "Stand 5 F009", at Milipol Paris, showcasing a "make your own shield" concept, highlighting a growing trend towards user-centric and adaptable protective solutions in the market.
Strategic Ballistic Composites Industry Market Forecast
The strategic outlook for the ballistic composites industry remains highly positive, driven by ongoing innovation and persistent global security demands. The forecast period (2025–2033) is set to witness substantial market expansion, fueled by the continuous development of advanced materials like UHMWPE and hybrid polymer-ceramic composites. Key growth catalysts include increased defense and homeland security investments, coupled with a rising demand for lightweight, high-performance protective solutions in both military and law enforcement applications. Future opportunities lie in the development of "smart" composites, expansion into new application areas such as critical infrastructure protection and UAVs, and the growing civilian market for enhanced personal safety. Companies that focus on technological leadership, agile manufacturing, and understanding evolving end-user needs will be strategically positioned for success in this dynamic and critical industry.
Ballistic Composites Industry Segmentation
-
1. Fiber Type
- 1.1. Aramids
- 1.2. Ultra-high-molecular Weight Polyethylene (UHMWPE)
- 1.3. S-glass
- 1.4. Others F
-
2. Matrix Type
- 2.1. Polymer
- 2.2. Polymer-ceramic
- 2.3. Metal
-
3. Application
- 3.1. Vehicle Armor
- 3.2. Body Armor
- 3.3. Helmet and Face Protection
- 3.4. Other Ap
Ballistic Composites Industry Segmentation By Geography
-
1. Asia Pacific
- 1.1. China
- 1.2. India
- 1.3. Japan
- 1.4. South Korea
- 1.5. Rest of Asia Pacific
-
2. North America
- 2.1. United States
- 2.2. Canada
- 2.3. Mexico
-
3. Europe
- 3.1. Germany
- 3.2. United Kingdom
- 3.3. Italy
- 3.4. France
- 3.5. Spain
- 3.6. Rest of Europe
-
4. South America
- 4.1. Brazil
- 4.2. Argentina
- 4.3. Rest of South America
-
5. Middle East and Africa
- 5.1. Saudi Arabia
- 5.2. South Africa
- 5.3. Rest of Middle East and Africa
Ballistic Composites Industry Regional Market Share
Geographic Coverage of Ballistic Composites Industry
Ballistic Composites Industry REPORT HIGHLIGHTS
| Aspects | Details |
|---|---|
| Study Period | 2020-2034 |
| Base Year | 2025 |
| Estimated Year | 2026 |
| Forecast Period | 2026-2034 |
| Historical Period | 2020-2025 |
| Growth Rate | CAGR of > 4.00% from 2020-2034 |
| Segmentation |
|
Table of Contents
- 1. Introduction
- 1.1. Research Scope
- 1.2. Market Segmentation
- 1.3. Research Objective
- 1.4. Definitions and Assumptions
- 2. Executive Summary
- 2.1. Market Snapshot
- 3. Market Dynamics
- 3.1. Market Drivers
- 3.2. Market Restrains
- 3.3. Market Trends
- 3.4. Market Opportunities
- 4. Market Factor Analysis
- 4.1. Porters Five Forces
- 4.1.1. Bargaining Power of Suppliers
- 4.1.2. Bargaining Power of Buyers
- 4.1.3. Threat of New Entrants
- 4.1.4. Threat of Substitutes
- 4.1.5. Competitive Rivalry
- 4.2. PESTEL analysis
- 4.3. BCG Analysis
- 4.3.1. Stars (High Growth, High Market Share)
- 4.3.2. Cash Cows (Low Growth, High Market Share)
- 4.3.3. Question Mark (High Growth, Low Market Share)
- 4.3.4. Dogs (Low Growth, Low Market Share)
- 4.4. Ansoff Matrix Analysis
- 4.5. Supply Chain Analysis
- 4.6. Regulatory Landscape
- 4.7. Current Market Potential and Opportunity Assessment (TAM–SAM–SOM Framework)
- 4.8. DMV Analyst Note
- 4.1. Porters Five Forces
- 5. Market Analysis, Insights and Forecast 2021-2033
- 5.1. Market Analysis, Insights and Forecast - by Fiber Type
- 5.1.1. Aramids
- 5.1.2. Ultra-high-molecular Weight Polyethylene (UHMWPE)
- 5.1.3. S-glass
- 5.1.4. Others F
- 5.2. Market Analysis, Insights and Forecast - by Matrix Type
- 5.2.1. Polymer
- 5.2.2. Polymer-ceramic
- 5.2.3. Metal
- 5.3. Market Analysis, Insights and Forecast - by Application
- 5.3.1. Vehicle Armor
- 5.3.2. Body Armor
- 5.3.3. Helmet and Face Protection
- 5.3.4. Other Ap
- 5.4. Market Analysis, Insights and Forecast - by Region
- 5.4.1. Asia Pacific
- 5.4.2. North America
- 5.4.3. Europe
- 5.4.4. South America
- 5.4.5. Middle East and Africa
- 5.1. Market Analysis, Insights and Forecast - by Fiber Type
- 6. Global Ballistic Composites Industry Analysis, Insights and Forecast, 2021-2033
- 6.1. Market Analysis, Insights and Forecast - by Fiber Type
- 6.1.1. Aramids
- 6.1.2. Ultra-high-molecular Weight Polyethylene (UHMWPE)
- 6.1.3. S-glass
- 6.1.4. Others F
- 6.2. Market Analysis, Insights and Forecast - by Matrix Type
- 6.2.1. Polymer
- 6.2.2. Polymer-ceramic
- 6.2.3. Metal
- 6.3. Market Analysis, Insights and Forecast - by Application
- 6.3.1. Vehicle Armor
- 6.3.2. Body Armor
- 6.3.3. Helmet and Face Protection
- 6.3.4. Other Ap
- 6.1. Market Analysis, Insights and Forecast - by Fiber Type
- 7. Asia Pacific Ballistic Composites Industry Analysis, Insights and Forecast, 2020-2032
- 7.1. Market Analysis, Insights and Forecast - by Fiber Type
- 7.1.1. Aramids
- 7.1.2. Ultra-high-molecular Weight Polyethylene (UHMWPE)
- 7.1.3. S-glass
- 7.1.4. Others F
- 7.2. Market Analysis, Insights and Forecast - by Matrix Type
- 7.2.1. Polymer
- 7.2.2. Polymer-ceramic
- 7.2.3. Metal
- 7.3. Market Analysis, Insights and Forecast - by Application
- 7.3.1. Vehicle Armor
- 7.3.2. Body Armor
- 7.3.3. Helmet and Face Protection
- 7.3.4. Other Ap
- 7.1. Market Analysis, Insights and Forecast - by Fiber Type
- 8. North America Ballistic Composites Industry Analysis, Insights and Forecast, 2020-2032
- 8.1. Market Analysis, Insights and Forecast - by Fiber Type
- 8.1.1. Aramids
- 8.1.2. Ultra-high-molecular Weight Polyethylene (UHMWPE)
- 8.1.3. S-glass
- 8.1.4. Others F
- 8.2. Market Analysis, Insights and Forecast - by Matrix Type
- 8.2.1. Polymer
- 8.2.2. Polymer-ceramic
- 8.2.3. Metal
- 8.3. Market Analysis, Insights and Forecast - by Application
- 8.3.1. Vehicle Armor
- 8.3.2. Body Armor
- 8.3.3. Helmet and Face Protection
- 8.3.4. Other Ap
- 8.1. Market Analysis, Insights and Forecast - by Fiber Type
- 9. Europe Ballistic Composites Industry Analysis, Insights and Forecast, 2020-2032
- 9.1. Market Analysis, Insights and Forecast - by Fiber Type
- 9.1.1. Aramids
- 9.1.2. Ultra-high-molecular Weight Polyethylene (UHMWPE)
- 9.1.3. S-glass
- 9.1.4. Others F
- 9.2. Market Analysis, Insights and Forecast - by Matrix Type
- 9.2.1. Polymer
- 9.2.2. Polymer-ceramic
- 9.2.3. Metal
- 9.3. Market Analysis, Insights and Forecast - by Application
- 9.3.1. Vehicle Armor
- 9.3.2. Body Armor
- 9.3.3. Helmet and Face Protection
- 9.3.4. Other Ap
- 9.1. Market Analysis, Insights and Forecast - by Fiber Type
- 10. South America Ballistic Composites Industry Analysis, Insights and Forecast, 2020-2032
- 10.1. Market Analysis, Insights and Forecast - by Fiber Type
- 10.1.1. Aramids
- 10.1.2. Ultra-high-molecular Weight Polyethylene (UHMWPE)
- 10.1.3. S-glass
- 10.1.4. Others F
- 10.2. Market Analysis, Insights and Forecast - by Matrix Type
- 10.2.1. Polymer
- 10.2.2. Polymer-ceramic
- 10.2.3. Metal
- 10.3. Market Analysis, Insights and Forecast - by Application
- 10.3.1. Vehicle Armor
- 10.3.2. Body Armor
- 10.3.3. Helmet and Face Protection
- 10.3.4. Other Ap
- 10.1. Market Analysis, Insights and Forecast - by Fiber Type
- 11. Middle East and Africa Ballistic Composites Industry Analysis, Insights and Forecast, 2020-2032
- 11.1. Market Analysis, Insights and Forecast - by Fiber Type
- 11.1.1. Aramids
- 11.1.2. Ultra-high-molecular Weight Polyethylene (UHMWPE)
- 11.1.3. S-glass
- 11.1.4. Others F
- 11.2. Market Analysis, Insights and Forecast - by Matrix Type
- 11.2.1. Polymer
- 11.2.2. Polymer-ceramic
- 11.2.3. Metal
- 11.3. Market Analysis, Insights and Forecast - by Application
- 11.3.1. Vehicle Armor
- 11.3.2. Body Armor
- 11.3.3. Helmet and Face Protection
- 11.3.4. Other Ap
- 11.1. Market Analysis, Insights and Forecast - by Fiber Type
- 12. Competitive Analysis
- 12.1. Company Profiles
- 12.1.1 Honeywell International Inc
- 12.1.1.1. Company Overview
- 12.1.1.2. Products
- 12.1.1.3. Company Financials
- 12.1.1.4. SWOT Analysis
- 12.1.2 Teijin Limited
- 12.1.2.1. Company Overview
- 12.1.2.2. Products
- 12.1.2.3. Company Financials
- 12.1.2.4. SWOT Analysis
- 12.1.3 Plastic Reinforcement Fabrics Ltd
- 12.1.3.1. Company Overview
- 12.1.3.2. Products
- 12.1.3.3. Company Financials
- 12.1.3.4. SWOT Analysis
- 12.1.4 BAE Systems
- 12.1.4.1. Company Overview
- 12.1.4.2. Products
- 12.1.4.3. Company Financials
- 12.1.4.4. SWOT Analysis
- 12.1.5 Southern States llc
- 12.1.5.1. Company Overview
- 12.1.5.2. Products
- 12.1.5.3. Company Financials
- 12.1.5.4. SWOT Analysis
- 12.1.6 Roihu Inc
- 12.1.6.1. Company Overview
- 12.1.6.2. Products
- 12.1.6.3. Company Financials
- 12.1.6.4. SWOT Analysis
- 12.1.7 Barrday Inc
- 12.1.7.1. Company Overview
- 12.1.7.2. Products
- 12.1.7.3. Company Financials
- 12.1.7.4. SWOT Analysis
- 12.1.8 TenCate Protective Fabrics
- 12.1.8.1. Company Overview
- 12.1.8.2. Products
- 12.1.8.3. Company Financials
- 12.1.8.4. SWOT Analysis
- 12.1.9 MKU LIMITED
- 12.1.9.1. Company Overview
- 12.1.9.2. Products
- 12.1.9.3. Company Financials
- 12.1.9.4. SWOT Analysis
- 12.1.10 Coherent Corp
- 12.1.10.1. Company Overview
- 12.1.10.2. Products
- 12.1.10.3. Company Financials
- 12.1.10.4. SWOT Analysis
- 12.1.11 Integris
- 12.1.11.1. Company Overview
- 12.1.11.2. Products
- 12.1.11.3. Company Financials
- 12.1.11.4. SWOT Analysis
- 12.1.12 Morgan Advanced Materials
- 12.1.12.1. Company Overview
- 12.1.12.2. Products
- 12.1.12.3. Company Financials
- 12.1.12.4. SWOT Analysis
- 12.1.13 DSM
- 12.1.13.1. Company Overview
- 12.1.13.2. Products
- 12.1.13.3. Company Financials
- 12.1.13.4. SWOT Analysis
- 12.1.14 DuPont
- 12.1.14.1. Company Overview
- 12.1.14.2. Products
- 12.1.14.3. Company Financials
- 12.1.14.4. SWOT Analysis
- 12.1.15 Gaffco Ballistics
- 12.1.15.1. Company Overview
- 12.1.15.2. Products
- 12.1.15.3. Company Financials
- 12.1.15.4. SWOT Analysis
- 12.1.16 Gurit Holding AG
- 12.1.16.1. Company Overview
- 12.1.16.2. Products
- 12.1.16.3. Company Financials
- 12.1.16.4. SWOT Analysis
- 12.1.17 ArmorCore
- 12.1.17.1. Company Overview
- 12.1.17.2. Products
- 12.1.17.3. Company Financials
- 12.1.17.4. SWOT Analysis
- 12.1.1 Honeywell International Inc
- 12.2. Market Entropy
- 12.2.1 Company's Key Areas Served
- 12.2.2 Recent Developments
- 12.3. Company Market Share Analysis 2025
- 12.3.1 Top 5 Companies Market Share Analysis
- 12.3.2 Top 3 Companies Market Share Analysis
- 12.4. List of Potential Customers
- 13. Research Methodology
List of Figures
- Figure 1: Global Ballistic Composites Industry Revenue Breakdown (Million, %) by Region 2025 & 2033
- Figure 2: Global Ballistic Composites Industry Volume Breakdown (K Tons, %) by Region 2025 & 2033
- Figure 3: Asia Pacific Ballistic Composites Industry Revenue (Million), by Fiber Type 2025 & 2033
- Figure 4: Asia Pacific Ballistic Composites Industry Volume (K Tons), by Fiber Type 2025 & 2033
- Figure 5: Asia Pacific Ballistic Composites Industry Revenue Share (%), by Fiber Type 2025 & 2033
- Figure 6: Asia Pacific Ballistic Composites Industry Volume Share (%), by Fiber Type 2025 & 2033
- Figure 7: Asia Pacific Ballistic Composites Industry Revenue (Million), by Matrix Type 2025 & 2033
- Figure 8: Asia Pacific Ballistic Composites Industry Volume (K Tons), by Matrix Type 2025 & 2033
- Figure 9: Asia Pacific Ballistic Composites Industry Revenue Share (%), by Matrix Type 2025 & 2033
- Figure 10: Asia Pacific Ballistic Composites Industry Volume Share (%), by Matrix Type 2025 & 2033
- Figure 11: Asia Pacific Ballistic Composites Industry Revenue (Million), by Application 2025 & 2033
- Figure 12: Asia Pacific Ballistic Composites Industry Volume (K Tons), by Application 2025 & 2033
- Figure 13: Asia Pacific Ballistic Composites Industry Revenue Share (%), by Application 2025 & 2033
- Figure 14: Asia Pacific Ballistic Composites Industry Volume Share (%), by Application 2025 & 2033
- Figure 15: Asia Pacific Ballistic Composites Industry Revenue (Million), by Country 2025 & 2033
- Figure 16: Asia Pacific Ballistic Composites Industry Volume (K Tons), by Country 2025 & 2033
- Figure 17: Asia Pacific Ballistic Composites Industry Revenue Share (%), by Country 2025 & 2033
- Figure 18: Asia Pacific Ballistic Composites Industry Volume Share (%), by Country 2025 & 2033
- Figure 19: North America Ballistic Composites Industry Revenue (Million), by Fiber Type 2025 & 2033
- Figure 20: North America Ballistic Composites Industry Volume (K Tons), by Fiber Type 2025 & 2033
- Figure 21: North America Ballistic Composites Industry Revenue Share (%), by Fiber Type 2025 & 2033
- Figure 22: North America Ballistic Composites Industry Volume Share (%), by Fiber Type 2025 & 2033
- Figure 23: North America Ballistic Composites Industry Revenue (Million), by Matrix Type 2025 & 2033
- Figure 24: North America Ballistic Composites Industry Volume (K Tons), by Matrix Type 2025 & 2033
- Figure 25: North America Ballistic Composites Industry Revenue Share (%), by Matrix Type 2025 & 2033
- Figure 26: North America Ballistic Composites Industry Volume Share (%), by Matrix Type 2025 & 2033
- Figure 27: North America Ballistic Composites Industry Revenue (Million), by Application 2025 & 2033
- Figure 28: North America Ballistic Composites Industry Volume (K Tons), by Application 2025 & 2033
- Figure 29: North America Ballistic Composites Industry Revenue Share (%), by Application 2025 & 2033
- Figure 30: North America Ballistic Composites Industry Volume Share (%), by Application 2025 & 2033
- Figure 31: North America Ballistic Composites Industry Revenue (Million), by Country 2025 & 2033
- Figure 32: North America Ballistic Composites Industry Volume (K Tons), by Country 2025 & 2033
- Figure 33: North America Ballistic Composites Industry Revenue Share (%), by Country 2025 & 2033
- Figure 34: North America Ballistic Composites Industry Volume Share (%), by Country 2025 & 2033
- Figure 35: Europe Ballistic Composites Industry Revenue (Million), by Fiber Type 2025 & 2033
- Figure 36: Europe Ballistic Composites Industry Volume (K Tons), by Fiber Type 2025 & 2033
- Figure 37: Europe Ballistic Composites Industry Revenue Share (%), by Fiber Type 2025 & 2033
- Figure 38: Europe Ballistic Composites Industry Volume Share (%), by Fiber Type 2025 & 2033
- Figure 39: Europe Ballistic Composites Industry Revenue (Million), by Matrix Type 2025 & 2033
- Figure 40: Europe Ballistic Composites Industry Volume (K Tons), by Matrix Type 2025 & 2033
- Figure 41: Europe Ballistic Composites Industry Revenue Share (%), by Matrix Type 2025 & 2033
- Figure 42: Europe Ballistic Composites Industry Volume Share (%), by Matrix Type 2025 & 2033
- Figure 43: Europe Ballistic Composites Industry Revenue (Million), by Application 2025 & 2033
- Figure 44: Europe Ballistic Composites Industry Volume (K Tons), by Application 2025 & 2033
- Figure 45: Europe Ballistic Composites Industry Revenue Share (%), by Application 2025 & 2033
- Figure 46: Europe Ballistic Composites Industry Volume Share (%), by Application 2025 & 2033
- Figure 47: Europe Ballistic Composites Industry Revenue (Million), by Country 2025 & 2033
- Figure 48: Europe Ballistic Composites Industry Volume (K Tons), by Country 2025 & 2033
- Figure 49: Europe Ballistic Composites Industry Revenue Share (%), by Country 2025 & 2033
- Figure 50: Europe Ballistic Composites Industry Volume Share (%), by Country 2025 & 2033
- Figure 51: South America Ballistic Composites Industry Revenue (Million), by Fiber Type 2025 & 2033
- Figure 52: South America Ballistic Composites Industry Volume (K Tons), by Fiber Type 2025 & 2033
- Figure 53: South America Ballistic Composites Industry Revenue Share (%), by Fiber Type 2025 & 2033
- Figure 54: South America Ballistic Composites Industry Volume Share (%), by Fiber Type 2025 & 2033
- Figure 55: South America Ballistic Composites Industry Revenue (Million), by Matrix Type 2025 & 2033
- Figure 56: South America Ballistic Composites Industry Volume (K Tons), by Matrix Type 2025 & 2033
- Figure 57: South America Ballistic Composites Industry Revenue Share (%), by Matrix Type 2025 & 2033
- Figure 58: South America Ballistic Composites Industry Volume Share (%), by Matrix Type 2025 & 2033
- Figure 59: South America Ballistic Composites Industry Revenue (Million), by Application 2025 & 2033
- Figure 60: South America Ballistic Composites Industry Volume (K Tons), by Application 2025 & 2033
- Figure 61: South America Ballistic Composites Industry Revenue Share (%), by Application 2025 & 2033
- Figure 62: South America Ballistic Composites Industry Volume Share (%), by Application 2025 & 2033
- Figure 63: South America Ballistic Composites Industry Revenue (Million), by Country 2025 & 2033
- Figure 64: South America Ballistic Composites Industry Volume (K Tons), by Country 2025 & 2033
- Figure 65: South America Ballistic Composites Industry Revenue Share (%), by Country 2025 & 2033
- Figure 66: South America Ballistic Composites Industry Volume Share (%), by Country 2025 & 2033
- Figure 67: Middle East and Africa Ballistic Composites Industry Revenue (Million), by Fiber Type 2025 & 2033
- Figure 68: Middle East and Africa Ballistic Composites Industry Volume (K Tons), by Fiber Type 2025 & 2033
- Figure 69: Middle East and Africa Ballistic Composites Industry Revenue Share (%), by Fiber Type 2025 & 2033
- Figure 70: Middle East and Africa Ballistic Composites Industry Volume Share (%), by Fiber Type 2025 & 2033
- Figure 71: Middle East and Africa Ballistic Composites Industry Revenue (Million), by Matrix Type 2025 & 2033
- Figure 72: Middle East and Africa Ballistic Composites Industry Volume (K Tons), by Matrix Type 2025 & 2033
- Figure 73: Middle East and Africa Ballistic Composites Industry Revenue Share (%), by Matrix Type 2025 & 2033
- Figure 74: Middle East and Africa Ballistic Composites Industry Volume Share (%), by Matrix Type 2025 & 2033
- Figure 75: Middle East and Africa Ballistic Composites Industry Revenue (Million), by Application 2025 & 2033
- Figure 76: Middle East and Africa Ballistic Composites Industry Volume (K Tons), by Application 2025 & 2033
- Figure 77: Middle East and Africa Ballistic Composites Industry Revenue Share (%), by Application 2025 & 2033
- Figure 78: Middle East and Africa Ballistic Composites Industry Volume Share (%), by Application 2025 & 2033
- Figure 79: Middle East and Africa Ballistic Composites Industry Revenue (Million), by Country 2025 & 2033
- Figure 80: Middle East and Africa Ballistic Composites Industry Volume (K Tons), by Country 2025 & 2033
- Figure 81: Middle East and Africa Ballistic Composites Industry Revenue Share (%), by Country 2025 & 2033
- Figure 82: Middle East and Africa Ballistic Composites Industry Volume Share (%), by Country 2025 & 2033
List of Tables
- Table 1: Global Ballistic Composites Industry Revenue Million Forecast, by Fiber Type 2020 & 2033
- Table 2: Global Ballistic Composites Industry Volume K Tons Forecast, by Fiber Type 2020 & 2033
- Table 3: Global Ballistic Composites Industry Revenue Million Forecast, by Matrix Type 2020 & 2033
- Table 4: Global Ballistic Composites Industry Volume K Tons Forecast, by Matrix Type 2020 & 2033
- Table 5: Global Ballistic Composites Industry Revenue Million Forecast, by Application 2020 & 2033
- Table 6: Global Ballistic Composites Industry Volume K Tons Forecast, by Application 2020 & 2033
- Table 7: Global Ballistic Composites Industry Revenue Million Forecast, by Region 2020 & 2033
- Table 8: Global Ballistic Composites Industry Volume K Tons Forecast, by Region 2020 & 2033
- Table 9: Global Ballistic Composites Industry Revenue Million Forecast, by Fiber Type 2020 & 2033
- Table 10: Global Ballistic Composites Industry Volume K Tons Forecast, by Fiber Type 2020 & 2033
- Table 11: Global Ballistic Composites Industry Revenue Million Forecast, by Matrix Type 2020 & 2033
- Table 12: Global Ballistic Composites Industry Volume K Tons Forecast, by Matrix Type 2020 & 2033
- Table 13: Global Ballistic Composites Industry Revenue Million Forecast, by Application 2020 & 2033
- Table 14: Global Ballistic Composites Industry Volume K Tons Forecast, by Application 2020 & 2033
- Table 15: Global Ballistic Composites Industry Revenue Million Forecast, by Country 2020 & 2033
- Table 16: Global Ballistic Composites Industry Volume K Tons Forecast, by Country 2020 & 2033
- Table 17: China Ballistic Composites Industry Revenue (Million) Forecast, by Application 2020 & 2033
- Table 18: China Ballistic Composites Industry Volume (K Tons) Forecast, by Application 2020 & 2033
- Table 19: India Ballistic Composites Industry Revenue (Million) Forecast, by Application 2020 & 2033
- Table 20: India Ballistic Composites Industry Volume (K Tons) Forecast, by Application 2020 & 2033
- Table 21: Japan Ballistic Composites Industry Revenue (Million) Forecast, by Application 2020 & 2033
- Table 22: Japan Ballistic Composites Industry Volume (K Tons) Forecast, by Application 2020 & 2033
- Table 23: South Korea Ballistic Composites Industry Revenue (Million) Forecast, by Application 2020 & 2033
- Table 24: South Korea Ballistic Composites Industry Volume (K Tons) Forecast, by Application 2020 & 2033
- Table 25: Rest of Asia Pacific Ballistic Composites Industry Revenue (Million) Forecast, by Application 2020 & 2033
- Table 26: Rest of Asia Pacific Ballistic Composites Industry Volume (K Tons) Forecast, by Application 2020 & 2033
- Table 27: Global Ballistic Composites Industry Revenue Million Forecast, by Fiber Type 2020 & 2033
- Table 28: Global Ballistic Composites Industry Volume K Tons Forecast, by Fiber Type 2020 & 2033
- Table 29: Global Ballistic Composites Industry Revenue Million Forecast, by Matrix Type 2020 & 2033
- Table 30: Global Ballistic Composites Industry Volume K Tons Forecast, by Matrix Type 2020 & 2033
- Table 31: Global Ballistic Composites Industry Revenue Million Forecast, by Application 2020 & 2033
- Table 32: Global Ballistic Composites Industry Volume K Tons Forecast, by Application 2020 & 2033
- Table 33: Global Ballistic Composites Industry Revenue Million Forecast, by Country 2020 & 2033
- Table 34: Global Ballistic Composites Industry Volume K Tons Forecast, by Country 2020 & 2033
- Table 35: United States Ballistic Composites Industry Revenue (Million) Forecast, by Application 2020 & 2033
- Table 36: United States Ballistic Composites Industry Volume (K Tons) Forecast, by Application 2020 & 2033
- Table 37: Canada Ballistic Composites Industry Revenue (Million) Forecast, by Application 2020 & 2033
- Table 38: Canada Ballistic Composites Industry Volume (K Tons) Forecast, by Application 2020 & 2033
- Table 39: Mexico Ballistic Composites Industry Revenue (Million) Forecast, by Application 2020 & 2033
- Table 40: Mexico Ballistic Composites Industry Volume (K Tons) Forecast, by Application 2020 & 2033
- Table 41: Global Ballistic Composites Industry Revenue Million Forecast, by Fiber Type 2020 & 2033
- Table 42: Global Ballistic Composites Industry Volume K Tons Forecast, by Fiber Type 2020 & 2033
- Table 43: Global Ballistic Composites Industry Revenue Million Forecast, by Matrix Type 2020 & 2033
- Table 44: Global Ballistic Composites Industry Volume K Tons Forecast, by Matrix Type 2020 & 2033
- Table 45: Global Ballistic Composites Industry Revenue Million Forecast, by Application 2020 & 2033
- Table 46: Global Ballistic Composites Industry Volume K Tons Forecast, by Application 2020 & 2033
- Table 47: Global Ballistic Composites Industry Revenue Million Forecast, by Country 2020 & 2033
- Table 48: Global Ballistic Composites Industry Volume K Tons Forecast, by Country 2020 & 2033
- Table 49: Germany Ballistic Composites Industry Revenue (Million) Forecast, by Application 2020 & 2033
- Table 50: Germany Ballistic Composites Industry Volume (K Tons) Forecast, by Application 2020 & 2033
- Table 51: United Kingdom Ballistic Composites Industry Revenue (Million) Forecast, by Application 2020 & 2033
- Table 52: United Kingdom Ballistic Composites Industry Volume (K Tons) Forecast, by Application 2020 & 2033
- Table 53: Italy Ballistic Composites Industry Revenue (Million) Forecast, by Application 2020 & 2033
- Table 54: Italy Ballistic Composites Industry Volume (K Tons) Forecast, by Application 2020 & 2033
- Table 55: France Ballistic Composites Industry Revenue (Million) Forecast, by Application 2020 & 2033
- Table 56: France Ballistic Composites Industry Volume (K Tons) Forecast, by Application 2020 & 2033
- Table 57: Spain Ballistic Composites Industry Revenue (Million) Forecast, by Application 2020 & 2033
- Table 58: Spain Ballistic Composites Industry Volume (K Tons) Forecast, by Application 2020 & 2033
- Table 59: Rest of Europe Ballistic Composites Industry Revenue (Million) Forecast, by Application 2020 & 2033
- Table 60: Rest of Europe Ballistic Composites Industry Volume (K Tons) Forecast, by Application 2020 & 2033
- Table 61: Global Ballistic Composites Industry Revenue Million Forecast, by Fiber Type 2020 & 2033
- Table 62: Global Ballistic Composites Industry Volume K Tons Forecast, by Fiber Type 2020 & 2033
- Table 63: Global Ballistic Composites Industry Revenue Million Forecast, by Matrix Type 2020 & 2033
- Table 64: Global Ballistic Composites Industry Volume K Tons Forecast, by Matrix Type 2020 & 2033
- Table 65: Global Ballistic Composites Industry Revenue Million Forecast, by Application 2020 & 2033
- Table 66: Global Ballistic Composites Industry Volume K Tons Forecast, by Application 2020 & 2033
- Table 67: Global Ballistic Composites Industry Revenue Million Forecast, by Country 2020 & 2033
- Table 68: Global Ballistic Composites Industry Volume K Tons Forecast, by Country 2020 & 2033
- Table 69: Brazil Ballistic Composites Industry Revenue (Million) Forecast, by Application 2020 & 2033
- Table 70: Brazil Ballistic Composites Industry Volume (K Tons) Forecast, by Application 2020 & 2033
- Table 71: Argentina Ballistic Composites Industry Revenue (Million) Forecast, by Application 2020 & 2033
- Table 72: Argentina Ballistic Composites Industry Volume (K Tons) Forecast, by Application 2020 & 2033
- Table 73: Rest of South America Ballistic Composites Industry Revenue (Million) Forecast, by Application 2020 & 2033
- Table 74: Rest of South America Ballistic Composites Industry Volume (K Tons) Forecast, by Application 2020 & 2033
- Table 75: Global Ballistic Composites Industry Revenue Million Forecast, by Fiber Type 2020 & 2033
- Table 76: Global Ballistic Composites Industry Volume K Tons Forecast, by Fiber Type 2020 & 2033
- Table 77: Global Ballistic Composites Industry Revenue Million Forecast, by Matrix Type 2020 & 2033
- Table 78: Global Ballistic Composites Industry Volume K Tons Forecast, by Matrix Type 2020 & 2033
- Table 79: Global Ballistic Composites Industry Revenue Million Forecast, by Application 2020 & 2033
- Table 80: Global Ballistic Composites Industry Volume K Tons Forecast, by Application 2020 & 2033
- Table 81: Global Ballistic Composites Industry Revenue Million Forecast, by Country 2020 & 2033
- Table 82: Global Ballistic Composites Industry Volume K Tons Forecast, by Country 2020 & 2033
- Table 83: Saudi Arabia Ballistic Composites Industry Revenue (Million) Forecast, by Application 2020 & 2033
- Table 84: Saudi Arabia Ballistic Composites Industry Volume (K Tons) Forecast, by Application 2020 & 2033
- Table 85: South Africa Ballistic Composites Industry Revenue (Million) Forecast, by Application 2020 & 2033
- Table 86: South Africa Ballistic Composites Industry Volume (K Tons) Forecast, by Application 2020 & 2033
- Table 87: Rest of Middle East and Africa Ballistic Composites Industry Revenue (Million) Forecast, by Application 2020 & 2033
- Table 88: Rest of Middle East and Africa Ballistic Composites Industry Volume (K Tons) Forecast, by Application 2020 & 2033
Frequently Asked Questions
1. What is the projected Compound Annual Growth Rate (CAGR) of the Ballistic Composites Industry?
The projected CAGR is approximately > 4.00%.
2. Which companies are prominent players in the Ballistic Composites Industry?
Key companies in the market include Honeywell International Inc, Teijin Limited, Plastic Reinforcement Fabrics Ltd, BAE Systems, Southern States llc, Roihu Inc, Barrday Inc, TenCate Protective Fabrics, MKU LIMITED, Coherent Corp, Integris, Morgan Advanced Materials, DSM, DuPont, Gaffco Ballistics, Gurit Holding AG, ArmorCore.
3. What are the main segments of the Ballistic Composites Industry?
The market segments include Fiber Type, Matrix Type, Application.
4. Can you provide details about the market size?
The market size is estimated to be USD 1.91 Million as of 2022.
5. What are some drivers contributing to market growth?
Rise in Defense Expenditure; Increasing Demand for Lightweight Materials in the Aerospace and Defense Industry; Other Drivers.
6. What are the notable trends driving market growth?
Increasing Demand for Vehicle Armors.
7. Are there any restraints impacting market growth?
High Processing and Manufacturing Costs; Volatile Raw Material Supply.
8. Can you provide examples of recent developments in the market?
November 2023: Integris Composites developed a new system of ballistic vest gear for law enforcement and military units and launched the company’s new Rapid Don/Doff body armor vests. It is an equipment that dramatically reduces the time for donning and doffing one’s body armor rig—by 50% or more.
9. What pricing options are available for accessing the report?
Pricing options include single-user, multi-user, and enterprise licenses priced at USD 4750, USD 5250, and USD 8750 respectively.
10. Is the market size provided in terms of value or volume?
The market size is provided in terms of value, measured in Million and volume, measured in K Tons.
11. Are there any specific market keywords associated with the report?
Yes, the market keyword associated with the report is "Ballistic Composites Industry," which aids in identifying and referencing the specific market segment covered.
12. How do I determine which pricing option suits my needs best?
The pricing options vary based on user requirements and access needs. Individual users may opt for single-user licenses, while businesses requiring broader access may choose multi-user or enterprise licenses for cost-effective access to the report.
13. Are there any additional resources or data provided in the Ballistic Composites Industry report?
While the report offers comprehensive insights, it's advisable to review the specific contents or supplementary materials provided to ascertain if additional resources or data are available.
14. How can I stay updated on further developments or reports in the Ballistic Composites Industry?
To stay informed about further developments, trends, and reports in the Ballistic Composites Industry, consider subscribing to industry newsletters, following relevant companies and organizations, or regularly checking reputable industry news sources and publications.
Methodology
Step 1 - Identification of Relevant Samples Size from Population Database


Step 2 - Approaches for Defining Global Market Size (Value, Volume* & Price*)

Note*: In applicable scenarios
Step 3 - Data Sources
Primary Research
- Web Analytics
- Survey Reports
- Research Institute
- Latest Research Reports
- Opinion Leaders
Secondary Research
- Annual Reports
- White Paper
- Latest Press Release
- Industry Association
- Paid Database
- Investor Presentations

Step 4 - Data Triangulation
Involves using different sources of information in order to increase the validity of a study
These sources are likely to be stakeholders in a program - participants, other researchers, program staff, other community members, and so on.
Then we put all data in single framework & apply various statistical tools to find out the dynamic on the market.
During the analysis stage, feedback from the stakeholder groups would be compared to determine areas of agreement as well as areas of divergence