

Key Insights
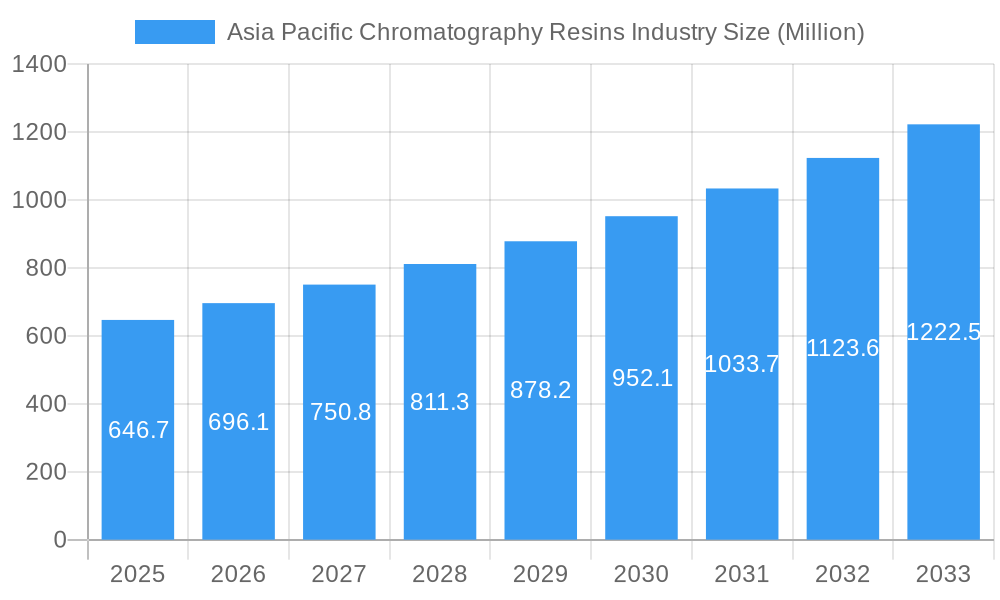
The Asia Pacific chromatography resins market, valued at $646.7 million in 2025, is projected to experience robust growth, driven by a Compound Annual Growth Rate (CAGR) exceeding 7.00% from 2025 to 2033. This expansion is fueled by several key factors. The burgeoning pharmaceutical industry in the region, particularly in countries like China, India, and Japan, is a significant driver, demanding high-quality chromatography resins for drug production and purification. Increased research and development activities in biotechnology and life sciences also contribute to market growth, as these sectors rely heavily on chromatography for analytical and purification processes. Furthermore, the growing food and beverage industry's focus on quality control and safety enhances demand for chromatography resins in testing and analysis. While the availability of synthetic alternatives like dextran-based resins presents a wide range of choices, the natural-based segment continues to hold a significant share, particularly in applications where specific purity and biocompatibility are crucial. Technological advancements in chromatography resin types, including ion exchange, affinity, size exclusion, and hydrophobic interaction resins, cater to diverse application needs, further stimulating market growth. However, potential restraints include fluctuations in raw material prices and stringent regulatory compliance requirements that need to be considered.
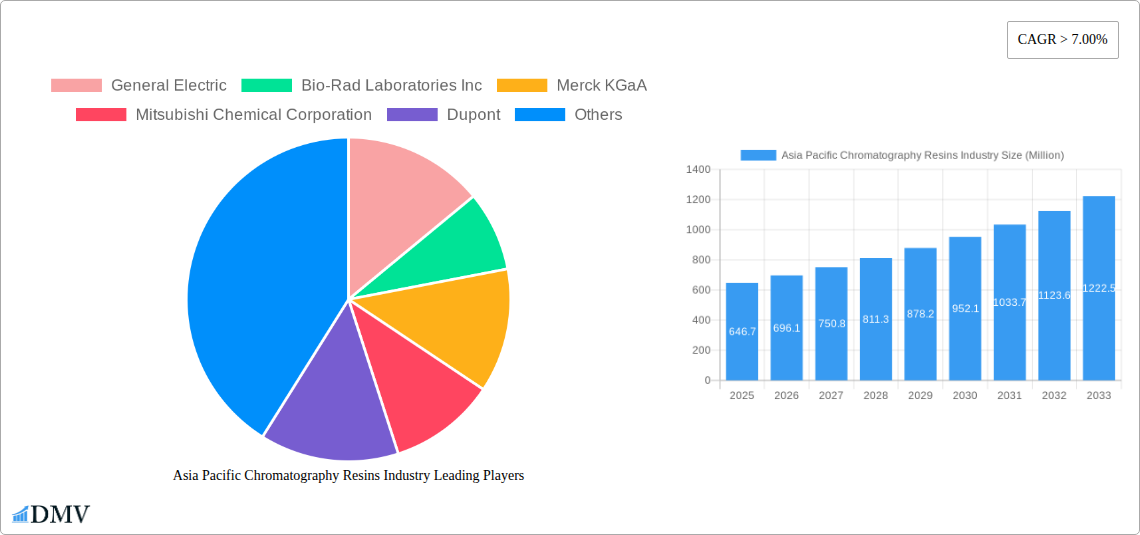
Asia Pacific Chromatography Resins Industry Market Size (In Million)
The market segmentation reveals a diverse landscape. The pharmaceutical sector dominates the end-user industry segment, driven by stringent purity requirements and the rising demand for innovative drug formulations. Within the origin segment, the natural-based resins maintain a sizable share due to inherent biocompatibility benefits, while synthetic-based resins, especially dextran-based ones, are seeing increasing adoption due to their customizable properties and potential cost-effectiveness. Technological advancements are evident in the diverse resin types offered. Ion exchange resins remain dominant due to their versatility, but other technologies, such as affinity chromatography, are showing remarkable growth thanks to their high specificity and efficiency. Within the Asia Pacific region, China, India, and Japan are major contributors to market growth, reflecting their substantial pharmaceutical and biotechnology sectors. The "Rest of Asia-Pacific" segment also offers significant untapped potential, suggesting further market expansion in emerging economies. The forecast period of 2025-2033 indicates a bright future for the Asia Pacific chromatography resins market.
Asia Pacific Chromatography Resins Industry Company Market Share
Asia Pacific Chromatography Resins Industry: Market Analysis & Forecast (2019-2033)
This comprehensive report provides an in-depth analysis of the Asia Pacific chromatography resins market, offering invaluable insights for stakeholders across the value chain. From market sizing and segmentation to future growth projections, this study unveils the intricate dynamics shaping this crucial industry. The report covers the period 2019-2033, with 2025 serving as the base and estimated year. The forecast period spans 2025-2033, while historical data encompasses 2019-2024. The market value is presented in Millions.
Asia Pacific Chromatography Resins Industry Market Composition & Trends
This section delves into the competitive landscape of the Asia Pacific chromatography resins market, analyzing market concentration, innovation drivers, regulatory influences, substitute product penetration, end-user profiles, and mergers & acquisitions (M&A) activity. We examine the market share distribution among key players including General Electric, Bio-Rad Laboratories Inc, Merck KGaA, Mitsubishi Chemical Corporation, DuPont, Pall Corporation, Tosoh Bioscience LLC, Purolite, Agilent Technologies, Avantor Inc, and Thermo Fisher Scientific (list not exhaustive). The report assesses the impact of M&A activities, quantifying deal values where available (e.g., xx Million in disclosed transactions). Furthermore, we analyze the influence of regulatory frameworks on market growth and the emergence of substitute technologies. The analysis includes a detailed profiling of end-users across diverse sectors, revealing their specific needs and preferences. Market concentration is assessed through metrics such as the Herfindahl-Hirschman Index (HHI), providing a clear picture of the competitive intensity.
- Market Share Distribution: Detailed breakdown of market share held by leading companies.
- M&A Activity Analysis: Assessment of significant M&A deals and their impact on the market.
- Regulatory Landscape Analysis: Examination of key regulatory frameworks and their influence.
- Substitute Product Analysis: Evaluation of alternative technologies and their market penetration.
- End-User Profile: Detailed profiles of key end-users across various industries.
Asia Pacific Chromatography Resins Industry Industry Evolution
This section meticulously traces the evolution of the Asia Pacific chromatography resins market from 2019 to 2033. It provides a granular analysis of market growth trajectories, pinpointing key inflection points and drivers. Technological advancements, including innovations in resin types (ion exchange, affinity, size exclusion, hydrophobic interaction, and others) and their impact on market dynamics, are carefully examined. The analysis also incorporates the influence of shifting consumer demands, encompassing evolving application needs and preferences within different end-user sectors. Specific data points, such as compound annual growth rates (CAGR) and technology adoption metrics, are presented to illustrate market trends and future potential. For example, the CAGR for ion exchange chromatography resins might be projected at xx%, driven by growing demand from the pharmaceutical sector. Similarly, we analyze the growth of synthetic-based resins compared to natural-based resins, citing factors such as cost-effectiveness and performance advantages.
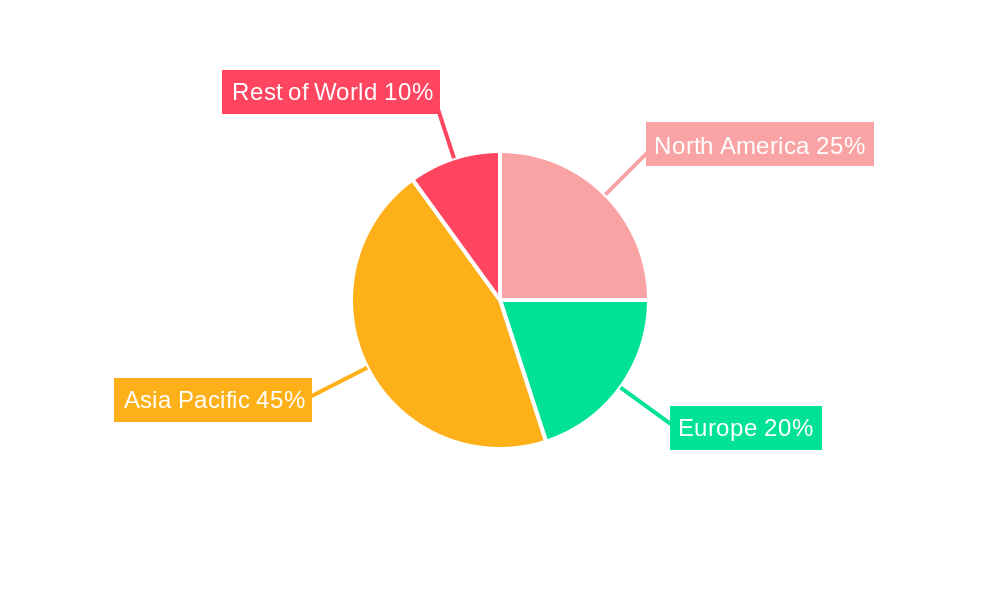
Leading Regions, Countries, or Segments in Asia Pacific Chromatography Resins Industry
This section identifies the dominant regions, countries, and segments within the Asia Pacific chromatography resins market. We analyze key drivers for growth in these leading areas, examining regional disparities in market maturity, technological adoption, regulatory landscape, and economic conditions. The analysis will consider each segment:
- End-user Industries: Pharmaceuticals, Drug Production, Water and Environmental Agencies, Food and Beverages, Other End-user Industries
- Origin: Natural-based, Dextran (Synthetic-based)
- Technology: Ion Exchange Chromatography Resins, Affinity Chromatography Resins, Size Exclusion Chromatography Resins, Hydrophobic Interaction Chromatography Resins, Other Technologies
Key drivers, such as investment trends and regulatory support, are highlighted using bullet points, while paragraphs provide a deeper analysis of the factors contributing to dominance. For example, China's rapid expansion in the pharmaceutical sector might be identified as a key driver for the growth of chromatography resins in the region. Japan's technological prowess might be cited as a factor in the dominance of a specific technology segment.
- Key Drivers (Examples):
- High pharmaceutical industry growth in China and India.
- Stringent environmental regulations driving demand for water purification resins.
- Growing adoption of advanced technologies in food and beverage processing.
- Governmental investments in R&D and infrastructure development.
Asia Pacific Chromatography Resins Industry Product Innovations
This section showcases recent product innovations within the Asia Pacific chromatography resins market. We discuss the introduction of new resin types, enhanced performance characteristics (e.g., increased selectivity, higher capacity, improved stability), and novel applications. Unique selling propositions (USPs) and technological advancements contributing to improved efficiency, cost-effectiveness, and sustainability are highlighted. Examples of specific product launches and their market impact will be provided.
Propelling Factors for Asia Pacific Chromatography Resins Industry Growth
This section pinpoints the key factors driving the growth of the Asia Pacific chromatography resins market. We consider technological advancements (e.g., the development of high-performance resins with improved selectivity and capacity), economic factors (e.g., increased investment in R&D and manufacturing), and regulatory influences (e.g., stringent environmental regulations). We use specific examples to illustrate the impact of each factor.
Obstacles in the Asia Pacific Chromatography Resins Industry Market
This section identifies barriers and restraints hindering market growth. We analyze regulatory challenges (e.g., complex approval processes), supply chain disruptions (e.g., raw material shortages), and competitive pressures (e.g., price competition). Quantifiable impacts of these challenges, where possible, are highlighted.
Future Opportunities in Asia Pacific Chromatography Resins Industry
This section explores emerging opportunities for growth in the Asia Pacific chromatography resins market. This includes the potential of new markets (e.g., emerging economies), innovative technologies (e.g., advanced resin materials and manufacturing processes), and evolving consumer trends (e.g., demand for sustainable and environmentally friendly products).
Major Players in the Asia Pacific Chromatography Resins Industry Ecosystem
Key Developments in Asia Pacific Chromatography Resins Industry Industry
This section provides a chronological list of key developments (e.g., product launches, mergers, regulatory changes) with their respective dates and impact on market dynamics.
Strategic Asia Pacific Chromatography Resins Industry Market Forecast
This section summarizes the key growth catalysts identified in the report and presents a concise forecast of future opportunities and market potential. We highlight the expected market size at the end of the forecast period (2033), and discuss potential scenarios based on various growth drivers and market uncertainties. The overall outlook for the Asia Pacific chromatography resins market is assessed, emphasizing both positive trends and potential challenges.
Asia Pacific Chromatography Resins Industry Segmentation
-
1. Origin
-
1.1. Natural-based
- 1.1.1. Agarose
- 1.1.2. Dextran
-
1.2. Synthetic-based
- 1.2.1. Silica Gel
- 1.2.2. Aluminum Oxide
- 1.2.3. Polystyrene
- 1.2.4. Other Synthetic-based Resins
-
1.1. Natural-based
-
2. Technology
- 2.1. Ion Exchange Chromatography Resins
- 2.2. Affinity Chromatography Resins
- 2.3. Size Exclusion Chromatography Resins
- 2.4. Hydrophobic Interaction Chromatography Resins
- 2.5. Other Technologies
-
3. End-user Industry
-
3.1. Pharmaceuticals
- 3.1.1. Biotechnology
- 3.1.2. Drug Discovery
- 3.1.3. Drug Production
- 3.2. Water and Environmental Agencies
- 3.3. Food and Beverages
- 3.4. Other End-user Industries
-
3.1. Pharmaceuticals
-
4. Geography
- 4.1. China
- 4.2. India
- 4.3. Japan
- 4.4. Rest of Asia-Pacific
Asia Pacific Chromatography Resins Industry Segmentation By Geography
- 1. China
- 2. India
- 3. Japan
- 4. Rest of Asia Pacific
Asia Pacific Chromatography Resins Industry Regional Market Share
Geographic Coverage of Asia Pacific Chromatography Resins Industry
Asia Pacific Chromatography Resins Industry REPORT HIGHLIGHTS
| Aspects | Details |
|---|---|
| Study Period | 2020-2034 |
| Base Year | 2025 |
| Estimated Year | 2026 |
| Forecast Period | 2026-2034 |
| Historical Period | 2020-2025 |
| Growth Rate | CAGR of > 7.00% from 2020-2034 |
| Segmentation |
|
Table of Contents
- 1. Introduction
- 1.1. Research Scope
- 1.2. Market Segmentation
- 1.3. Research Objective
- 1.4. Definitions and Assumptions
- 2. Executive Summary
- 2.1. Market Snapshot
- 3. Market Dynamics
- 3.1. Market Drivers
- 3.2. Market Restrains
- 3.3. Market Trends
- 3.4. Market Opportunities
- 4. Market Factor Analysis
- 4.1. Porters Five Forces
- 4.1.1. Bargaining Power of Suppliers
- 4.1.2. Bargaining Power of Buyers
- 4.1.3. Threat of New Entrants
- 4.1.4. Threat of Substitutes
- 4.1.5. Competitive Rivalry
- 4.2. PESTEL analysis
- 4.3. BCG Analysis
- 4.3.1. Stars (High Growth, High Market Share)
- 4.3.2. Cash Cows (Low Growth, High Market Share)
- 4.3.3. Question Mark (High Growth, Low Market Share)
- 4.3.4. Dogs (Low Growth, Low Market Share)
- 4.4. Ansoff Matrix Analysis
- 4.5. Supply Chain Analysis
- 4.6. Regulatory Landscape
- 4.7. Current Market Potential and Opportunity Assessment (TAM–SAM–SOM Framework)
- 4.8. DMV Analyst Note
- 4.1. Porters Five Forces
- 5. Market Analysis, Insights and Forecast 2021-2033
- 5.1. Market Analysis, Insights and Forecast - by Origin
- 5.1.1. Natural-based
- 5.1.1.1. Agarose
- 5.1.1.2. Dextran
- 5.1.2. Synthetic-based
- 5.1.2.1. Silica Gel
- 5.1.2.2. Aluminum Oxide
- 5.1.2.3. Polystyrene
- 5.1.2.4. Other Synthetic-based Resins
- 5.1.1. Natural-based
- 5.2. Market Analysis, Insights and Forecast - by Technology
- 5.2.1. Ion Exchange Chromatography Resins
- 5.2.2. Affinity Chromatography Resins
- 5.2.3. Size Exclusion Chromatography Resins
- 5.2.4. Hydrophobic Interaction Chromatography Resins
- 5.2.5. Other Technologies
- 5.3. Market Analysis, Insights and Forecast - by End-user Industry
- 5.3.1. Pharmaceuticals
- 5.3.1.1. Biotechnology
- 5.3.1.2. Drug Discovery
- 5.3.1.3. Drug Production
- 5.3.2. Water and Environmental Agencies
- 5.3.3. Food and Beverages
- 5.3.4. Other End-user Industries
- 5.3.1. Pharmaceuticals
- 5.4. Market Analysis, Insights and Forecast - by Geography
- 5.4.1. China
- 5.4.2. India
- 5.4.3. Japan
- 5.4.4. Rest of Asia-Pacific
- 5.5. Market Analysis, Insights and Forecast - by Region
- 5.5.1. China
- 5.5.2. India
- 5.5.3. Japan
- 5.5.4. Rest of Asia Pacific
- 5.1. Market Analysis, Insights and Forecast - by Origin
- 6. Asia Pacific Chromatography Resins Industry Analysis, Insights and Forecast, 2021-2033
- 6.1. Market Analysis, Insights and Forecast - by Origin
- 6.1.1. Natural-based
- 6.1.1.1. Agarose
- 6.1.1.2. Dextran
- 6.1.2. Synthetic-based
- 6.1.2.1. Silica Gel
- 6.1.2.2. Aluminum Oxide
- 6.1.2.3. Polystyrene
- 6.1.2.4. Other Synthetic-based Resins
- 6.1.1. Natural-based
- 6.2. Market Analysis, Insights and Forecast - by Technology
- 6.2.1. Ion Exchange Chromatography Resins
- 6.2.2. Affinity Chromatography Resins
- 6.2.3. Size Exclusion Chromatography Resins
- 6.2.4. Hydrophobic Interaction Chromatography Resins
- 6.2.5. Other Technologies
- 6.3. Market Analysis, Insights and Forecast - by End-user Industry
- 6.3.1. Pharmaceuticals
- 6.3.1.1. Biotechnology
- 6.3.1.2. Drug Discovery
- 6.3.1.3. Drug Production
- 6.3.2. Water and Environmental Agencies
- 6.3.3. Food and Beverages
- 6.3.4. Other End-user Industries
- 6.3.1. Pharmaceuticals
- 6.4. Market Analysis, Insights and Forecast - by Geography
- 6.4.1. China
- 6.4.2. India
- 6.4.3. Japan
- 6.4.4. Rest of Asia-Pacific
- 6.1. Market Analysis, Insights and Forecast - by Origin
- 7. China Asia Pacific Chromatography Resins Industry Analysis, Insights and Forecast, 2020-2032
- 7.1. Market Analysis, Insights and Forecast - by Origin
- 7.1.1. Natural-based
- 7.1.1.1. Agarose
- 7.1.1.2. Dextran
- 7.1.2. Synthetic-based
- 7.1.2.1. Silica Gel
- 7.1.2.2. Aluminum Oxide
- 7.1.2.3. Polystyrene
- 7.1.2.4. Other Synthetic-based Resins
- 7.1.1. Natural-based
- 7.2. Market Analysis, Insights and Forecast - by Technology
- 7.2.1. Ion Exchange Chromatography Resins
- 7.2.2. Affinity Chromatography Resins
- 7.2.3. Size Exclusion Chromatography Resins
- 7.2.4. Hydrophobic Interaction Chromatography Resins
- 7.2.5. Other Technologies
- 7.3. Market Analysis, Insights and Forecast - by End-user Industry
- 7.3.1. Pharmaceuticals
- 7.3.1.1. Biotechnology
- 7.3.1.2. Drug Discovery
- 7.3.1.3. Drug Production
- 7.3.2. Water and Environmental Agencies
- 7.3.3. Food and Beverages
- 7.3.4. Other End-user Industries
- 7.3.1. Pharmaceuticals
- 7.4. Market Analysis, Insights and Forecast - by Geography
- 7.4.1. China
- 7.4.2. India
- 7.4.3. Japan
- 7.4.4. Rest of Asia-Pacific
- 7.1. Market Analysis, Insights and Forecast - by Origin
- 8. India Asia Pacific Chromatography Resins Industry Analysis, Insights and Forecast, 2020-2032
- 8.1. Market Analysis, Insights and Forecast - by Origin
- 8.1.1. Natural-based
- 8.1.1.1. Agarose
- 8.1.1.2. Dextran
- 8.1.2. Synthetic-based
- 8.1.2.1. Silica Gel
- 8.1.2.2. Aluminum Oxide
- 8.1.2.3. Polystyrene
- 8.1.2.4. Other Synthetic-based Resins
- 8.1.1. Natural-based
- 8.2. Market Analysis, Insights and Forecast - by Technology
- 8.2.1. Ion Exchange Chromatography Resins
- 8.2.2. Affinity Chromatography Resins
- 8.2.3. Size Exclusion Chromatography Resins
- 8.2.4. Hydrophobic Interaction Chromatography Resins
- 8.2.5. Other Technologies
- 8.3. Market Analysis, Insights and Forecast - by End-user Industry
- 8.3.1. Pharmaceuticals
- 8.3.1.1. Biotechnology
- 8.3.1.2. Drug Discovery
- 8.3.1.3. Drug Production
- 8.3.2. Water and Environmental Agencies
- 8.3.3. Food and Beverages
- 8.3.4. Other End-user Industries
- 8.3.1. Pharmaceuticals
- 8.4. Market Analysis, Insights and Forecast - by Geography
- 8.4.1. China
- 8.4.2. India
- 8.4.3. Japan
- 8.4.4. Rest of Asia-Pacific
- 8.1. Market Analysis, Insights and Forecast - by Origin
- 9. Japan Asia Pacific Chromatography Resins Industry Analysis, Insights and Forecast, 2020-2032
- 9.1. Market Analysis, Insights and Forecast - by Origin
- 9.1.1. Natural-based
- 9.1.1.1. Agarose
- 9.1.1.2. Dextran
- 9.1.2. Synthetic-based
- 9.1.2.1. Silica Gel
- 9.1.2.2. Aluminum Oxide
- 9.1.2.3. Polystyrene
- 9.1.2.4. Other Synthetic-based Resins
- 9.1.1. Natural-based
- 9.2. Market Analysis, Insights and Forecast - by Technology
- 9.2.1. Ion Exchange Chromatography Resins
- 9.2.2. Affinity Chromatography Resins
- 9.2.3. Size Exclusion Chromatography Resins
- 9.2.4. Hydrophobic Interaction Chromatography Resins
- 9.2.5. Other Technologies
- 9.3. Market Analysis, Insights and Forecast - by End-user Industry
- 9.3.1. Pharmaceuticals
- 9.3.1.1. Biotechnology
- 9.3.1.2. Drug Discovery
- 9.3.1.3. Drug Production
- 9.3.2. Water and Environmental Agencies
- 9.3.3. Food and Beverages
- 9.3.4. Other End-user Industries
- 9.3.1. Pharmaceuticals
- 9.4. Market Analysis, Insights and Forecast - by Geography
- 9.4.1. China
- 9.4.2. India
- 9.4.3. Japan
- 9.4.4. Rest of Asia-Pacific
- 9.1. Market Analysis, Insights and Forecast - by Origin
- 10. Rest of Asia Pacific Asia Pacific Chromatography Resins Industry Analysis, Insights and Forecast, 2020-2032
- 10.1. Market Analysis, Insights and Forecast - by Origin
- 10.1.1. Natural-based
- 10.1.1.1. Agarose
- 10.1.1.2. Dextran
- 10.1.2. Synthetic-based
- 10.1.2.1. Silica Gel
- 10.1.2.2. Aluminum Oxide
- 10.1.2.3. Polystyrene
- 10.1.2.4. Other Synthetic-based Resins
- 10.1.1. Natural-based
- 10.2. Market Analysis, Insights and Forecast - by Technology
- 10.2.1. Ion Exchange Chromatography Resins
- 10.2.2. Affinity Chromatography Resins
- 10.2.3. Size Exclusion Chromatography Resins
- 10.2.4. Hydrophobic Interaction Chromatography Resins
- 10.2.5. Other Technologies
- 10.3. Market Analysis, Insights and Forecast - by End-user Industry
- 10.3.1. Pharmaceuticals
- 10.3.1.1. Biotechnology
- 10.3.1.2. Drug Discovery
- 10.3.1.3. Drug Production
- 10.3.2. Water and Environmental Agencies
- 10.3.3. Food and Beverages
- 10.3.4. Other End-user Industries
- 10.3.1. Pharmaceuticals
- 10.4. Market Analysis, Insights and Forecast - by Geography
- 10.4.1. China
- 10.4.2. India
- 10.4.3. Japan
- 10.4.4. Rest of Asia-Pacific
- 10.1. Market Analysis, Insights and Forecast - by Origin
- 11. Competitive Analysis
- 11.1. Company Profiles
- 11.1.1 General Electric
- 11.1.1.1. Company Overview
- 11.1.1.2. Products
- 11.1.1.3. Company Financials
- 11.1.1.4. SWOT Analysis
- 11.1.2 Bio-Rad Laboratories Inc
- 11.1.2.1. Company Overview
- 11.1.2.2. Products
- 11.1.2.3. Company Financials
- 11.1.2.4. SWOT Analysis
- 11.1.3 Merck KGaA
- 11.1.3.1. Company Overview
- 11.1.3.2. Products
- 11.1.3.3. Company Financials
- 11.1.3.4. SWOT Analysis
- 11.1.4 Mitsubishi Chemical Corporation
- 11.1.4.1. Company Overview
- 11.1.4.2. Products
- 11.1.4.3. Company Financials
- 11.1.4.4. SWOT Analysis
- 11.1.5 Dupont
- 11.1.5.1. Company Overview
- 11.1.5.2. Products
- 11.1.5.3. Company Financials
- 11.1.5.4. SWOT Analysis
- 11.1.6 Pall Corporation
- 11.1.6.1. Company Overview
- 11.1.6.2. Products
- 11.1.6.3. Company Financials
- 11.1.6.4. SWOT Analysis
- 11.1.7 Tosoh Bioscience LLC*List Not Exhaustive
- 11.1.7.1. Company Overview
- 11.1.7.2. Products
- 11.1.7.3. Company Financials
- 11.1.7.4. SWOT Analysis
- 11.1.8 Purolite
- 11.1.8.1. Company Overview
- 11.1.8.2. Products
- 11.1.8.3. Company Financials
- 11.1.8.4. SWOT Analysis
- 11.1.9 Agilient Technologies
- 11.1.9.1. Company Overview
- 11.1.9.2. Products
- 11.1.9.3. Company Financials
- 11.1.9.4. SWOT Analysis
- 11.1.10 Avantor Inc
- 11.1.10.1. Company Overview
- 11.1.10.2. Products
- 11.1.10.3. Company Financials
- 11.1.10.4. SWOT Analysis
- 11.1.11 Thermo Fisher Scientific
- 11.1.11.1. Company Overview
- 11.1.11.2. Products
- 11.1.11.3. Company Financials
- 11.1.11.4. SWOT Analysis
- 11.1.1 General Electric
- 11.2. Market Entropy
- 11.2.1 Company's Key Areas Served
- 11.2.2 Recent Developments
- 11.3. Company Market Share Analysis 2025
- 11.3.1 Top 5 Companies Market Share Analysis
- 11.3.2 Top 3 Companies Market Share Analysis
- 11.4. List of Potential Customers
- 12. Research Methodology
List of Figures
- Figure 1: Asia Pacific Chromatography Resins Industry Revenue Breakdown (Million, %) by Product 2025 & 2033
- Figure 2: Asia Pacific Chromatography Resins Industry Share (%) by Company 2025
List of Tables
- Table 1: Asia Pacific Chromatography Resins Industry Revenue Million Forecast, by Origin 2020 & 2033
- Table 2: Asia Pacific Chromatography Resins Industry Volume K Tons Forecast, by Origin 2020 & 2033
- Table 3: Asia Pacific Chromatography Resins Industry Revenue Million Forecast, by Technology 2020 & 2033
- Table 4: Asia Pacific Chromatography Resins Industry Volume K Tons Forecast, by Technology 2020 & 2033
- Table 5: Asia Pacific Chromatography Resins Industry Revenue Million Forecast, by End-user Industry 2020 & 2033
- Table 6: Asia Pacific Chromatography Resins Industry Volume K Tons Forecast, by End-user Industry 2020 & 2033
- Table 7: Asia Pacific Chromatography Resins Industry Revenue Million Forecast, by Geography 2020 & 2033
- Table 8: Asia Pacific Chromatography Resins Industry Volume K Tons Forecast, by Geography 2020 & 2033
- Table 9: Asia Pacific Chromatography Resins Industry Revenue Million Forecast, by Region 2020 & 2033
- Table 10: Asia Pacific Chromatography Resins Industry Volume K Tons Forecast, by Region 2020 & 2033
- Table 11: Asia Pacific Chromatography Resins Industry Revenue Million Forecast, by Origin 2020 & 2033
- Table 12: Asia Pacific Chromatography Resins Industry Volume K Tons Forecast, by Origin 2020 & 2033
- Table 13: Asia Pacific Chromatography Resins Industry Revenue Million Forecast, by Technology 2020 & 2033
- Table 14: Asia Pacific Chromatography Resins Industry Volume K Tons Forecast, by Technology 2020 & 2033
- Table 15: Asia Pacific Chromatography Resins Industry Revenue Million Forecast, by End-user Industry 2020 & 2033
- Table 16: Asia Pacific Chromatography Resins Industry Volume K Tons Forecast, by End-user Industry 2020 & 2033
- Table 17: Asia Pacific Chromatography Resins Industry Revenue Million Forecast, by Geography 2020 & 2033
- Table 18: Asia Pacific Chromatography Resins Industry Volume K Tons Forecast, by Geography 2020 & 2033
- Table 19: Asia Pacific Chromatography Resins Industry Revenue Million Forecast, by Country 2020 & 2033
- Table 20: Asia Pacific Chromatography Resins Industry Volume K Tons Forecast, by Country 2020 & 2033
- Table 21: Asia Pacific Chromatography Resins Industry Revenue Million Forecast, by Origin 2020 & 2033
- Table 22: Asia Pacific Chromatography Resins Industry Volume K Tons Forecast, by Origin 2020 & 2033
- Table 23: Asia Pacific Chromatography Resins Industry Revenue Million Forecast, by Technology 2020 & 2033
- Table 24: Asia Pacific Chromatography Resins Industry Volume K Tons Forecast, by Technology 2020 & 2033
- Table 25: Asia Pacific Chromatography Resins Industry Revenue Million Forecast, by End-user Industry 2020 & 2033
- Table 26: Asia Pacific Chromatography Resins Industry Volume K Tons Forecast, by End-user Industry 2020 & 2033
- Table 27: Asia Pacific Chromatography Resins Industry Revenue Million Forecast, by Geography 2020 & 2033
- Table 28: Asia Pacific Chromatography Resins Industry Volume K Tons Forecast, by Geography 2020 & 2033
- Table 29: Asia Pacific Chromatography Resins Industry Revenue Million Forecast, by Country 2020 & 2033
- Table 30: Asia Pacific Chromatography Resins Industry Volume K Tons Forecast, by Country 2020 & 2033
- Table 31: Asia Pacific Chromatography Resins Industry Revenue Million Forecast, by Origin 2020 & 2033
- Table 32: Asia Pacific Chromatography Resins Industry Volume K Tons Forecast, by Origin 2020 & 2033
- Table 33: Asia Pacific Chromatography Resins Industry Revenue Million Forecast, by Technology 2020 & 2033
- Table 34: Asia Pacific Chromatography Resins Industry Volume K Tons Forecast, by Technology 2020 & 2033
- Table 35: Asia Pacific Chromatography Resins Industry Revenue Million Forecast, by End-user Industry 2020 & 2033
- Table 36: Asia Pacific Chromatography Resins Industry Volume K Tons Forecast, by End-user Industry 2020 & 2033
- Table 37: Asia Pacific Chromatography Resins Industry Revenue Million Forecast, by Geography 2020 & 2033
- Table 38: Asia Pacific Chromatography Resins Industry Volume K Tons Forecast, by Geography 2020 & 2033
- Table 39: Asia Pacific Chromatography Resins Industry Revenue Million Forecast, by Country 2020 & 2033
- Table 40: Asia Pacific Chromatography Resins Industry Volume K Tons Forecast, by Country 2020 & 2033
- Table 41: Asia Pacific Chromatography Resins Industry Revenue Million Forecast, by Origin 2020 & 2033
- Table 42: Asia Pacific Chromatography Resins Industry Volume K Tons Forecast, by Origin 2020 & 2033
- Table 43: Asia Pacific Chromatography Resins Industry Revenue Million Forecast, by Technology 2020 & 2033
- Table 44: Asia Pacific Chromatography Resins Industry Volume K Tons Forecast, by Technology 2020 & 2033
- Table 45: Asia Pacific Chromatography Resins Industry Revenue Million Forecast, by End-user Industry 2020 & 2033
- Table 46: Asia Pacific Chromatography Resins Industry Volume K Tons Forecast, by End-user Industry 2020 & 2033
- Table 47: Asia Pacific Chromatography Resins Industry Revenue Million Forecast, by Geography 2020 & 2033
- Table 48: Asia Pacific Chromatography Resins Industry Volume K Tons Forecast, by Geography 2020 & 2033
- Table 49: Asia Pacific Chromatography Resins Industry Revenue Million Forecast, by Country 2020 & 2033
- Table 50: Asia Pacific Chromatography Resins Industry Volume K Tons Forecast, by Country 2020 & 2033
Frequently Asked Questions
1. What is the projected Compound Annual Growth Rate (CAGR) of the Asia Pacific Chromatography Resins Industry?
The projected CAGR is approximately > 7.00%.
2. Which companies are prominent players in the Asia Pacific Chromatography Resins Industry?
Key companies in the market include General Electric, Bio-Rad Laboratories Inc, Merck KGaA, Mitsubishi Chemical Corporation, Dupont, Pall Corporation, Tosoh Bioscience LLC*List Not Exhaustive, Purolite, Agilient Technologies, Avantor Inc, Thermo Fisher Scientific.
3. What are the main segments of the Asia Pacific Chromatography Resins Industry?
The market segments include Origin, Technology, End-user Industry, Geography.
4. Can you provide details about the market size?
The market size is estimated to be USD 646.7 Million as of 2022.
5. What are some drivers contributing to market growth?
; Rising Demand from the Pharmaceutical Sector; Technological Advancements in Chromatography Resins; Increasing Importance of Chromatography Tests in Drug Approvals.
6. What are the notable trends driving market growth?
Increasing Demand from Pharmaceutical Sector.
7. Are there any restraints impacting market growth?
; High Costs vs. Productivity of Chromatography Systems.
8. Can you provide examples of recent developments in the market?
N/A
9. What pricing options are available for accessing the report?
Pricing options include single-user, multi-user, and enterprise licenses priced at USD 4750, USD 5250, and USD 8750 respectively.
10. Is the market size provided in terms of value or volume?
The market size is provided in terms of value, measured in Million and volume, measured in K Tons.
11. Are there any specific market keywords associated with the report?
Yes, the market keyword associated with the report is "Asia Pacific Chromatography Resins Industry," which aids in identifying and referencing the specific market segment covered.
12. How do I determine which pricing option suits my needs best?
The pricing options vary based on user requirements and access needs. Individual users may opt for single-user licenses, while businesses requiring broader access may choose multi-user or enterprise licenses for cost-effective access to the report.
13. Are there any additional resources or data provided in the Asia Pacific Chromatography Resins Industry report?
While the report offers comprehensive insights, it's advisable to review the specific contents or supplementary materials provided to ascertain if additional resources or data are available.
14. How can I stay updated on further developments or reports in the Asia Pacific Chromatography Resins Industry?
To stay informed about further developments, trends, and reports in the Asia Pacific Chromatography Resins Industry, consider subscribing to industry newsletters, following relevant companies and organizations, or regularly checking reputable industry news sources and publications.
Methodology
Step 1 - Identification of Relevant Samples Size from Population Database


Step 2 - Approaches for Defining Global Market Size (Value, Volume* & Price*)

Note*: In applicable scenarios
Step 3 - Data Sources
Primary Research
- Web Analytics
- Survey Reports
- Research Institute
- Latest Research Reports
- Opinion Leaders
Secondary Research
- Annual Reports
- White Paper
- Latest Press Release
- Industry Association
- Paid Database
- Investor Presentations

Step 4 - Data Triangulation
Involves using different sources of information in order to increase the validity of a study
These sources are likely to be stakeholders in a program - participants, other researchers, program staff, other community members, and so on.
Then we put all data in single framework & apply various statistical tools to find out the dynamic on the market.
During the analysis stage, feedback from the stakeholder groups would be compared to determine areas of agreement as well as areas of divergence