

Key Insights
The Asia-Pacific (APAC) lubricants market is poised for significant expansion, fueled by the burgeoning automotive sector and robust industrialization across emerging economies. This growth is propelled by increasing demand for passenger and commercial vehicles, alongside the escalating need for machinery maintenance in developing industries. A key driver is the adoption of advanced lubricant technologies, emphasizing enhanced fuel efficiency, extended service intervals, and superior engine protection. This trend is contributing to market premiumization and higher average selling prices. Despite challenges such as volatile crude oil prices and evolving environmental regulations that encourage bio-based lubricants, the APAC lubricants market presents a promising outlook. We forecast a Compound Annual Growth Rate (CAGR) of approximately 4% from 2025 to 2033, with the market size projected to reach over $149,790 million by the base year 2025. Leading companies, including BP Plc (Castrol), ExxonMobil, and Shell, are strategically expanding their regional presence and product offerings. The market is segmented by lubricant type (engine oils, gear oils, greases), application (automotive, industrial), and geography, characterized by intense competition among multinational and regional players.
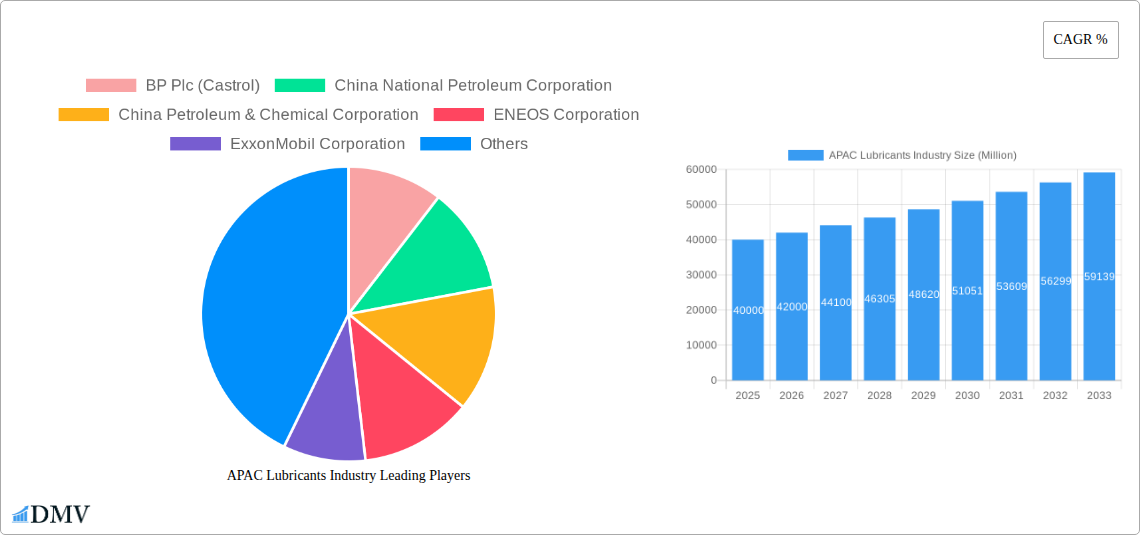
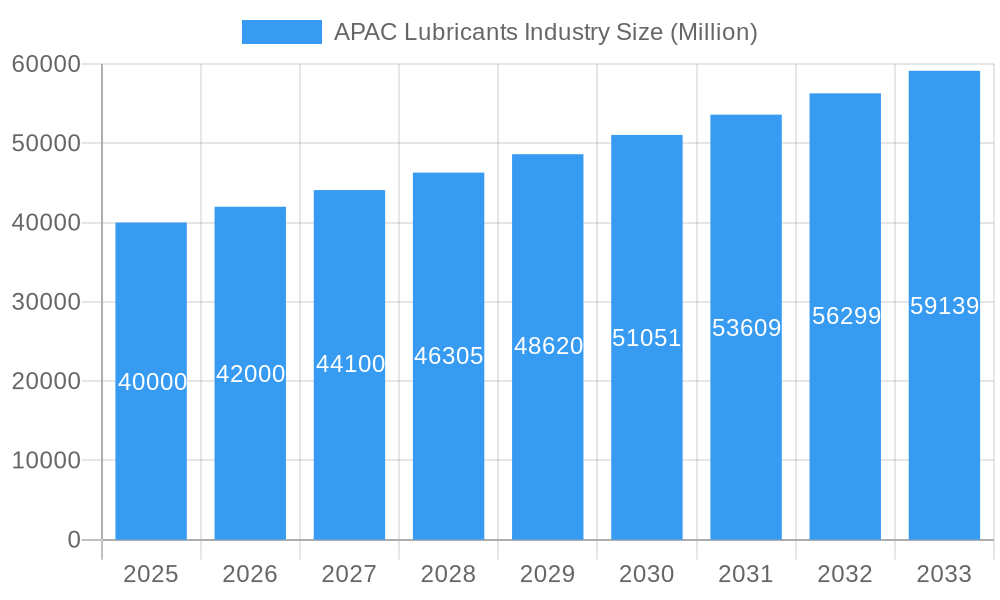
APAC Lubricants Industry Market Size (In Billion)
Ongoing infrastructure development, particularly in Southeast Asia, alongside government initiatives supporting industrial and economic growth, are creating substantial opportunities for lubricant manufacturers in APAC. However, fluctuations in raw material costs and a growing emphasis on sustainability present ongoing challenges. Companies are prioritizing research and development to create environmentally compliant lubricants that align with stringent regulatory standards and evolving consumer preferences. This commitment to sustainability is expected to significantly shape the future market landscape. While automotive lubricants are anticipated to maintain dominance, the industrial segment is expected to experience notable growth driven by manufacturing expansion and infrastructure projects. The increasing adoption of electric vehicles poses a long-term consideration, yet opportunities exist in developing specialized lubricants for hybrid and electric vehicle components.
APAC Lubricants Industry Company Market Share
APAC Lubricants Industry: A Comprehensive Market Analysis (2019-2033)
This insightful report provides a detailed analysis of the Asia-Pacific lubricants industry, offering a comprehensive overview of market dynamics, key players, and future growth prospects. Covering the period from 2019 to 2033, with a focus on the estimated year 2025, this report is an essential resource for stakeholders seeking to understand and capitalize on the opportunities within this dynamic sector. The report meticulously examines market trends, technological advancements, and regulatory changes impacting the industry, providing invaluable insights for strategic decision-making. With a market size predicted to reach xx Million by 2033, this report is indispensable for investors, industry professionals, and policymakers alike.
APAC Lubricants Industry Market Composition & Trends
This section delves into the intricate composition of the APAC lubricants market, analyzing its concentration, innovation drivers, regulatory environment, substitute products, end-user profiles, and mergers & acquisitions (M&A) activity. The report provides a granular understanding of the market share distribution among key players, revealing the competitive landscape and highlighting emerging trends. Significant M&A activities are examined, with detailed analysis of deal values and their impact on market dynamics.
Market Concentration: The APAC lubricants market exhibits a moderately concentrated structure, with a few major players holding significant market share. However, the presence of numerous smaller, regional players introduces competitive dynamism. The report quantifies this concentration using metrics such as the Herfindahl-Hirschman Index (HHI) and market share distribution among top 5 players (estimated at xx%).
Innovation Catalysts: Stringent emission regulations and the growing demand for fuel-efficient vehicles are driving innovation in lubricant technology. The focus is shifting towards energy-efficient, environmentally friendly lubricants, triggering significant R&D investments.
Regulatory Landscape: Varying regulatory frameworks across different APAC countries influence product formulations and environmental compliance. The report analyzes the impact of key regulations, including those related to emissions and waste disposal, on market growth and product development.
Substitute Products: The emergence of alternative technologies, such as electric vehicles, poses a potential threat to the conventional lubricants market. The report evaluates the market share of substitute products and their future impact on the industry.
End-User Profiles: The report segments end-users into various categories including automotive, industrial, and others, detailing their individual lubricant needs and consumption patterns. It also analyzes the influence of changing end-user demands on the industry’s evolution.
M&A Activities: The APAC lubricants industry has witnessed several significant M&A deals in recent years, driven by factors such as market consolidation and expansion strategies. The report analyzes the value of these deals and their impact on market competition, providing a detailed list of significant transactions with associated values in Millions.
APAC Lubricants Industry Industry Evolution
This section presents a comprehensive analysis of the evolution of the APAC lubricants industry, tracing its growth trajectory, technological advancements, and shifting consumer demands from 2019 to 2033. The report provides specific data points on growth rates and adoption metrics, illustrating market dynamics and predicting future trends. The impact of technological innovations, such as the development of bio-based lubricants and synthetic oils, on market growth and product differentiation is extensively discussed. The analysis also examines the evolving consumer preferences for eco-friendly and high-performance lubricants. The report projects a Compound Annual Growth Rate (CAGR) of xx% during the forecast period (2025-2033).
Leading Regions, Countries, or Segments in APAC Lubricants Industry
This section identifies the dominant regions, countries, and segments within the APAC lubricants market, providing a detailed analysis of the factors contributing to their dominance. Key drivers, including investment trends, regulatory support, and economic growth, are examined using bullet points.
Dominant Region: [Insert Dominant Region, e.g., China] accounts for the largest market share due to its robust automotive sector and industrial growth.
Key Drivers for Dominance:
- High automotive sales and manufacturing capacity.
- Significant investment in infrastructure development.
- Favorable government policies supporting industrial growth.
Country-level analysis: Further analysis will be provided on leading countries such as China, India, Japan, and South Korea, detailing their specific market dynamics and growth drivers. The report includes data on per capita lubricant consumption and market size for each country.
Dominant Segment: The [insert dominant segment e.g., automotive] segment holds the largest market share driven by factors such as rising vehicle ownership and increasing demand for high-performance lubricants.
APAC Lubricants Industry Product Innovations
The APAC lubricants industry is characterized by continuous product innovation, driven by the need for enhanced performance, improved fuel efficiency, and reduced environmental impact. This section highlights key product innovations, including the development of synthetic lubricants, bio-based lubricants, and specialized lubricants for specific applications. The report analyzes the unique selling propositions (USPs) of these new products and their impact on market competition. Advances in additive technology are also detailed, emphasizing their role in enhancing lubricant performance and extending equipment lifespan.
Propelling Factors for APAP Lubricants Industry Growth
Several factors are driving the growth of the APAP Lubricants Industry. These include:
Technological Advancements: The development of advanced lubricant formulations, such as synthetic oils and bio-based lubricants, is improving performance and reducing environmental impact.
Economic Growth: The strong economic growth in many APAC countries, particularly in China and India, fuels increased demand for lubricants across various sectors.
Regulatory Changes: Stringent emission regulations are driving the adoption of more energy-efficient lubricants, further boosting market growth. Specifically, the transition to stricter emission norms (e.g., BS6 in India) is increasing demand for low-sulfur lubricants.
Obstacles in the APAC Lubricants Industry Market
Despite the significant growth potential, the APAC lubricants industry faces several challenges:
Regulatory Challenges: The diverse and often evolving regulatory landscape across different APAC countries can create compliance complexities for lubricant manufacturers.
Supply Chain Disruptions: Global supply chain disruptions, particularly those experienced in recent years, can impact the availability of raw materials and affect lubricant production.
Competitive Pressures: The presence of numerous domestic and international players creates intense competition, putting pressure on pricing and profitability.
Future Opportunities in APAC Lubricants Industry
The APAC lubricants industry offers significant opportunities for growth in the coming years:
Expansion into New Markets: Untapped market potential exists in several emerging APAC countries, offering significant growth prospects for lubricant manufacturers.
Technological Advancements: Continuous innovation in lubricant technology, focusing on sustainability and improved performance, will create new market opportunities.
Growing Demand for Specialized Lubricants: The increasing demand for specialized lubricants in various niche applications offers further expansion potential for manufacturers.
Major Players in the APAC Lubricants Industry Ecosystem
- BP Plc (Castrol)
- China National Petroleum Corporation
- China Petroleum & Chemical Corporation (Sinopec)
- ENEOS Corporation
- ExxonMobil Corporation
- GS Caltex
- Idemitsu Kosan Co Ltd
- Indian Oil Corporation Limited
- Royal Dutch Shell Plc
- TotalEnergies
Key Developments in APAC Lubricants Industry Industry
- January 2022: ExxonMobil Corporation reorganized into three business lines: Upstream, Product Solutions, and Low Carbon Solutions, signaling a strategic shift towards sustainability.
- March 2022: ExxonMobil Corporation appointed Jay Hooley as lead managing director.
- May 2022: TotalEnergies and NEXUS Automotive extended their strategic partnership for five years, expanding TotalEnergies' presence in the N! community (sales growth from EUR 7.2 Billion in 2015 to nearly EUR 35 Billion by the end of 2021).
Strategic APAC Lubricants Industry Market Forecast
The APAC lubricants market is poised for robust growth in the coming years, driven by factors such as increasing industrialization, rising vehicle ownership, and stringent emission regulations. The development of advanced lubricant formulations, coupled with expansion into new markets, will further fuel market expansion. Significant opportunities exist for manufacturers who can adapt to evolving consumer preferences, embrace sustainable practices, and innovate to meet the diverse needs of the region. The market is projected to experience substantial growth, reaching xx Million by 2033, driven by strong economic growth and increasing demand for high-performance lubricants.
APAC Lubricants Industry Segmentation
-
1. End User
- 1.1. Automotive
- 1.2. Heavy Equipment
- 1.3. Metallurgy & Metalworking
- 1.4. Power Generation
- 1.5. Other End-user Industries
-
2. Product Type
- 2.1. Engine Oils
- 2.2. Greases
- 2.3. Hydraulic Fluids
- 2.4. Metalworking Fluids
- 2.5. Transmission & Gear Oils
- 2.6. Other Product Types
APAC Lubricants Industry Segmentation By Geography
-
1. North America
- 1.1. United States
- 1.2. Canada
- 1.3. Mexico
-
2. South America
- 2.1. Brazil
- 2.2. Argentina
- 2.3. Rest of South America
-
3. Europe
- 3.1. United Kingdom
- 3.2. Germany
- 3.3. France
- 3.4. Italy
- 3.5. Spain
- 3.6. Russia
- 3.7. Benelux
- 3.8. Nordics
- 3.9. Rest of Europe
-
4. Middle East & Africa
- 4.1. Turkey
- 4.2. Israel
- 4.3. GCC
- 4.4. North Africa
- 4.5. South Africa
- 4.6. Rest of Middle East & Africa
-
5. Asia Pacific
- 5.1. China
- 5.2. India
- 5.3. Japan
- 5.4. South Korea
- 5.5. ASEAN
- 5.6. Oceania
- 5.7. Rest of Asia Pacific
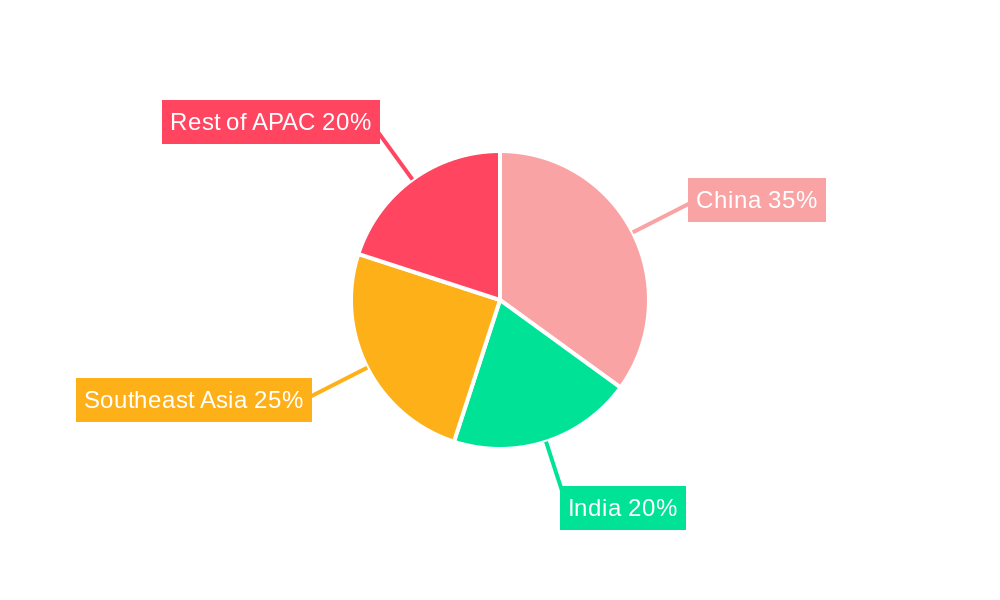
APAC Lubricants Industry Regional Market Share
Geographic Coverage of APAC Lubricants Industry
APAC Lubricants Industry REPORT HIGHLIGHTS
| Aspects | Details |
|---|---|
| Study Period | 2020-2034 |
| Base Year | 2025 |
| Estimated Year | 2026 |
| Forecast Period | 2026-2034 |
| Historical Period | 2020-2025 |
| Growth Rate | CAGR of 4% from 2020-2034 |
| Segmentation |
|
Table of Contents
- 1. Introduction
- 1.1. Research Scope
- 1.2. Market Segmentation
- 1.3. Research Methodology
- 1.4. Definitions and Assumptions
- 2. Executive Summary
- 2.1. Introduction
- 3. Market Dynamics
- 3.1. Introduction
- 3.2. Market Drivers
- 3.3. Market Restrains
- 3.4. Market Trends
- 3.4.1. Largest Segment By End User
- 4. Market Factor Analysis
- 4.1. Porters Five Forces
- 4.2. Supply/Value Chain
- 4.3. PESTEL analysis
- 4.4. Market Entropy
- 4.5. Patent/Trademark Analysis
- 5. Global APAC Lubricants Industry Analysis, Insights and Forecast, 2020-2032
- 5.1. Market Analysis, Insights and Forecast - by End User
- 5.1.1. Automotive
- 5.1.2. Heavy Equipment
- 5.1.3. Metallurgy & Metalworking
- 5.1.4. Power Generation
- 5.1.5. Other End-user Industries
- 5.2. Market Analysis, Insights and Forecast - by Product Type
- 5.2.1. Engine Oils
- 5.2.2. Greases
- 5.2.3. Hydraulic Fluids
- 5.2.4. Metalworking Fluids
- 5.2.5. Transmission & Gear Oils
- 5.2.6. Other Product Types
- 5.3. Market Analysis, Insights and Forecast - by Region
- 5.3.1. North America
- 5.3.2. South America
- 5.3.3. Europe
- 5.3.4. Middle East & Africa
- 5.3.5. Asia Pacific
- 5.1. Market Analysis, Insights and Forecast - by End User
- 6. North America APAC Lubricants Industry Analysis, Insights and Forecast, 2020-2032
- 6.1. Market Analysis, Insights and Forecast - by End User
- 6.1.1. Automotive
- 6.1.2. Heavy Equipment
- 6.1.3. Metallurgy & Metalworking
- 6.1.4. Power Generation
- 6.1.5. Other End-user Industries
- 6.2. Market Analysis, Insights and Forecast - by Product Type
- 6.2.1. Engine Oils
- 6.2.2. Greases
- 6.2.3. Hydraulic Fluids
- 6.2.4. Metalworking Fluids
- 6.2.5. Transmission & Gear Oils
- 6.2.6. Other Product Types
- 6.1. Market Analysis, Insights and Forecast - by End User
- 7. South America APAC Lubricants Industry Analysis, Insights and Forecast, 2020-2032
- 7.1. Market Analysis, Insights and Forecast - by End User
- 7.1.1. Automotive
- 7.1.2. Heavy Equipment
- 7.1.3. Metallurgy & Metalworking
- 7.1.4. Power Generation
- 7.1.5. Other End-user Industries
- 7.2. Market Analysis, Insights and Forecast - by Product Type
- 7.2.1. Engine Oils
- 7.2.2. Greases
- 7.2.3. Hydraulic Fluids
- 7.2.4. Metalworking Fluids
- 7.2.5. Transmission & Gear Oils
- 7.2.6. Other Product Types
- 7.1. Market Analysis, Insights and Forecast - by End User
- 8. Europe APAC Lubricants Industry Analysis, Insights and Forecast, 2020-2032
- 8.1. Market Analysis, Insights and Forecast - by End User
- 8.1.1. Automotive
- 8.1.2. Heavy Equipment
- 8.1.3. Metallurgy & Metalworking
- 8.1.4. Power Generation
- 8.1.5. Other End-user Industries
- 8.2. Market Analysis, Insights and Forecast - by Product Type
- 8.2.1. Engine Oils
- 8.2.2. Greases
- 8.2.3. Hydraulic Fluids
- 8.2.4. Metalworking Fluids
- 8.2.5. Transmission & Gear Oils
- 8.2.6. Other Product Types
- 8.1. Market Analysis, Insights and Forecast - by End User
- 9. Middle East & Africa APAC Lubricants Industry Analysis, Insights and Forecast, 2020-2032
- 9.1. Market Analysis, Insights and Forecast - by End User
- 9.1.1. Automotive
- 9.1.2. Heavy Equipment
- 9.1.3. Metallurgy & Metalworking
- 9.1.4. Power Generation
- 9.1.5. Other End-user Industries
- 9.2. Market Analysis, Insights and Forecast - by Product Type
- 9.2.1. Engine Oils
- 9.2.2. Greases
- 9.2.3. Hydraulic Fluids
- 9.2.4. Metalworking Fluids
- 9.2.5. Transmission & Gear Oils
- 9.2.6. Other Product Types
- 9.1. Market Analysis, Insights and Forecast - by End User
- 10. Asia Pacific APAC Lubricants Industry Analysis, Insights and Forecast, 2020-2032
- 10.1. Market Analysis, Insights and Forecast - by End User
- 10.1.1. Automotive
- 10.1.2. Heavy Equipment
- 10.1.3. Metallurgy & Metalworking
- 10.1.4. Power Generation
- 10.1.5. Other End-user Industries
- 10.2. Market Analysis, Insights and Forecast - by Product Type
- 10.2.1. Engine Oils
- 10.2.2. Greases
- 10.2.3. Hydraulic Fluids
- 10.2.4. Metalworking Fluids
- 10.2.5. Transmission & Gear Oils
- 10.2.6. Other Product Types
- 10.1. Market Analysis, Insights and Forecast - by End User
- 11. Competitive Analysis
- 11.1. Global Market Share Analysis 2025
- 11.2. Company Profiles
- 11.2.1 BP Plc (Castrol)
- 11.2.1.1. Overview
- 11.2.1.2. Products
- 11.2.1.3. SWOT Analysis
- 11.2.1.4. Recent Developments
- 11.2.1.5. Financials (Based on Availability)
- 11.2.2 China National Petroleum Corporation
- 11.2.2.1. Overview
- 11.2.2.2. Products
- 11.2.2.3. SWOT Analysis
- 11.2.2.4. Recent Developments
- 11.2.2.5. Financials (Based on Availability)
- 11.2.3 China Petroleum & Chemical Corporation
- 11.2.3.1. Overview
- 11.2.3.2. Products
- 11.2.3.3. SWOT Analysis
- 11.2.3.4. Recent Developments
- 11.2.3.5. Financials (Based on Availability)
- 11.2.4 ENEOS Corporation
- 11.2.4.1. Overview
- 11.2.4.2. Products
- 11.2.4.3. SWOT Analysis
- 11.2.4.4. Recent Developments
- 11.2.4.5. Financials (Based on Availability)
- 11.2.5 ExxonMobil Corporation
- 11.2.5.1. Overview
- 11.2.5.2. Products
- 11.2.5.3. SWOT Analysis
- 11.2.5.4. Recent Developments
- 11.2.5.5. Financials (Based on Availability)
- 11.2.6 GS Caltex
- 11.2.6.1. Overview
- 11.2.6.2. Products
- 11.2.6.3. SWOT Analysis
- 11.2.6.4. Recent Developments
- 11.2.6.5. Financials (Based on Availability)
- 11.2.7 Idemitsu Kosan Co Ltd
- 11.2.7.1. Overview
- 11.2.7.2. Products
- 11.2.7.3. SWOT Analysis
- 11.2.7.4. Recent Developments
- 11.2.7.5. Financials (Based on Availability)
- 11.2.8 Indian Oil Corporation Limited
- 11.2.8.1. Overview
- 11.2.8.2. Products
- 11.2.8.3. SWOT Analysis
- 11.2.8.4. Recent Developments
- 11.2.8.5. Financials (Based on Availability)
- 11.2.9 Royal Dutch Shell Plc
- 11.2.9.1. Overview
- 11.2.9.2. Products
- 11.2.9.3. SWOT Analysis
- 11.2.9.4. Recent Developments
- 11.2.9.5. Financials (Based on Availability)
- 11.2.10 TotalEnergie
- 11.2.10.1. Overview
- 11.2.10.2. Products
- 11.2.10.3. SWOT Analysis
- 11.2.10.4. Recent Developments
- 11.2.10.5. Financials (Based on Availability)
- 11.2.1 BP Plc (Castrol)
List of Figures
- Figure 1: Global APAC Lubricants Industry Revenue Breakdown (million, %) by Region 2025 & 2033
- Figure 2: North America APAC Lubricants Industry Revenue (million), by End User 2025 & 2033
- Figure 3: North America APAC Lubricants Industry Revenue Share (%), by End User 2025 & 2033
- Figure 4: North America APAC Lubricants Industry Revenue (million), by Product Type 2025 & 2033
- Figure 5: North America APAC Lubricants Industry Revenue Share (%), by Product Type 2025 & 2033
- Figure 6: North America APAC Lubricants Industry Revenue (million), by Country 2025 & 2033
- Figure 7: North America APAC Lubricants Industry Revenue Share (%), by Country 2025 & 2033
- Figure 8: South America APAC Lubricants Industry Revenue (million), by End User 2025 & 2033
- Figure 9: South America APAC Lubricants Industry Revenue Share (%), by End User 2025 & 2033
- Figure 10: South America APAC Lubricants Industry Revenue (million), by Product Type 2025 & 2033
- Figure 11: South America APAC Lubricants Industry Revenue Share (%), by Product Type 2025 & 2033
- Figure 12: South America APAC Lubricants Industry Revenue (million), by Country 2025 & 2033
- Figure 13: South America APAC Lubricants Industry Revenue Share (%), by Country 2025 & 2033
- Figure 14: Europe APAC Lubricants Industry Revenue (million), by End User 2025 & 2033
- Figure 15: Europe APAC Lubricants Industry Revenue Share (%), by End User 2025 & 2033
- Figure 16: Europe APAC Lubricants Industry Revenue (million), by Product Type 2025 & 2033
- Figure 17: Europe APAC Lubricants Industry Revenue Share (%), by Product Type 2025 & 2033
- Figure 18: Europe APAC Lubricants Industry Revenue (million), by Country 2025 & 2033
- Figure 19: Europe APAC Lubricants Industry Revenue Share (%), by Country 2025 & 2033
- Figure 20: Middle East & Africa APAC Lubricants Industry Revenue (million), by End User 2025 & 2033
- Figure 21: Middle East & Africa APAC Lubricants Industry Revenue Share (%), by End User 2025 & 2033
- Figure 22: Middle East & Africa APAC Lubricants Industry Revenue (million), by Product Type 2025 & 2033
- Figure 23: Middle East & Africa APAC Lubricants Industry Revenue Share (%), by Product Type 2025 & 2033
- Figure 24: Middle East & Africa APAC Lubricants Industry Revenue (million), by Country 2025 & 2033
- Figure 25: Middle East & Africa APAC Lubricants Industry Revenue Share (%), by Country 2025 & 2033
- Figure 26: Asia Pacific APAC Lubricants Industry Revenue (million), by End User 2025 & 2033
- Figure 27: Asia Pacific APAC Lubricants Industry Revenue Share (%), by End User 2025 & 2033
- Figure 28: Asia Pacific APAC Lubricants Industry Revenue (million), by Product Type 2025 & 2033
- Figure 29: Asia Pacific APAC Lubricants Industry Revenue Share (%), by Product Type 2025 & 2033
- Figure 30: Asia Pacific APAC Lubricants Industry Revenue (million), by Country 2025 & 2033
- Figure 31: Asia Pacific APAC Lubricants Industry Revenue Share (%), by Country 2025 & 2033
List of Tables
- Table 1: Global APAC Lubricants Industry Revenue million Forecast, by End User 2020 & 2033
- Table 2: Global APAC Lubricants Industry Revenue million Forecast, by Product Type 2020 & 2033
- Table 3: Global APAC Lubricants Industry Revenue million Forecast, by Region 2020 & 2033
- Table 4: Global APAC Lubricants Industry Revenue million Forecast, by End User 2020 & 2033
- Table 5: Global APAC Lubricants Industry Revenue million Forecast, by Product Type 2020 & 2033
- Table 6: Global APAC Lubricants Industry Revenue million Forecast, by Country 2020 & 2033
- Table 7: United States APAC Lubricants Industry Revenue (million) Forecast, by Application 2020 & 2033
- Table 8: Canada APAC Lubricants Industry Revenue (million) Forecast, by Application 2020 & 2033
- Table 9: Mexico APAC Lubricants Industry Revenue (million) Forecast, by Application 2020 & 2033
- Table 10: Global APAC Lubricants Industry Revenue million Forecast, by End User 2020 & 2033
- Table 11: Global APAC Lubricants Industry Revenue million Forecast, by Product Type 2020 & 2033
- Table 12: Global APAC Lubricants Industry Revenue million Forecast, by Country 2020 & 2033
- Table 13: Brazil APAC Lubricants Industry Revenue (million) Forecast, by Application 2020 & 2033
- Table 14: Argentina APAC Lubricants Industry Revenue (million) Forecast, by Application 2020 & 2033
- Table 15: Rest of South America APAC Lubricants Industry Revenue (million) Forecast, by Application 2020 & 2033
- Table 16: Global APAC Lubricants Industry Revenue million Forecast, by End User 2020 & 2033
- Table 17: Global APAC Lubricants Industry Revenue million Forecast, by Product Type 2020 & 2033
- Table 18: Global APAC Lubricants Industry Revenue million Forecast, by Country 2020 & 2033
- Table 19: United Kingdom APAC Lubricants Industry Revenue (million) Forecast, by Application 2020 & 2033
- Table 20: Germany APAC Lubricants Industry Revenue (million) Forecast, by Application 2020 & 2033
- Table 21: France APAC Lubricants Industry Revenue (million) Forecast, by Application 2020 & 2033
- Table 22: Italy APAC Lubricants Industry Revenue (million) Forecast, by Application 2020 & 2033
- Table 23: Spain APAC Lubricants Industry Revenue (million) Forecast, by Application 2020 & 2033
- Table 24: Russia APAC Lubricants Industry Revenue (million) Forecast, by Application 2020 & 2033
- Table 25: Benelux APAC Lubricants Industry Revenue (million) Forecast, by Application 2020 & 2033
- Table 26: Nordics APAC Lubricants Industry Revenue (million) Forecast, by Application 2020 & 2033
- Table 27: Rest of Europe APAC Lubricants Industry Revenue (million) Forecast, by Application 2020 & 2033
- Table 28: Global APAC Lubricants Industry Revenue million Forecast, by End User 2020 & 2033
- Table 29: Global APAC Lubricants Industry Revenue million Forecast, by Product Type 2020 & 2033
- Table 30: Global APAC Lubricants Industry Revenue million Forecast, by Country 2020 & 2033
- Table 31: Turkey APAC Lubricants Industry Revenue (million) Forecast, by Application 2020 & 2033
- Table 32: Israel APAC Lubricants Industry Revenue (million) Forecast, by Application 2020 & 2033
- Table 33: GCC APAC Lubricants Industry Revenue (million) Forecast, by Application 2020 & 2033
- Table 34: North Africa APAC Lubricants Industry Revenue (million) Forecast, by Application 2020 & 2033
- Table 35: South Africa APAC Lubricants Industry Revenue (million) Forecast, by Application 2020 & 2033
- Table 36: Rest of Middle East & Africa APAC Lubricants Industry Revenue (million) Forecast, by Application 2020 & 2033
- Table 37: Global APAC Lubricants Industry Revenue million Forecast, by End User 2020 & 2033
- Table 38: Global APAC Lubricants Industry Revenue million Forecast, by Product Type 2020 & 2033
- Table 39: Global APAC Lubricants Industry Revenue million Forecast, by Country 2020 & 2033
- Table 40: China APAC Lubricants Industry Revenue (million) Forecast, by Application 2020 & 2033
- Table 41: India APAC Lubricants Industry Revenue (million) Forecast, by Application 2020 & 2033
- Table 42: Japan APAC Lubricants Industry Revenue (million) Forecast, by Application 2020 & 2033
- Table 43: South Korea APAC Lubricants Industry Revenue (million) Forecast, by Application 2020 & 2033
- Table 44: ASEAN APAC Lubricants Industry Revenue (million) Forecast, by Application 2020 & 2033
- Table 45: Oceania APAC Lubricants Industry Revenue (million) Forecast, by Application 2020 & 2033
- Table 46: Rest of Asia Pacific APAC Lubricants Industry Revenue (million) Forecast, by Application 2020 & 2033
Frequently Asked Questions
1. What is the projected Compound Annual Growth Rate (CAGR) of the APAC Lubricants Industry?
The projected CAGR is approximately 4%.
2. Which companies are prominent players in the APAC Lubricants Industry?
Key companies in the market include BP Plc (Castrol), China National Petroleum Corporation, China Petroleum & Chemical Corporation, ENEOS Corporation, ExxonMobil Corporation, GS Caltex, Idemitsu Kosan Co Ltd, Indian Oil Corporation Limited, Royal Dutch Shell Plc, TotalEnergie.
3. What are the main segments of the APAC Lubricants Industry?
The market segments include End User, Product Type.
4. Can you provide details about the market size?
The market size is estimated to be USD 149790 million as of 2022.
5. What are some drivers contributing to market growth?
N/A
6. What are the notable trends driving market growth?
Largest Segment By End User : Automotive.
7. Are there any restraints impacting market growth?
N/A
8. Can you provide examples of recent developments in the market?
May 2022: TotalEnergies, NEXUS Automotive Extend Strategic Partnership for a period of five years. As part of this partnership, TotalEnergies Lubricants will be expanding its presence in the burgeoning N! community, which has seen rapid growth in sales from EUR 7.2 billion in 2015 to nearly EUR 35 billion by the end of 2021.March 2022: ExxonMobil Corporation company has appointed Jay Hooley as lead managing director of the company.January 2022: Effective April 1, ExxonMobil Corporation was organized along three business lines - ExxonMobil Upstream Company, ExxonMobil Product Solutions and ExxonMobil Low Carbon Solutions.
9. What pricing options are available for accessing the report?
Pricing options include single-user, multi-user, and enterprise licenses priced at USD 3800, USD 4500, and USD 5800 respectively.
10. Is the market size provided in terms of value or volume?
The market size is provided in terms of value, measured in million.
11. Are there any specific market keywords associated with the report?
Yes, the market keyword associated with the report is "APAC Lubricants Industry," which aids in identifying and referencing the specific market segment covered.
12. How do I determine which pricing option suits my needs best?
The pricing options vary based on user requirements and access needs. Individual users may opt for single-user licenses, while businesses requiring broader access may choose multi-user or enterprise licenses for cost-effective access to the report.
13. Are there any additional resources or data provided in the APAC Lubricants Industry report?
While the report offers comprehensive insights, it's advisable to review the specific contents or supplementary materials provided to ascertain if additional resources or data are available.
14. How can I stay updated on further developments or reports in the APAC Lubricants Industry?
To stay informed about further developments, trends, and reports in the APAC Lubricants Industry, consider subscribing to industry newsletters, following relevant companies and organizations, or regularly checking reputable industry news sources and publications.
Methodology
Step 1 - Identification of Relevant Samples Size from Population Database


Step 2 - Approaches for Defining Global Market Size (Value, Volume* & Price*)

Note*: In applicable scenarios
Step 3 - Data Sources
Primary Research
- Web Analytics
- Survey Reports
- Research Institute
- Latest Research Reports
- Opinion Leaders
Secondary Research
- Annual Reports
- White Paper
- Latest Press Release
- Industry Association
- Paid Database
- Investor Presentations

Step 4 - Data Triangulation
Involves using different sources of information in order to increase the validity of a study
These sources are likely to be stakeholders in a program - participants, other researchers, program staff, other community members, and so on.
Then we put all data in single framework & apply various statistical tools to find out the dynamic on the market.
During the analysis stage, feedback from the stakeholder groups would be compared to determine areas of agreement as well as areas of divergence