

Key Insights
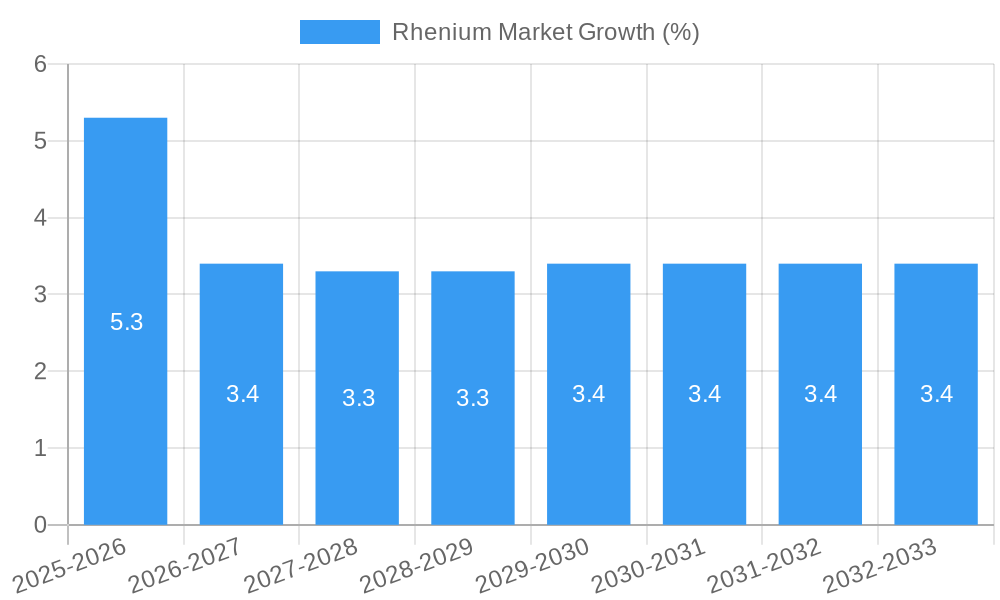
The global rhenium market, valued at $168.9 million in 2025, is projected to experience steady growth, driven by increasing demand from key sectors. A compound annual growth rate (CAGR) of 3.3% from 2025 to 2033 indicates a significant expansion, reaching an estimated market value exceeding $250 million by 2033. This growth is primarily fueled by the burgeoning aerospace industry, particularly in the manufacturing of high-performance jet engines where rhenium's unique properties are crucial for superalloy components. The rise of industrial gas turbines, crucial for power generation and industrial processes, further contributes to market expansion. Automotive applications, while currently smaller, are expected to show growth as the demand for high-performance, fuel-efficient vehicles increases. The healthcare sector presents a niche but promising avenue, with potential applications in medical devices and imaging technologies. However, challenges remain, including the limited availability of rhenium, its high price, and the potential for substitution by alternative materials in certain applications. This necessitates a focus on efficient recycling and exploration of new rhenium sources to sustain long-term market growth. Furthermore, technological advancements leading to improved extraction and refining processes could significantly influence the market's future trajectory.
The geographical distribution of the rhenium market mirrors the concentration of its key end-use industries. North America and Europe are currently dominant regions, owing to established aerospace and industrial sectors. However, the Asia-Pacific region is anticipated to show considerable growth in the coming years, driven by rapid industrialization and expanding aerospace manufacturing capacities in countries like China and India. The competitive landscape is shaped by a handful of major players including Umicore, Heraeus Holding, and Molymet S.A., who dominate the supply chain. These companies are investing in research and development to improve their production techniques and expand their product portfolios, thereby shaping the future dynamics of the rhenium market. Smaller players focus on niche applications or regional markets, contributing to the overall market diversity. Maintaining a balance between supply and demand, along with sustainable sourcing practices, will be key to ensuring the responsible growth of this vital metal market.

Rhenium Market Market Composition & Trends
The Rhenium Market is characterized by a high level of market concentration, with a few key players dominating the industry. Major companies such as Umicore, Heraeus Holding, and MOLYMET S.A. hold significant market shares, with Umicore leading at approximately 25%. Innovation within the sector is driven by the need for advanced materials in high-performance applications, particularly in aerospace and industrial gas turbines. Regulatory landscapes vary by region, with stringent environmental regulations in Europe influencing production processes. Substitute products, such as tungsten and molybdenum, pose a threat to rhenium's market share, yet rhenium's unique properties maintain its demand.
- End-User Profiles: The aerospace sector is the largest consumer of rhenium, accounting for over 50% of demand. Industrial gas turbines follow, driven by the need for high-temperature resistance.
- Mergers and Acquisitions: The market has seen significant M&A activity, with a total deal value reaching $1.2 Billion in the last five years. Notable acquisitions include Heraeus Holding's purchase of a rhenium production facility in 2022 for $300 Million.
- Market Share Distribution: Umicore: 25%, Heraeus Holding: 20%, MOLYMET S.A.: 15%, Others: 40%.
The market's trajectory is influenced by technological advancements and the need for materials that can withstand extreme conditions. The focus on sustainability and efficiency continues to drive innovation in rhenium applications.
Rhenium Market Industry Evolution
The rhenium market has undergone a significant transformation from 2019 to 2024, exhibiting a Compound Annual Growth Rate (CAGR) of 5.2%. This growth trajectory is projected to continue through 2033, driven by a confluence of factors. The aerospace industry remains the dominant consumer, leveraging rhenium's exceptional properties – its remarkably high melting point and superior corrosion resistance – in the production of high-performance jet engines. This sector's reliance on rhenium has increased substantially, with its usage in superalloys rising from 30% to 45% over the past decade, reflecting a growing need for durable and efficient engine components. Technological advancements in rhenium processing have concurrently improved efficiency, lowered production costs, and increased overall availability.
Beyond aerospace, the market is witnessing shifts in consumer demand towards sustainable and high-performance materials. While the automotive sector's adoption of rhenium in catalytic converters is still nascent, its potential for growth is notable. A particularly promising avenue is the healthcare sector, where rhenium's application in medical isotopes for targeted therapies shows immense potential for future expansion, fueled by ongoing research and development. Furthermore, evolving regulatory landscapes in North America and Europe are actively promoting eco-friendly materials and production processes, further stimulating market growth. The rhenium market's future is bright, poised for continued evolution and expansion across diverse industrial applications.
Leading Regions, Countries, or Segments in Rhenium Market
The rhenium market is heavily influenced by the aerospace sector, with North America, particularly the United States, holding a leading position in both production and consumption. This dominance stems primarily from the aerospace industry's significant reliance on rhenium for critical jet engine components.
- Key Drivers in the Aerospace Sector:
- Robust Investment: The aerospace sector has witnessed substantial investments in R&D, exceeding $5 billion allocated to advanced materials research in 2024 alone.
- Regulatory Support: The Federal Aviation Administration (FAA) regulations actively encourage the utilization of high-performance materials, like rhenium, in aircraft engine construction.
The unique characteristics of rhenium—its exceptionally high melting point and exceptional corrosion resistance—make it indispensable for high-stress applications within jet engines. The United States, possessing a robust and technologically advanced aerospace industry, accounts for over 60% of global rhenium consumption within this sector. The demand for rhenium in superalloys has seen a substantial surge, growing at a CAGR of 6.1% from 2019 to 2024, reflecting the ongoing drive for more efficient and durable aircraft engines.
Beyond aerospace, the industrial gas turbine segment stands out, especially in Europe. The continent's strong commitment to renewable energy sources has significantly increased the demand for high-efficiency turbines, resulting in a 4.5% CAGR in rhenium usage for gas turbines from 2019 to 2024.
- Key Drivers in Industrial Gas Turbines:
- Significant EU Investment: The European Union's dedication to renewable energy is evident in its substantial investment, with €2 billion in funding allocated to turbine technology advancements in 2024.
- EU Regulatory Framework: EU directives promoting energy efficiency and emission reduction further fuel the demand for high-performance materials like rhenium.
While currently smaller, the healthcare sector presents a highly promising and rapidly emerging market segment. The utilization of rhenium in medical isotopes for cancer treatment is gaining significant traction, with ongoing research and development efforts anticipated to drive considerable future demand.
Rhenium Market Product Innovations
Recent product innovations in the Rhenium Market include the development of advanced rhenium-containing superalloys that offer enhanced strength and durability. These alloys are particularly valuable in aerospace applications, where they improve engine performance and longevity. Additionally, new rhenium-based catalysts have been introduced, which exhibit higher efficiency and selectivity in chemical processes. These innovations are driven by technological advancements in materials science, allowing for the creation of materials with unique properties. The unique selling proposition of these innovations lies in their ability to meet the stringent performance requirements of high-demand industries.
Propelling Factors for Rhenium Market Growth
The growth of the Rhenium Market is propelled by several key factors. Technologically, advancements in materials science are enabling the development of high-performance rhenium alloys and catalysts. Economically, the aerospace and energy sectors' demand for durable, high-temperature materials drives market expansion. Regulatory influences, such as environmental policies promoting sustainable materials, also contribute to growth. For instance, the European Union's focus on reducing emissions has increased the demand for rhenium in industrial gas turbines.
Obstacles in the Rhenium Market Market
The Rhenium Market faces several obstacles that could impede growth. Regulatory challenges, such as stringent environmental regulations, increase production costs. Supply chain disruptions, particularly in sourcing rhenium from mining operations, can lead to shortages and price volatility. Competitive pressures from substitute materials like tungsten and molybdenum also pose a threat, with these alternatives capturing market share in some applications. These barriers could result in a potential 2% reduction in market growth rate over the forecast period.
Future Opportunities in Rhenium Market
The rhenium market is ripe with future opportunities. Expansion into new markets, particularly healthcare with its growing use of rhenium isotopes, offers significant potential. Further advancements in rhenium processing technologies could unlock novel applications in electronics and renewable energy sectors. Moreover, the increasing global focus on sustainability is driving demand for eco-friendly rhenium products, creating new avenues for growth and innovation.
Major Players in the Rhenium Market Ecosystem
- Umicore
- Heraeus Holding
- MOLYMET S.A.
- KGHM
- Colonial Metals Inc
- Höganäs AB
- American Elements
- NEO
- H Cross Company
- Buss & Buss Spezialmetalle GmbH
- Rhenium Alloys Inc
Key Developments in Rhenium Market Industry
- January 2022: Umicore acquired a rhenium production facility for $300 Million, enhancing its production capacity.
- March 2023: Heraeus Holding launched a new line of rhenium-based catalysts, improving efficiency in chemical processes.
- June 2024: MOLYMET S.A. announced a strategic partnership with KGHM to expand rhenium mining operations, aiming to increase supply.
Strategic Rhenium Market Market Forecast
The Rhenium Market is poised for robust growth over the forecast period of 2025-2033, driven by increasing demand from the aerospace and industrial gas turbine sectors. Future opportunities in healthcare and renewable energy will further enhance market potential. Technological advancements and regulatory support for sustainable materials are key catalysts for this growth, with the market expected to reach a value of $xx Million by 2033.
Rhenium Market Segmentation
-
1. Application
- 1.1. Superalloys
- 1.2. Catalysts
- 1.3. Other Applications
-
2. End-User Industry
- 2.1. Aerospace
- 2.2. Industrial Gas Turbines
- 2.3. Automotive
- 2.4. Healthcare
- 2.5. Other End-user Industries
Rhenium Market Segmentation By Geography
-
1. Asia Pacific
- 1.1. China
- 1.2. India
- 1.3. Japan
- 1.4. South Korea
- 1.5. Rest of Asia Pacific
-
2. North America
- 2.1. United States
- 2.2. Canada
- 2.3. Mexico
-
3. Europe
- 3.1. Germany
- 3.2. United Kingdom
- 3.3. France
- 3.4. Italy
- 3.5. Rest of Europe
-
4. South America
- 4.1. Brazil
- 4.2. Argentina
- 4.3. Rest of South America
-
5. Middle East and Africa
- 5.1. Saudi Arabia
- 5.2. South Africa
- 5.3. Rest of Middle East and Africa

Rhenium Market REPORT HIGHLIGHTS
| Aspects | Details |
|---|---|
| Study Period | 2019-2033 |
| Base Year | 2024 |
| Estimated Year | 2025 |
| Forecast Period | 2025-2033 |
| Historical Period | 2019-2024 |
| Growth Rate | CAGR of 3.3% from 2019-2033 |
| Segmentation |
|
Table of Contents
- 1. Introduction
- 1.1. Research Scope
- 1.2. Market Segmentation
- 1.3. Research Methodology
- 1.4. Definitions and Assumptions
- 2. Executive Summary
- 2.1. Introduction
- 3. Market Dynamics
- 3.1. Introduction
- 3.2. Market Drivers
- 3.2.1. ; Growth in the Production of Aircraft; Increasing Demand from the Power Industry; Mounting Prominence in Catalyst Applications
- 3.3. Market Restrains
- 3.3.1. ; Growing Usage of Substitutes; Unfavorable Conditions Arising Due to COVID-19 Outbreak
- 3.4. Market Trends
- 3.4.1. Aerospace to Dominate the Market
- 4. Market Factor Analysis
- 4.1. Porters Five Forces
- 4.2. Supply/Value Chain
- 4.3. PESTEL analysis
- 4.4. Market Entropy
- 4.5. Patent/Trademark Analysis
- 5. Global Rhenium Market Analysis, Insights and Forecast, 2019-2031
- 5.1. Market Analysis, Insights and Forecast - by Application
- 5.1.1. Superalloys
- 5.1.2. Catalysts
- 5.1.3. Other Applications
- 5.2. Market Analysis, Insights and Forecast - by End-User Industry
- 5.2.1. Aerospace
- 5.2.2. Industrial Gas Turbines
- 5.2.3. Automotive
- 5.2.4. Healthcare
- 5.2.5. Other End-user Industries
- 5.3. Market Analysis, Insights and Forecast - by Region
- 5.3.1. Asia Pacific
- 5.3.2. North America
- 5.3.3. Europe
- 5.3.4. South America
- 5.3.5. Middle East and Africa
- 5.1. Market Analysis, Insights and Forecast - by Application
- 6. Asia Pacific Rhenium Market Analysis, Insights and Forecast, 2019-2031
- 6.1. Market Analysis, Insights and Forecast - by Application
- 6.1.1. Superalloys
- 6.1.2. Catalysts
- 6.1.3. Other Applications
- 6.2. Market Analysis, Insights and Forecast - by End-User Industry
- 6.2.1. Aerospace
- 6.2.2. Industrial Gas Turbines
- 6.2.3. Automotive
- 6.2.4. Healthcare
- 6.2.5. Other End-user Industries
- 6.1. Market Analysis, Insights and Forecast - by Application
- 7. North America Rhenium Market Analysis, Insights and Forecast, 2019-2031
- 7.1. Market Analysis, Insights and Forecast - by Application
- 7.1.1. Superalloys
- 7.1.2. Catalysts
- 7.1.3. Other Applications
- 7.2. Market Analysis, Insights and Forecast - by End-User Industry
- 7.2.1. Aerospace
- 7.2.2. Industrial Gas Turbines
- 7.2.3. Automotive
- 7.2.4. Healthcare
- 7.2.5. Other End-user Industries
- 7.1. Market Analysis, Insights and Forecast - by Application
- 8. Europe Rhenium Market Analysis, Insights and Forecast, 2019-2031
- 8.1. Market Analysis, Insights and Forecast - by Application
- 8.1.1. Superalloys
- 8.1.2. Catalysts
- 8.1.3. Other Applications
- 8.2. Market Analysis, Insights and Forecast - by End-User Industry
- 8.2.1. Aerospace
- 8.2.2. Industrial Gas Turbines
- 8.2.3. Automotive
- 8.2.4. Healthcare
- 8.2.5. Other End-user Industries
- 8.1. Market Analysis, Insights and Forecast - by Application
- 9. South America Rhenium Market Analysis, Insights and Forecast, 2019-2031
- 9.1. Market Analysis, Insights and Forecast - by Application
- 9.1.1. Superalloys
- 9.1.2. Catalysts
- 9.1.3. Other Applications
- 9.2. Market Analysis, Insights and Forecast - by End-User Industry
- 9.2.1. Aerospace
- 9.2.2. Industrial Gas Turbines
- 9.2.3. Automotive
- 9.2.4. Healthcare
- 9.2.5. Other End-user Industries
- 9.1. Market Analysis, Insights and Forecast - by Application
- 10. Middle East and Africa Rhenium Market Analysis, Insights and Forecast, 2019-2031
- 10.1. Market Analysis, Insights and Forecast - by Application
- 10.1.1. Superalloys
- 10.1.2. Catalysts
- 10.1.3. Other Applications
- 10.2. Market Analysis, Insights and Forecast - by End-User Industry
- 10.2.1. Aerospace
- 10.2.2. Industrial Gas Turbines
- 10.2.3. Automotive
- 10.2.4. Healthcare
- 10.2.5. Other End-user Industries
- 10.1. Market Analysis, Insights and Forecast - by Application
- 11. North America Rhenium Market Analysis, Insights and Forecast, 2019-2031
- 11.1. Market Analysis, Insights and Forecast - By Country/Sub-region
- 11.1.1 United States
- 11.1.2 Canada
- 11.1.3 Mexico
- 12. Europe Rhenium Market Analysis, Insights and Forecast, 2019-2031
- 12.1. Market Analysis, Insights and Forecast - By Country/Sub-region
- 12.1.1 Germany
- 12.1.2 France
- 12.1.3 Italy
- 12.1.4 United Kingdom
- 12.1.5 Netherlands
- 12.1.6 Rest of Europe
- 13. Asia Pacific Rhenium Market Analysis, Insights and Forecast, 2019-2031
- 13.1. Market Analysis, Insights and Forecast - By Country/Sub-region
- 13.1.1 China
- 13.1.2 Japan
- 13.1.3 India
- 13.1.4 South Korea
- 13.1.5 Taiwan
- 13.1.6 Australia
- 13.1.7 Rest of Asia-Pacific
- 14. South America Rhenium Market Analysis, Insights and Forecast, 2019-2031
- 14.1. Market Analysis, Insights and Forecast - By Country/Sub-region
- 14.1.1 Brazil
- 14.1.2 Argentina
- 14.1.3 Rest of South America
- 15. MEA Rhenium Market Analysis, Insights and Forecast, 2019-2031
- 15.1. Market Analysis, Insights and Forecast - By Country/Sub-region
- 15.1.1 Middle East
- 15.1.2 Africa
- 16. Competitive Analysis
- 16.1. Global Market Share Analysis 2024
- 16.2. Company Profiles
- 16.2.1 Umicore
- 16.2.1.1. Overview
- 16.2.1.2. Products
- 16.2.1.3. SWOT Analysis
- 16.2.1.4. Recent Developments
- 16.2.1.5. Financials (Based on Availability)
- 16.2.2 Heraeus Holding
- 16.2.2.1. Overview
- 16.2.2.2. Products
- 16.2.2.3. SWOT Analysis
- 16.2.2.4. Recent Developments
- 16.2.2.5. Financials (Based on Availability)
- 16.2.3 MOLYMET S A
- 16.2.3.1. Overview
- 16.2.3.2. Products
- 16.2.3.3. SWOT Analysis
- 16.2.3.4. Recent Developments
- 16.2.3.5. Financials (Based on Availability)
- 16.2.4 KGHM
- 16.2.4.1. Overview
- 16.2.4.2. Products
- 16.2.4.3. SWOT Analysis
- 16.2.4.4. Recent Developments
- 16.2.4.5. Financials (Based on Availability)
- 16.2.5 Colonial Metals Inc
- 16.2.5.1. Overview
- 16.2.5.2. Products
- 16.2.5.3. SWOT Analysis
- 16.2.5.4. Recent Developments
- 16.2.5.5. Financials (Based on Availability)
- 16.2.6 Höganäs AB
- 16.2.6.1. Overview
- 16.2.6.2. Products
- 16.2.6.3. SWOT Analysis
- 16.2.6.4. Recent Developments
- 16.2.6.5. Financials (Based on Availability)
- 16.2.7 American Elements
- 16.2.7.1. Overview
- 16.2.7.2. Products
- 16.2.7.3. SWOT Analysis
- 16.2.7.4. Recent Developments
- 16.2.7.5. Financials (Based on Availability)
- 16.2.8 NEO
- 16.2.8.1. Overview
- 16.2.8.2. Products
- 16.2.8.3. SWOT Analysis
- 16.2.8.4. Recent Developments
- 16.2.8.5. Financials (Based on Availability)
- 16.2.9 H Cross Company
- 16.2.9.1. Overview
- 16.2.9.2. Products
- 16.2.9.3. SWOT Analysis
- 16.2.9.4. Recent Developments
- 16.2.9.5. Financials (Based on Availability)
- 16.2.10 Buss & Buss Spezialmetalle GmbH
- 16.2.10.1. Overview
- 16.2.10.2. Products
- 16.2.10.3. SWOT Analysis
- 16.2.10.4. Recent Developments
- 16.2.10.5. Financials (Based on Availability)
- 16.2.11 Rhenium Alloys Inc
- 16.2.11.1. Overview
- 16.2.11.2. Products
- 16.2.11.3. SWOT Analysis
- 16.2.11.4. Recent Developments
- 16.2.11.5. Financials (Based on Availability)
- 16.2.1 Umicore
List of Figures
- Figure 1: Global Rhenium Market Revenue Breakdown (Million, %) by Region 2024 & 2032
- Figure 2: Global Rhenium Market Volume Breakdown (K Tons, %) by Region 2024 & 2032
- Figure 3: North America Rhenium Market Revenue (Million), by Country 2024 & 2032
- Figure 4: North America Rhenium Market Volume (K Tons), by Country 2024 & 2032
- Figure 5: North America Rhenium Market Revenue Share (%), by Country 2024 & 2032
- Figure 6: North America Rhenium Market Volume Share (%), by Country 2024 & 2032
- Figure 7: Europe Rhenium Market Revenue (Million), by Country 2024 & 2032
- Figure 8: Europe Rhenium Market Volume (K Tons), by Country 2024 & 2032
- Figure 9: Europe Rhenium Market Revenue Share (%), by Country 2024 & 2032
- Figure 10: Europe Rhenium Market Volume Share (%), by Country 2024 & 2032
- Figure 11: Asia Pacific Rhenium Market Revenue (Million), by Country 2024 & 2032
- Figure 12: Asia Pacific Rhenium Market Volume (K Tons), by Country 2024 & 2032
- Figure 13: Asia Pacific Rhenium Market Revenue Share (%), by Country 2024 & 2032
- Figure 14: Asia Pacific Rhenium Market Volume Share (%), by Country 2024 & 2032
- Figure 15: South America Rhenium Market Revenue (Million), by Country 2024 & 2032
- Figure 16: South America Rhenium Market Volume (K Tons), by Country 2024 & 2032
- Figure 17: South America Rhenium Market Revenue Share (%), by Country 2024 & 2032
- Figure 18: South America Rhenium Market Volume Share (%), by Country 2024 & 2032
- Figure 19: MEA Rhenium Market Revenue (Million), by Country 2024 & 2032
- Figure 20: MEA Rhenium Market Volume (K Tons), by Country 2024 & 2032
- Figure 21: MEA Rhenium Market Revenue Share (%), by Country 2024 & 2032
- Figure 22: MEA Rhenium Market Volume Share (%), by Country 2024 & 2032
- Figure 23: Asia Pacific Rhenium Market Revenue (Million), by Application 2024 & 2032
- Figure 24: Asia Pacific Rhenium Market Volume (K Tons), by Application 2024 & 2032
- Figure 25: Asia Pacific Rhenium Market Revenue Share (%), by Application 2024 & 2032
- Figure 26: Asia Pacific Rhenium Market Volume Share (%), by Application 2024 & 2032
- Figure 27: Asia Pacific Rhenium Market Revenue (Million), by End-User Industry 2024 & 2032
- Figure 28: Asia Pacific Rhenium Market Volume (K Tons), by End-User Industry 2024 & 2032
- Figure 29: Asia Pacific Rhenium Market Revenue Share (%), by End-User Industry 2024 & 2032
- Figure 30: Asia Pacific Rhenium Market Volume Share (%), by End-User Industry 2024 & 2032
- Figure 31: Asia Pacific Rhenium Market Revenue (Million), by Country 2024 & 2032
- Figure 32: Asia Pacific Rhenium Market Volume (K Tons), by Country 2024 & 2032
- Figure 33: Asia Pacific Rhenium Market Revenue Share (%), by Country 2024 & 2032
- Figure 34: Asia Pacific Rhenium Market Volume Share (%), by Country 2024 & 2032
- Figure 35: North America Rhenium Market Revenue (Million), by Application 2024 & 2032
- Figure 36: North America Rhenium Market Volume (K Tons), by Application 2024 & 2032
- Figure 37: North America Rhenium Market Revenue Share (%), by Application 2024 & 2032
- Figure 38: North America Rhenium Market Volume Share (%), by Application 2024 & 2032
- Figure 39: North America Rhenium Market Revenue (Million), by End-User Industry 2024 & 2032
- Figure 40: North America Rhenium Market Volume (K Tons), by End-User Industry 2024 & 2032
- Figure 41: North America Rhenium Market Revenue Share (%), by End-User Industry 2024 & 2032
- Figure 42: North America Rhenium Market Volume Share (%), by End-User Industry 2024 & 2032
- Figure 43: North America Rhenium Market Revenue (Million), by Country 2024 & 2032
- Figure 44: North America Rhenium Market Volume (K Tons), by Country 2024 & 2032
- Figure 45: North America Rhenium Market Revenue Share (%), by Country 2024 & 2032
- Figure 46: North America Rhenium Market Volume Share (%), by Country 2024 & 2032
- Figure 47: Europe Rhenium Market Revenue (Million), by Application 2024 & 2032
- Figure 48: Europe Rhenium Market Volume (K Tons), by Application 2024 & 2032
- Figure 49: Europe Rhenium Market Revenue Share (%), by Application 2024 & 2032
- Figure 50: Europe Rhenium Market Volume Share (%), by Application 2024 & 2032
- Figure 51: Europe Rhenium Market Revenue (Million), by End-User Industry 2024 & 2032
- Figure 52: Europe Rhenium Market Volume (K Tons), by End-User Industry 2024 & 2032
- Figure 53: Europe Rhenium Market Revenue Share (%), by End-User Industry 2024 & 2032
- Figure 54: Europe Rhenium Market Volume Share (%), by End-User Industry 2024 & 2032
- Figure 55: Europe Rhenium Market Revenue (Million), by Country 2024 & 2032
- Figure 56: Europe Rhenium Market Volume (K Tons), by Country 2024 & 2032
- Figure 57: Europe Rhenium Market Revenue Share (%), by Country 2024 & 2032
- Figure 58: Europe Rhenium Market Volume Share (%), by Country 2024 & 2032
- Figure 59: South America Rhenium Market Revenue (Million), by Application 2024 & 2032
- Figure 60: South America Rhenium Market Volume (K Tons), by Application 2024 & 2032
- Figure 61: South America Rhenium Market Revenue Share (%), by Application 2024 & 2032
- Figure 62: South America Rhenium Market Volume Share (%), by Application 2024 & 2032
- Figure 63: South America Rhenium Market Revenue (Million), by End-User Industry 2024 & 2032
- Figure 64: South America Rhenium Market Volume (K Tons), by End-User Industry 2024 & 2032
- Figure 65: South America Rhenium Market Revenue Share (%), by End-User Industry 2024 & 2032
- Figure 66: South America Rhenium Market Volume Share (%), by End-User Industry 2024 & 2032
- Figure 67: South America Rhenium Market Revenue (Million), by Country 2024 & 2032
- Figure 68: South America Rhenium Market Volume (K Tons), by Country 2024 & 2032
- Figure 69: South America Rhenium Market Revenue Share (%), by Country 2024 & 2032
- Figure 70: South America Rhenium Market Volume Share (%), by Country 2024 & 2032
- Figure 71: Middle East and Africa Rhenium Market Revenue (Million), by Application 2024 & 2032
- Figure 72: Middle East and Africa Rhenium Market Volume (K Tons), by Application 2024 & 2032
- Figure 73: Middle East and Africa Rhenium Market Revenue Share (%), by Application 2024 & 2032
- Figure 74: Middle East and Africa Rhenium Market Volume Share (%), by Application 2024 & 2032
- Figure 75: Middle East and Africa Rhenium Market Revenue (Million), by End-User Industry 2024 & 2032
- Figure 76: Middle East and Africa Rhenium Market Volume (K Tons), by End-User Industry 2024 & 2032
- Figure 77: Middle East and Africa Rhenium Market Revenue Share (%), by End-User Industry 2024 & 2032
- Figure 78: Middle East and Africa Rhenium Market Volume Share (%), by End-User Industry 2024 & 2032
- Figure 79: Middle East and Africa Rhenium Market Revenue (Million), by Country 2024 & 2032
- Figure 80: Middle East and Africa Rhenium Market Volume (K Tons), by Country 2024 & 2032
- Figure 81: Middle East and Africa Rhenium Market Revenue Share (%), by Country 2024 & 2032
- Figure 82: Middle East and Africa Rhenium Market Volume Share (%), by Country 2024 & 2032
List of Tables
- Table 1: Global Rhenium Market Revenue Million Forecast, by Region 2019 & 2032
- Table 2: Global Rhenium Market Volume K Tons Forecast, by Region 2019 & 2032
- Table 3: Global Rhenium Market Revenue Million Forecast, by Application 2019 & 2032
- Table 4: Global Rhenium Market Volume K Tons Forecast, by Application 2019 & 2032
- Table 5: Global Rhenium Market Revenue Million Forecast, by End-User Industry 2019 & 2032
- Table 6: Global Rhenium Market Volume K Tons Forecast, by End-User Industry 2019 & 2032
- Table 7: Global Rhenium Market Revenue Million Forecast, by Region 2019 & 2032
- Table 8: Global Rhenium Market Volume K Tons Forecast, by Region 2019 & 2032
- Table 9: Global Rhenium Market Revenue Million Forecast, by Country 2019 & 2032
- Table 10: Global Rhenium Market Volume K Tons Forecast, by Country 2019 & 2032
- Table 11: United States Rhenium Market Revenue (Million) Forecast, by Application 2019 & 2032
- Table 12: United States Rhenium Market Volume (K Tons) Forecast, by Application 2019 & 2032
- Table 13: Canada Rhenium Market Revenue (Million) Forecast, by Application 2019 & 2032
- Table 14: Canada Rhenium Market Volume (K Tons) Forecast, by Application 2019 & 2032
- Table 15: Mexico Rhenium Market Revenue (Million) Forecast, by Application 2019 & 2032
- Table 16: Mexico Rhenium Market Volume (K Tons) Forecast, by Application 2019 & 2032
- Table 17: Global Rhenium Market Revenue Million Forecast, by Country 2019 & 2032
- Table 18: Global Rhenium Market Volume K Tons Forecast, by Country 2019 & 2032
- Table 19: Germany Rhenium Market Revenue (Million) Forecast, by Application 2019 & 2032
- Table 20: Germany Rhenium Market Volume (K Tons) Forecast, by Application 2019 & 2032
- Table 21: France Rhenium Market Revenue (Million) Forecast, by Application 2019 & 2032
- Table 22: France Rhenium Market Volume (K Tons) Forecast, by Application 2019 & 2032
- Table 23: Italy Rhenium Market Revenue (Million) Forecast, by Application 2019 & 2032
- Table 24: Italy Rhenium Market Volume (K Tons) Forecast, by Application 2019 & 2032
- Table 25: United Kingdom Rhenium Market Revenue (Million) Forecast, by Application 2019 & 2032
- Table 26: United Kingdom Rhenium Market Volume (K Tons) Forecast, by Application 2019 & 2032
- Table 27: Netherlands Rhenium Market Revenue (Million) Forecast, by Application 2019 & 2032
- Table 28: Netherlands Rhenium Market Volume (K Tons) Forecast, by Application 2019 & 2032
- Table 29: Rest of Europe Rhenium Market Revenue (Million) Forecast, by Application 2019 & 2032
- Table 30: Rest of Europe Rhenium Market Volume (K Tons) Forecast, by Application 2019 & 2032
- Table 31: Global Rhenium Market Revenue Million Forecast, by Country 2019 & 2032
- Table 32: Global Rhenium Market Volume K Tons Forecast, by Country 2019 & 2032
- Table 33: China Rhenium Market Revenue (Million) Forecast, by Application 2019 & 2032
- Table 34: China Rhenium Market Volume (K Tons) Forecast, by Application 2019 & 2032
- Table 35: Japan Rhenium Market Revenue (Million) Forecast, by Application 2019 & 2032
- Table 36: Japan Rhenium Market Volume (K Tons) Forecast, by Application 2019 & 2032
- Table 37: India Rhenium Market Revenue (Million) Forecast, by Application 2019 & 2032
- Table 38: India Rhenium Market Volume (K Tons) Forecast, by Application 2019 & 2032
- Table 39: South Korea Rhenium Market Revenue (Million) Forecast, by Application 2019 & 2032
- Table 40: South Korea Rhenium Market Volume (K Tons) Forecast, by Application 2019 & 2032
- Table 41: Taiwan Rhenium Market Revenue (Million) Forecast, by Application 2019 & 2032
- Table 42: Taiwan Rhenium Market Volume (K Tons) Forecast, by Application 2019 & 2032
- Table 43: Australia Rhenium Market Revenue (Million) Forecast, by Application 2019 & 2032
- Table 44: Australia Rhenium Market Volume (K Tons) Forecast, by Application 2019 & 2032
- Table 45: Rest of Asia-Pacific Rhenium Market Revenue (Million) Forecast, by Application 2019 & 2032
- Table 46: Rest of Asia-Pacific Rhenium Market Volume (K Tons) Forecast, by Application 2019 & 2032
- Table 47: Global Rhenium Market Revenue Million Forecast, by Country 2019 & 2032
- Table 48: Global Rhenium Market Volume K Tons Forecast, by Country 2019 & 2032
- Table 49: Brazil Rhenium Market Revenue (Million) Forecast, by Application 2019 & 2032
- Table 50: Brazil Rhenium Market Volume (K Tons) Forecast, by Application 2019 & 2032
- Table 51: Argentina Rhenium Market Revenue (Million) Forecast, by Application 2019 & 2032
- Table 52: Argentina Rhenium Market Volume (K Tons) Forecast, by Application 2019 & 2032
- Table 53: Rest of South America Rhenium Market Revenue (Million) Forecast, by Application 2019 & 2032
- Table 54: Rest of South America Rhenium Market Volume (K Tons) Forecast, by Application 2019 & 2032
- Table 55: Global Rhenium Market Revenue Million Forecast, by Country 2019 & 2032
- Table 56: Global Rhenium Market Volume K Tons Forecast, by Country 2019 & 2032
- Table 57: Middle East Rhenium Market Revenue (Million) Forecast, by Application 2019 & 2032
- Table 58: Middle East Rhenium Market Volume (K Tons) Forecast, by Application 2019 & 2032
- Table 59: Africa Rhenium Market Revenue (Million) Forecast, by Application 2019 & 2032
- Table 60: Africa Rhenium Market Volume (K Tons) Forecast, by Application 2019 & 2032
- Table 61: Global Rhenium Market Revenue Million Forecast, by Application 2019 & 2032
- Table 62: Global Rhenium Market Volume K Tons Forecast, by Application 2019 & 2032
- Table 63: Global Rhenium Market Revenue Million Forecast, by End-User Industry 2019 & 2032
- Table 64: Global Rhenium Market Volume K Tons Forecast, by End-User Industry 2019 & 2032
- Table 65: Global Rhenium Market Revenue Million Forecast, by Country 2019 & 2032
- Table 66: Global Rhenium Market Volume K Tons Forecast, by Country 2019 & 2032
- Table 67: China Rhenium Market Revenue (Million) Forecast, by Application 2019 & 2032
- Table 68: China Rhenium Market Volume (K Tons) Forecast, by Application 2019 & 2032
- Table 69: India Rhenium Market Revenue (Million) Forecast, by Application 2019 & 2032
- Table 70: India Rhenium Market Volume (K Tons) Forecast, by Application 2019 & 2032
- Table 71: Japan Rhenium Market Revenue (Million) Forecast, by Application 2019 & 2032
- Table 72: Japan Rhenium Market Volume (K Tons) Forecast, by Application 2019 & 2032
- Table 73: South Korea Rhenium Market Revenue (Million) Forecast, by Application 2019 & 2032
- Table 74: South Korea Rhenium Market Volume (K Tons) Forecast, by Application 2019 & 2032
- Table 75: Rest of Asia Pacific Rhenium Market Revenue (Million) Forecast, by Application 2019 & 2032
- Table 76: Rest of Asia Pacific Rhenium Market Volume (K Tons) Forecast, by Application 2019 & 2032
- Table 77: Global Rhenium Market Revenue Million Forecast, by Application 2019 & 2032
- Table 78: Global Rhenium Market Volume K Tons Forecast, by Application 2019 & 2032
- Table 79: Global Rhenium Market Revenue Million Forecast, by End-User Industry 2019 & 2032
- Table 80: Global Rhenium Market Volume K Tons Forecast, by End-User Industry 2019 & 2032
- Table 81: Global Rhenium Market Revenue Million Forecast, by Country 2019 & 2032
- Table 82: Global Rhenium Market Volume K Tons Forecast, by Country 2019 & 2032
- Table 83: United States Rhenium Market Revenue (Million) Forecast, by Application 2019 & 2032
- Table 84: United States Rhenium Market Volume (K Tons) Forecast, by Application 2019 & 2032
- Table 85: Canada Rhenium Market Revenue (Million) Forecast, by Application 2019 & 2032
- Table 86: Canada Rhenium Market Volume (K Tons) Forecast, by Application 2019 & 2032
- Table 87: Mexico Rhenium Market Revenue (Million) Forecast, by Application 2019 & 2032
- Table 88: Mexico Rhenium Market Volume (K Tons) Forecast, by Application 2019 & 2032
- Table 89: Global Rhenium Market Revenue Million Forecast, by Application 2019 & 2032
- Table 90: Global Rhenium Market Volume K Tons Forecast, by Application 2019 & 2032
- Table 91: Global Rhenium Market Revenue Million Forecast, by End-User Industry 2019 & 2032
- Table 92: Global Rhenium Market Volume K Tons Forecast, by End-User Industry 2019 & 2032
- Table 93: Global Rhenium Market Revenue Million Forecast, by Country 2019 & 2032
- Table 94: Global Rhenium Market Volume K Tons Forecast, by Country 2019 & 2032
- Table 95: Germany Rhenium Market Revenue (Million) Forecast, by Application 2019 & 2032
- Table 96: Germany Rhenium Market Volume (K Tons) Forecast, by Application 2019 & 2032
- Table 97: United Kingdom Rhenium Market Revenue (Million) Forecast, by Application 2019 & 2032
- Table 98: United Kingdom Rhenium Market Volume (K Tons) Forecast, by Application 2019 & 2032
- Table 99: France Rhenium Market Revenue (Million) Forecast, by Application 2019 & 2032
- Table 100: France Rhenium Market Volume (K Tons) Forecast, by Application 2019 & 2032
- Table 101: Italy Rhenium Market Revenue (Million) Forecast, by Application 2019 & 2032
- Table 102: Italy Rhenium Market Volume (K Tons) Forecast, by Application 2019 & 2032
- Table 103: Rest of Europe Rhenium Market Revenue (Million) Forecast, by Application 2019 & 2032
- Table 104: Rest of Europe Rhenium Market Volume (K Tons) Forecast, by Application 2019 & 2032
- Table 105: Global Rhenium Market Revenue Million Forecast, by Application 2019 & 2032
- Table 106: Global Rhenium Market Volume K Tons Forecast, by Application 2019 & 2032
- Table 107: Global Rhenium Market Revenue Million Forecast, by End-User Industry 2019 & 2032
- Table 108: Global Rhenium Market Volume K Tons Forecast, by End-User Industry 2019 & 2032
- Table 109: Global Rhenium Market Revenue Million Forecast, by Country 2019 & 2032
- Table 110: Global Rhenium Market Volume K Tons Forecast, by Country 2019 & 2032
- Table 111: Brazil Rhenium Market Revenue (Million) Forecast, by Application 2019 & 2032
- Table 112: Brazil Rhenium Market Volume (K Tons) Forecast, by Application 2019 & 2032
- Table 113: Argentina Rhenium Market Revenue (Million) Forecast, by Application 2019 & 2032
- Table 114: Argentina Rhenium Market Volume (K Tons) Forecast, by Application 2019 & 2032
- Table 115: Rest of South America Rhenium Market Revenue (Million) Forecast, by Application 2019 & 2032
- Table 116: Rest of South America Rhenium Market Volume (K Tons) Forecast, by Application 2019 & 2032
- Table 117: Global Rhenium Market Revenue Million Forecast, by Application 2019 & 2032
- Table 118: Global Rhenium Market Volume K Tons Forecast, by Application 2019 & 2032
- Table 119: Global Rhenium Market Revenue Million Forecast, by End-User Industry 2019 & 2032
- Table 120: Global Rhenium Market Volume K Tons Forecast, by End-User Industry 2019 & 2032
- Table 121: Global Rhenium Market Revenue Million Forecast, by Country 2019 & 2032
- Table 122: Global Rhenium Market Volume K Tons Forecast, by Country 2019 & 2032
- Table 123: Saudi Arabia Rhenium Market Revenue (Million) Forecast, by Application 2019 & 2032
- Table 124: Saudi Arabia Rhenium Market Volume (K Tons) Forecast, by Application 2019 & 2032
- Table 125: South Africa Rhenium Market Revenue (Million) Forecast, by Application 2019 & 2032
- Table 126: South Africa Rhenium Market Volume (K Tons) Forecast, by Application 2019 & 2032
- Table 127: Rest of Middle East and Africa Rhenium Market Revenue (Million) Forecast, by Application 2019 & 2032
- Table 128: Rest of Middle East and Africa Rhenium Market Volume (K Tons) Forecast, by Application 2019 & 2032
Frequently Asked Questions
1. What is the projected Compound Annual Growth Rate (CAGR) of the Rhenium Market?
The projected CAGR is approximately 3.3%.
2. Which companies are prominent players in the Rhenium Market?
Key companies in the market include Umicore, Heraeus Holding, MOLYMET S A, KGHM, Colonial Metals Inc, Höganäs AB, American Elements, NEO, H Cross Company, Buss & Buss Spezialmetalle GmbH, Rhenium Alloys Inc.
3. What are the main segments of the Rhenium Market?
The market segments include Application, End-User Industry.
4. Can you provide details about the market size?
The market size is estimated to be USD 168.9 Million as of 2022.
5. What are some drivers contributing to market growth?
; Growth in the Production of Aircraft; Increasing Demand from the Power Industry; Mounting Prominence in Catalyst Applications.
6. What are the notable trends driving market growth?
Aerospace to Dominate the Market.
7. Are there any restraints impacting market growth?
; Growing Usage of Substitutes; Unfavorable Conditions Arising Due to COVID-19 Outbreak.
8. Can you provide examples of recent developments in the market?
N/A
9. What pricing options are available for accessing the report?
Pricing options include single-user, multi-user, and enterprise licenses priced at USD 4750, USD 5250, and USD 8750 respectively.
10. Is the market size provided in terms of value or volume?
The market size is provided in terms of value, measured in Million and volume, measured in K Tons.
11. Are there any specific market keywords associated with the report?
Yes, the market keyword associated with the report is "Rhenium Market," which aids in identifying and referencing the specific market segment covered.
12. How do I determine which pricing option suits my needs best?
The pricing options vary based on user requirements and access needs. Individual users may opt for single-user licenses, while businesses requiring broader access may choose multi-user or enterprise licenses for cost-effective access to the report.
13. Are there any additional resources or data provided in the Rhenium Market report?
While the report offers comprehensive insights, it's advisable to review the specific contents or supplementary materials provided to ascertain if additional resources or data are available.
14. How can I stay updated on further developments or reports in the Rhenium Market?
To stay informed about further developments, trends, and reports in the Rhenium Market, consider subscribing to industry newsletters, following relevant companies and organizations, or regularly checking reputable industry news sources and publications.
Methodology
Step 1 - Identification of Relevant Samples Size from Population Database


Step 2 - Approaches for Defining Global Market Size (Value, Volume* & Price*)

Note*: In applicable scenarios
Step 3 - Data Sources
Primary Research
- Web Analytics
- Survey Reports
- Research Institute
- Latest Research Reports
- Opinion Leaders
Secondary Research
- Annual Reports
- White Paper
- Latest Press Release
- Industry Association
- Paid Database
- Investor Presentations

Step 4 - Data Triangulation
Involves using different sources of information in order to increase the validity of a study
These sources are likely to be stakeholders in a program - participants, other researchers, program staff, other community members, and so on.
Then we put all data in single framework & apply various statistical tools to find out the dynamic on the market.
During the analysis stage, feedback from the stakeholder groups would be compared to determine areas of agreement as well as areas of divergence
