

Key Insights
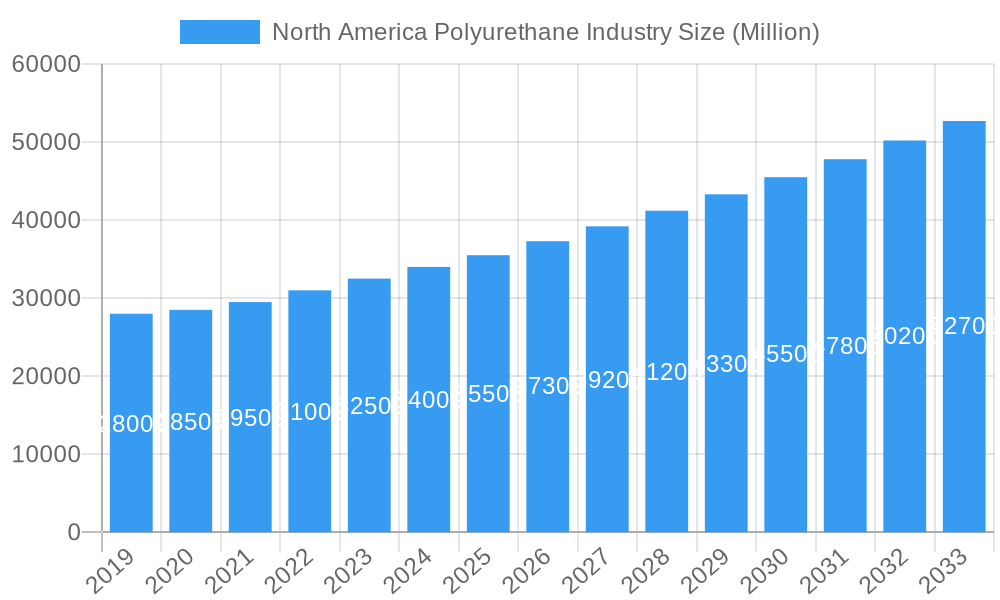
The North American polyurethane market is projected for substantial growth, expected to reach a market size of USD 18.42 billion by 2025, with a CAGR of 6% through 2033. This expansion is driven by increasing demand in key sectors including foams, coatings, adhesives, sealants, and binders. The automotive industry's focus on lightweighting and passenger comfort, coupled with the construction sector's need for insulation and durable materials, are significant growth contributors. Emerging opportunities in electronics, appliances, furniture, and packaging further bolster market expansion. The adoption of advanced, sustainable polyurethane solutions is a key factor in this positive trajectory.
North America Polyurethane Industry Market Size (In Billion)
The North American polyurethane market features prominent global and regional manufacturers. Key players are investing in R&D for sustainable solutions, such as bio-based and recycled polyurethanes, to meet environmental demands. Market challenges include volatile raw material pricing and stringent VOC regulations. However, technological advancements in production and formulation are expected to overcome these obstacles, enabling the industry to leverage opportunities in specialized applications and advanced materials. The region's robust industrial infrastructure and innovation drive position it as a critical player in the global polyurethane sector.
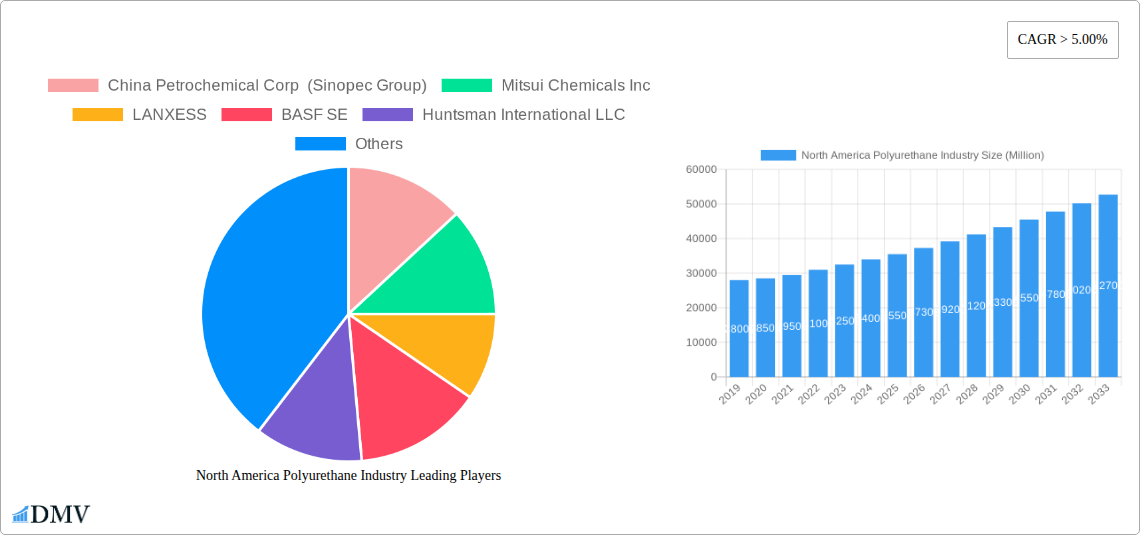
North America Polyurethane Industry Company Market Share
North America Polyurethane Industry Market Composition & Trends
The North America Polyurethane (PU) industry is a dynamic sector characterized by a moderate to high market concentration, with key players like BASF SE, Dow, Covestro AG, and Huntsman International LLC holding significant market shares. Innovation remains a critical catalyst, driven by continuous research and development into advanced PU formulations for enhanced performance, sustainability, and diverse applications. Regulatory landscapes, particularly concerning environmental standards and chemical safety, are increasingly shaping product development and market access. The threat of substitute products, while present in certain applications, is often mitigated by the superior performance characteristics of polyurethanes, such as durability, flexibility, and insulation properties. End-user profiles are diverse, ranging from demanding automotive manufacturers to sustainability-conscious construction firms. Mergers and acquisitions (M&A) activity plays a vital role in market consolidation and strategic expansion. For instance, significant M&A deal values, estimated to be in the range of $50 Million to $500 Million in recent years, have reshaped the competitive landscape, enabling companies to broaden their product portfolios and geographical reach. The market share distribution is largely dictated by the dominance of PU foams in insulation and automotive applications, followed by coatings, adhesives, sealants, and binders (CASB).
- Market Concentration: Dominated by a few key global chemical giants with substantial market share.
- Innovation Catalysts: Focus on sustainable PU solutions, bio-based polyols, and improved fire retardancy.
- Regulatory Landscape: Stringent environmental regulations (e.g., VOC emissions) are driving innovation in low-VOC and water-based PU systems.
- Substitute Products: Competition from materials like EPS foam, mineral wool, and epoxies in specific applications.
- End-user Profiles: Diverse, including automotive, construction, furniture, electronics, and packaging sectors.
- M&A Activities: Strategic acquisitions aimed at expanding product lines, market access, and technological capabilities.
North America Polyurethane Industry Industry Evolution
The North America Polyurethane Industry has witnessed a remarkable evolution driven by a confluence of technological advancements, shifting consumer preferences, and robust market growth trajectories. From its early development as a versatile polymer, PU has transformed into an indispensable material across a vast array of applications. The study period of 2019–2033, with a base year of 2025 and a forecast period extending to 2033, paints a picture of consistent expansion. Historical data from 2019–2024 indicates a steady Compound Annual Growth Rate (CAGR) of approximately 4.5%, fueled by burgeoning demand in the Building and Construction sector for energy-efficient insulation solutions. Technological advancements have been central to this growth, with innovations in catalysis and processing leading to the development of high-performance polyurethanes with improved mechanical properties, enhanced fire resistance, and superior durability. The introduction of bio-based polyols and recycled PU materials has further propelled the industry towards greater sustainability, aligning with evolving environmental consciousness among end-users. Consumer demand has increasingly favored materials that offer both performance and ecological benefits, pushing manufacturers to invest heavily in green chemistry and circular economy initiatives. The automotive industry, for example, is a major adopter of lightweight PU components that contribute to fuel efficiency, while the furniture sector leverages PU foams for comfort and longevity. The estimated market value for the North America Polyurethane Industry is projected to reach $XX Million by 2025, with a substantial growth forecast to $YY Million by 2033. This sustained expansion is underpinned by continued investment in research and development, leading to novel applications in electronics, medical devices, and advanced textiles. The industry's ability to adapt to evolving regulatory requirements, such as stricter emissions standards, has also been a critical factor in its sustained success, fostering a landscape where innovation and market demand are intrinsically linked.
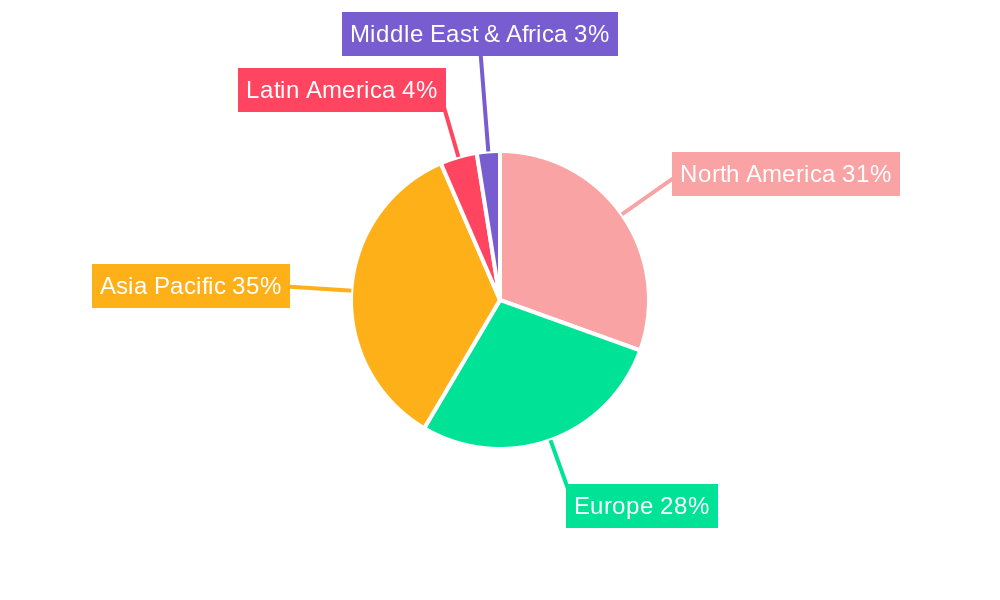
Leading Regions, Countries, or Segments in North America Polyurethane Industry
The North America Polyurethane Industry's dominance is largely attributed to the United States, which consistently leads in terms of market size, technological adoption, and innovation. This leadership stems from a robust industrial base, significant investments in research and development by major chemical corporations like BASF SE and Dow, and a strong demand across key end-user industries. The Building and Construction segment is a primary driver of this dominance, with a continuous need for highly effective insulation materials like rigid PU foams to meet stringent energy efficiency codes and sustainability mandates. Investment trends in the U.S. favor materials that offer long-term cost savings through energy conservation, making polyurethanes an attractive choice. Regulatory support, such as government incentives for green building and energy-efficient retrofits, further bolsters demand.
Within the broader application segments, Foams remain the largest and most influential category, accounting for an estimated 60% of the total North American PU market. This is primarily driven by their widespread use in:
- Building and Construction: Rigid PU foams for wall and roof insulation, spray foam insulation, and structural insulated panels (SIPs). The market for these applications is valued at over $XX Million, driven by new construction and renovation projects.
- Furniture and Interiors: Flexible PU foams for cushioning in mattresses, upholstery, and seating. This segment contributes an estimated $YY Million to the market, fueled by growing consumer demand for comfort and durability.
- Automotive and Transportation: Flexible and rigid PU foams for seating, dashboards, headliners, and sound dampening. The automotive sector alone represents a significant market share, estimated at $ZZ Million, due to the material's lightweight properties and ability to enhance safety and comfort.
The Automotive and Transportation end-user industry is another critical pillar of the North American PU market, showcasing strong growth and innovation. The demand for lightweight materials that improve fuel efficiency and reduce emissions continues to drive the adoption of PU components in vehicles. Factors influencing this segment's growth include:
- Technological Advancements: Development of advanced PU composites and elastomers for enhanced performance and design flexibility.
- Stringent Emission Standards: Increasing pressure on automakers to reduce vehicle weight, making PU an ideal solution.
- Consumer Demand for Comfort and Safety: Polyurethanes contribute significantly to vehicle interiors, offering superior cushioning, noise reduction, and impact absorption.
While the United States stands out as the leading country, Canada also plays a significant role, particularly in the Building and Construction and Automotive sectors, influenced by similar economic drivers and environmental policies. Mexico is emerging as a key manufacturing hub, especially for automotive components, further contributing to the overall regional demand for polyurethanes. The Rest of North America, though smaller in market share, represents a growing opportunity, especially in niche applications and emerging markets. The overall forecast for these leading segments and regions indicates sustained growth, with the market expected to reach an estimated $AA Million by 2025 and $BB Million by 2033, underscoring the enduring importance of polyurethanes in the North American economy.
North America Polyurethane Industry Product Innovations
The North America Polyurethane Industry is continually revitalized by groundbreaking product innovations. Recent advancements include the development of bio-based polyols derived from renewable resources, offering a sustainable alternative to petrochemical-based feedstocks and reducing the carbon footprint of PU products. Furthermore, innovation in flame-retardant PU systems is addressing stringent safety regulations in construction and transportation, enhancing fire resistance without compromising material performance. The introduction of closed-cell rigid PU foams with ultra-low global warming potential (GWP) blowing agents is a significant step towards environmental responsibility. These innovations translate into enhanced insulation efficiency in buildings, improved durability and lightweighting in automotive components, and more comfortable and safer consumer goods.
Propelling Factors for North America Polyurethane Industry Growth
Several key factors are propelling the growth of the North America Polyurethane Industry. The increasing demand for energy-efficient solutions in the Building and Construction sector, driven by stringent building codes and consumer awareness, is a major catalyst for rigid PU foam insulation. In the Automotive and Transportation sector, lightweighting initiatives aimed at improving fuel efficiency and reducing emissions continue to boost the adoption of PU components. Technological advancements in PU formulations, leading to enhanced performance characteristics such as durability, flexibility, and thermal insulation, are also significant growth drivers. Furthermore, the growing preference for sustainable and eco-friendly materials is spurring innovation in bio-based and recycled polyurethanes.
Obstacles in the North America Polyurethane Industry Market
Despite its robust growth, the North America Polyurethane Industry faces several obstacles. Volatile raw material prices, particularly for petrochemical feedstocks like crude oil, can impact profitability and pricing strategies. Increasing regulatory scrutiny concerning the environmental impact and health effects of certain PU components, such as isocyanates and blowing agents, necessitates continuous investment in safer alternatives and compliance measures. Supply chain disruptions, exacerbated by global events, can lead to material shortages and increased lead times, affecting production schedules. Intense competition from alternative materials like expanded polystyrene (EPS) and mineral wool in specific applications also presents a restraint. The estimated impact of these challenges could lead to a slight deceleration in growth, potentially reducing the projected CAGR by 0.5% to 1%.
Future Opportunities in North America Polyurethane Industry
The North America Polyurethane Industry is poised for significant future opportunities. The burgeoning demand for sustainable and bio-based polyurethanes presents a major growth avenue, aligning with global environmental initiatives and consumer preferences. Emerging applications in advanced composites for renewable energy infrastructure, such as wind turbine blades, offer substantial potential. The increasing adoption of smart and advanced materials in the Electronics and Appliances sector, where PU's insulating and protective properties are highly valued, also represents a promising market. Furthermore, innovations in 3D printing with polyurethanes are opening new avenues for customized product development and manufacturing efficiencies across various industries.
Major Players in the North America Polyurethane Industry Ecosystem
- China Petrochemical Corp (Sinopec Group)
- Mitsui Chemicals Inc
- LANXESS
- BASF SE
- Huntsman International LLC
- Fujian Southeast Electrochemical Co Ltd
- Dow
- Covestro AG
- Tosoh Corporation
- Perstorp
Key Developments in North America Polyurethane Industry Industry
- 2023/08: BASF SE announced a significant investment in expanding its bio-based polyol production capacity in North America to meet growing demand for sustainable PU solutions.
- 2023/05: Huntsman International LLC launched a new line of low-VOC polyurethane coatings for the automotive refinish market, enhancing environmental compliance.
- 2022/11: Covestro AG acquired a leading producer of recycled polyols, strengthening its commitment to the circular economy within the PU industry.
- 2022/07: Dow introduced a novel PU foam system with enhanced thermal performance for the building insulation sector, contributing to greater energy efficiency.
- 2021/04: LANXESS expanded its portfolio of flame retardants specifically designed for polyurethane applications in furniture and construction.
Strategic North America Polyurethane Industry Market Forecast
The strategic North America Polyurethane Industry market forecast indicates a trajectory of robust and sustained growth. Key growth catalysts include the accelerating demand for sustainable and bio-based PU alternatives, driven by stringent environmental regulations and increasing consumer preference for eco-friendly products. The ongoing expansion of the Building and Construction sector, coupled with the automotive industry's persistent need for lightweight and high-performance materials, will continue to fuel demand. Innovations in material science, leading to enhanced durability, thermal insulation, and safety features, will further solidify polyurethanes' position across diverse applications. The market potential is substantial, with significant opportunities in emerging sectors and the continuous development of novel PU formulations to meet evolving industrial and consumer needs.
North America Polyurethane Industry Segmentation
-
1. Application
- 1.1. Foams
- 1.2. Coatings
- 1.3. Adhesives, Sealants, and Binders
- 1.4. Elastomers
- 1.5. Other Applications
-
2. End-user Industry
- 2.1. Furniture and Interiors
- 2.2. Building and Construction
- 2.3. Electronics and Appliances
- 2.4. Automotive and Transportation
- 2.5. Packaging
- 2.6. Other End-user Industries
-
3. Geography
- 3.1. United States
- 3.2. Mexico
- 3.3. Canada
- 3.4. Rest of North America
North America Polyurethane Industry Segmentation By Geography
- 1. United States
- 2. Mexico
- 3. Canada
- 4. Rest of North America
North America Polyurethane Industry Regional Market Share
Geographic Coverage of North America Polyurethane Industry
North America Polyurethane Industry REPORT HIGHLIGHTS
| Aspects | Details |
|---|---|
| Study Period | 2020-2034 |
| Base Year | 2025 |
| Estimated Year | 2026 |
| Forecast Period | 2026-2034 |
| Historical Period | 2020-2025 |
| Growth Rate | CAGR of 6% from 2020-2034 |
| Segmentation |
|
Table of Contents
- 1. Introduction
- 1.1. Research Scope
- 1.2. Market Segmentation
- 1.3. Research Objective
- 1.4. Definitions and Assumptions
- 2. Executive Summary
- 2.1. Market Snapshot
- 3. Market Dynamics
- 3.1. Market Drivers
- 3.2. Market Restrains
- 3.3. Market Trends
- 3.4. Market Opportunities
- 4. Market Factor Analysis
- 4.1. Porters Five Forces
- 4.1.1. Bargaining Power of Suppliers
- 4.1.2. Bargaining Power of Buyers
- 4.1.3. Threat of New Entrants
- 4.1.4. Threat of Substitutes
- 4.1.5. Competitive Rivalry
- 4.2. PESTEL analysis
- 4.3. BCG Analysis
- 4.3.1. Stars (High Growth, High Market Share)
- 4.3.2. Cash Cows (Low Growth, High Market Share)
- 4.3.3. Question Mark (High Growth, Low Market Share)
- 4.3.4. Dogs (Low Growth, Low Market Share)
- 4.4. Ansoff Matrix Analysis
- 4.5. Supply Chain Analysis
- 4.6. Regulatory Landscape
- 4.7. Current Market Potential and Opportunity Assessment (TAM–SAM–SOM Framework)
- 4.8. DMV Analyst Note
- 4.1. Porters Five Forces
- 5. Market Analysis, Insights and Forecast 2021-2033
- 5.1. Market Analysis, Insights and Forecast - by Application
- 5.1.1. Foams
- 5.1.2. Coatings
- 5.1.3. Adhesives, Sealants, and Binders
- 5.1.4. Elastomers
- 5.1.5. Other Applications
- 5.2. Market Analysis, Insights and Forecast - by End-user Industry
- 5.2.1. Furniture and Interiors
- 5.2.2. Building and Construction
- 5.2.3. Electronics and Appliances
- 5.2.4. Automotive and Transportation
- 5.2.5. Packaging
- 5.2.6. Other End-user Industries
- 5.3. Market Analysis, Insights and Forecast - by Geography
- 5.3.1. United States
- 5.3.2. Mexico
- 5.3.3. Canada
- 5.3.4. Rest of North America
- 5.4. Market Analysis, Insights and Forecast - by Region
- 5.4.1. United States
- 5.4.2. Mexico
- 5.4.3. Canada
- 5.4.4. Rest of North America
- 5.1. Market Analysis, Insights and Forecast - by Application
- 6. North America Polyurethane Industry Analysis, Insights and Forecast, 2021-2033
- 6.1. Market Analysis, Insights and Forecast - by Application
- 6.1.1. Foams
- 6.1.2. Coatings
- 6.1.3. Adhesives, Sealants, and Binders
- 6.1.4. Elastomers
- 6.1.5. Other Applications
- 6.2. Market Analysis, Insights and Forecast - by End-user Industry
- 6.2.1. Furniture and Interiors
- 6.2.2. Building and Construction
- 6.2.3. Electronics and Appliances
- 6.2.4. Automotive and Transportation
- 6.2.5. Packaging
- 6.2.6. Other End-user Industries
- 6.3. Market Analysis, Insights and Forecast - by Geography
- 6.3.1. United States
- 6.3.2. Mexico
- 6.3.3. Canada
- 6.3.4. Rest of North America
- 6.1. Market Analysis, Insights and Forecast - by Application
- 7. United States North America Polyurethane Industry Analysis, Insights and Forecast, 2020-2032
- 7.1. Market Analysis, Insights and Forecast - by Application
- 7.1.1. Foams
- 7.1.2. Coatings
- 7.1.3. Adhesives, Sealants, and Binders
- 7.1.4. Elastomers
- 7.1.5. Other Applications
- 7.2. Market Analysis, Insights and Forecast - by End-user Industry
- 7.2.1. Furniture and Interiors
- 7.2.2. Building and Construction
- 7.2.3. Electronics and Appliances
- 7.2.4. Automotive and Transportation
- 7.2.5. Packaging
- 7.2.6. Other End-user Industries
- 7.3. Market Analysis, Insights and Forecast - by Geography
- 7.3.1. United States
- 7.3.2. Mexico
- 7.3.3. Canada
- 7.3.4. Rest of North America
- 7.1. Market Analysis, Insights and Forecast - by Application
- 8. Mexico North America Polyurethane Industry Analysis, Insights and Forecast, 2020-2032
- 8.1. Market Analysis, Insights and Forecast - by Application
- 8.1.1. Foams
- 8.1.2. Coatings
- 8.1.3. Adhesives, Sealants, and Binders
- 8.1.4. Elastomers
- 8.1.5. Other Applications
- 8.2. Market Analysis, Insights and Forecast - by End-user Industry
- 8.2.1. Furniture and Interiors
- 8.2.2. Building and Construction
- 8.2.3. Electronics and Appliances
- 8.2.4. Automotive and Transportation
- 8.2.5. Packaging
- 8.2.6. Other End-user Industries
- 8.3. Market Analysis, Insights and Forecast - by Geography
- 8.3.1. United States
- 8.3.2. Mexico
- 8.3.3. Canada
- 8.3.4. Rest of North America
- 8.1. Market Analysis, Insights and Forecast - by Application
- 9. Canada North America Polyurethane Industry Analysis, Insights and Forecast, 2020-2032
- 9.1. Market Analysis, Insights and Forecast - by Application
- 9.1.1. Foams
- 9.1.2. Coatings
- 9.1.3. Adhesives, Sealants, and Binders
- 9.1.4. Elastomers
- 9.1.5. Other Applications
- 9.2. Market Analysis, Insights and Forecast - by End-user Industry
- 9.2.1. Furniture and Interiors
- 9.2.2. Building and Construction
- 9.2.3. Electronics and Appliances
- 9.2.4. Automotive and Transportation
- 9.2.5. Packaging
- 9.2.6. Other End-user Industries
- 9.3. Market Analysis, Insights and Forecast - by Geography
- 9.3.1. United States
- 9.3.2. Mexico
- 9.3.3. Canada
- 9.3.4. Rest of North America
- 9.1. Market Analysis, Insights and Forecast - by Application
- 10. Rest of North America North America Polyurethane Industry Analysis, Insights and Forecast, 2020-2032
- 10.1. Market Analysis, Insights and Forecast - by Application
- 10.1.1. Foams
- 10.1.2. Coatings
- 10.1.3. Adhesives, Sealants, and Binders
- 10.1.4. Elastomers
- 10.1.5. Other Applications
- 10.2. Market Analysis, Insights and Forecast - by End-user Industry
- 10.2.1. Furniture and Interiors
- 10.2.2. Building and Construction
- 10.2.3. Electronics and Appliances
- 10.2.4. Automotive and Transportation
- 10.2.5. Packaging
- 10.2.6. Other End-user Industries
- 10.3. Market Analysis, Insights and Forecast - by Geography
- 10.3.1. United States
- 10.3.2. Mexico
- 10.3.3. Canada
- 10.3.4. Rest of North America
- 10.1. Market Analysis, Insights and Forecast - by Application
- 11. Competitive Analysis
- 11.1. Company Profiles
- 11.1.1 China Petrochemical Corp (Sinopec Group)
- 11.1.1.1. Company Overview
- 11.1.1.2. Products
- 11.1.1.3. Company Financials
- 11.1.1.4. SWOT Analysis
- 11.1.2 Mitsui Chemicals Inc
- 11.1.2.1. Company Overview
- 11.1.2.2. Products
- 11.1.2.3. Company Financials
- 11.1.2.4. SWOT Analysis
- 11.1.3 LANXESS
- 11.1.3.1. Company Overview
- 11.1.3.2. Products
- 11.1.3.3. Company Financials
- 11.1.3.4. SWOT Analysis
- 11.1.4 BASF SE
- 11.1.4.1. Company Overview
- 11.1.4.2. Products
- 11.1.4.3. Company Financials
- 11.1.4.4. SWOT Analysis
- 11.1.5 Huntsman International LLC
- 11.1.5.1. Company Overview
- 11.1.5.2. Products
- 11.1.5.3. Company Financials
- 11.1.5.4. SWOT Analysis
- 11.1.6 Fujian Southeast Electrochemical Co Ltd
- 11.1.6.1. Company Overview
- 11.1.6.2. Products
- 11.1.6.3. Company Financials
- 11.1.6.4. SWOT Analysis
- 11.1.7 Dow
- 11.1.7.1. Company Overview
- 11.1.7.2. Products
- 11.1.7.3. Company Financials
- 11.1.7.4. SWOT Analysis
- 11.1.8 Covestro AG
- 11.1.8.1. Company Overview
- 11.1.8.2. Products
- 11.1.8.3. Company Financials
- 11.1.8.4. SWOT Analysis
- 11.1.9 Tosoh Corporation
- 11.1.9.1. Company Overview
- 11.1.9.2. Products
- 11.1.9.3. Company Financials
- 11.1.9.4. SWOT Analysis
- 11.1.10 Perstorp
- 11.1.10.1. Company Overview
- 11.1.10.2. Products
- 11.1.10.3. Company Financials
- 11.1.10.4. SWOT Analysis
- 11.1.1 China Petrochemical Corp (Sinopec Group)
- 11.2. Market Entropy
- 11.2.1 Company's Key Areas Served
- 11.2.2 Recent Developments
- 11.3. Company Market Share Analysis 2025
- 11.3.1 Top 5 Companies Market Share Analysis
- 11.3.2 Top 3 Companies Market Share Analysis
- 11.4. List of Potential Customers
- 12. Research Methodology
List of Figures
- Figure 1: North America Polyurethane Industry Revenue Breakdown (billion, %) by Product 2025 & 2033
- Figure 2: North America Polyurethane Industry Share (%) by Company 2025
List of Tables
- Table 1: North America Polyurethane Industry Revenue billion Forecast, by Application 2020 & 2033
- Table 2: North America Polyurethane Industry Volume kilograms per cubic meter Forecast, by Application 2020 & 2033
- Table 3: North America Polyurethane Industry Revenue billion Forecast, by End-user Industry 2020 & 2033
- Table 4: North America Polyurethane Industry Volume kilograms per cubic meter Forecast, by End-user Industry 2020 & 2033
- Table 5: North America Polyurethane Industry Revenue billion Forecast, by Geography 2020 & 2033
- Table 6: North America Polyurethane Industry Volume kilograms per cubic meter Forecast, by Geography 2020 & 2033
- Table 7: North America Polyurethane Industry Revenue billion Forecast, by Region 2020 & 2033
- Table 8: North America Polyurethane Industry Volume kilograms per cubic meter Forecast, by Region 2020 & 2033
- Table 9: North America Polyurethane Industry Revenue billion Forecast, by Application 2020 & 2033
- Table 10: North America Polyurethane Industry Volume kilograms per cubic meter Forecast, by Application 2020 & 2033
- Table 11: North America Polyurethane Industry Revenue billion Forecast, by End-user Industry 2020 & 2033
- Table 12: North America Polyurethane Industry Volume kilograms per cubic meter Forecast, by End-user Industry 2020 & 2033
- Table 13: North America Polyurethane Industry Revenue billion Forecast, by Geography 2020 & 2033
- Table 14: North America Polyurethane Industry Volume kilograms per cubic meter Forecast, by Geography 2020 & 2033
- Table 15: North America Polyurethane Industry Revenue billion Forecast, by Country 2020 & 2033
- Table 16: North America Polyurethane Industry Volume kilograms per cubic meter Forecast, by Country 2020 & 2033
- Table 17: North America Polyurethane Industry Revenue billion Forecast, by Application 2020 & 2033
- Table 18: North America Polyurethane Industry Volume kilograms per cubic meter Forecast, by Application 2020 & 2033
- Table 19: North America Polyurethane Industry Revenue billion Forecast, by End-user Industry 2020 & 2033
- Table 20: North America Polyurethane Industry Volume kilograms per cubic meter Forecast, by End-user Industry 2020 & 2033
- Table 21: North America Polyurethane Industry Revenue billion Forecast, by Geography 2020 & 2033
- Table 22: North America Polyurethane Industry Volume kilograms per cubic meter Forecast, by Geography 2020 & 2033
- Table 23: North America Polyurethane Industry Revenue billion Forecast, by Country 2020 & 2033
- Table 24: North America Polyurethane Industry Volume kilograms per cubic meter Forecast, by Country 2020 & 2033
- Table 25: North America Polyurethane Industry Revenue billion Forecast, by Application 2020 & 2033
- Table 26: North America Polyurethane Industry Volume kilograms per cubic meter Forecast, by Application 2020 & 2033
- Table 27: North America Polyurethane Industry Revenue billion Forecast, by End-user Industry 2020 & 2033
- Table 28: North America Polyurethane Industry Volume kilograms per cubic meter Forecast, by End-user Industry 2020 & 2033
- Table 29: North America Polyurethane Industry Revenue billion Forecast, by Geography 2020 & 2033
- Table 30: North America Polyurethane Industry Volume kilograms per cubic meter Forecast, by Geography 2020 & 2033
- Table 31: North America Polyurethane Industry Revenue billion Forecast, by Country 2020 & 2033
- Table 32: North America Polyurethane Industry Volume kilograms per cubic meter Forecast, by Country 2020 & 2033
- Table 33: North America Polyurethane Industry Revenue billion Forecast, by Application 2020 & 2033
- Table 34: North America Polyurethane Industry Volume kilograms per cubic meter Forecast, by Application 2020 & 2033
- Table 35: North America Polyurethane Industry Revenue billion Forecast, by End-user Industry 2020 & 2033
- Table 36: North America Polyurethane Industry Volume kilograms per cubic meter Forecast, by End-user Industry 2020 & 2033
- Table 37: North America Polyurethane Industry Revenue billion Forecast, by Geography 2020 & 2033
- Table 38: North America Polyurethane Industry Volume kilograms per cubic meter Forecast, by Geography 2020 & 2033
- Table 39: North America Polyurethane Industry Revenue billion Forecast, by Country 2020 & 2033
- Table 40: North America Polyurethane Industry Volume kilograms per cubic meter Forecast, by Country 2020 & 2033
Frequently Asked Questions
1. What is the projected Compound Annual Growth Rate (CAGR) of the North America Polyurethane Industry?
The projected CAGR is approximately 6%.
2. Which companies are prominent players in the North America Polyurethane Industry?
Key companies in the market include China Petrochemical Corp (Sinopec Group), Mitsui Chemicals Inc, LANXESS, BASF SE, Huntsman International LLC, Fujian Southeast Electrochemical Co Ltd, Dow, Covestro AG, Tosoh Corporation, Perstorp.
3. What are the main segments of the North America Polyurethane Industry?
The market segments include Application, End-user Industry, Geography.
4. Can you provide details about the market size?
The market size is estimated to be USD 18.42 billion as of 2022.
5. What are some drivers contributing to market growth?
; Increasing Use of Durable Plastics in Construction; Increasing Emphasis on Recycling.
6. What are the notable trends driving market growth?
Foams Application is Expected to Hold the Largest Share of the Application Segment.
7. Are there any restraints impacting market growth?
; Volatile Raw Material Prices; Competition from Polystyrene and Polypropylene Foam.
8. Can you provide examples of recent developments in the market?
N/A
9. What pricing options are available for accessing the report?
Pricing options include single-user, multi-user, and enterprise licenses priced at USD 4750, USD 5250, and USD 8750 respectively.
10. Is the market size provided in terms of value or volume?
The market size is provided in terms of value, measured in billion and volume, measured in kilograms per cubic meter.
11. Are there any specific market keywords associated with the report?
Yes, the market keyword associated with the report is "North America Polyurethane Industry," which aids in identifying and referencing the specific market segment covered.
12. How do I determine which pricing option suits my needs best?
The pricing options vary based on user requirements and access needs. Individual users may opt for single-user licenses, while businesses requiring broader access may choose multi-user or enterprise licenses for cost-effective access to the report.
13. Are there any additional resources or data provided in the North America Polyurethane Industry report?
While the report offers comprehensive insights, it's advisable to review the specific contents or supplementary materials provided to ascertain if additional resources or data are available.
14. How can I stay updated on further developments or reports in the North America Polyurethane Industry?
To stay informed about further developments, trends, and reports in the North America Polyurethane Industry, consider subscribing to industry newsletters, following relevant companies and organizations, or regularly checking reputable industry news sources and publications.
Methodology
Step 1 - Identification of Relevant Samples Size from Population Database


Step 2 - Approaches for Defining Global Market Size (Value, Volume* & Price*)

Note*: In applicable scenarios
Step 3 - Data Sources
Primary Research
- Web Analytics
- Survey Reports
- Research Institute
- Latest Research Reports
- Opinion Leaders
Secondary Research
- Annual Reports
- White Paper
- Latest Press Release
- Industry Association
- Paid Database
- Investor Presentations

Step 4 - Data Triangulation
Involves using different sources of information in order to increase the validity of a study
These sources are likely to be stakeholders in a program - participants, other researchers, program staff, other community members, and so on.
Then we put all data in single framework & apply various statistical tools to find out the dynamic on the market.
During the analysis stage, feedback from the stakeholder groups would be compared to determine areas of agreement as well as areas of divergence