

Key Insights
The global Low Foam Surfactants market is poised for robust growth, currently valued at an estimated USD 14.35 billion. This expansion is driven by an increasing demand for cleaning agents and industrial process chemicals that offer superior performance with minimal foam generation. Key sectors such as detergents and cleaning agents, agrochemicals, and food and dairy process cleaners are experiencing a significant uplift in the adoption of low foam surfactants. This surge is attributed to the inherent advantages they offer, including reduced water usage in rinsing cycles, enhanced efficiency in automated cleaning systems, and improved product aesthetics in consumer goods. The growing environmental consciousness among consumers and industries is also a pivotal driver, as low foam formulations often lead to more concentrated products, reducing packaging waste and transportation emissions. Furthermore, advancements in surfactant technology are continuously yielding innovative products with tailored foaming profiles and enhanced biodegradability, catering to evolving regulatory landscapes and sustainability mandates.
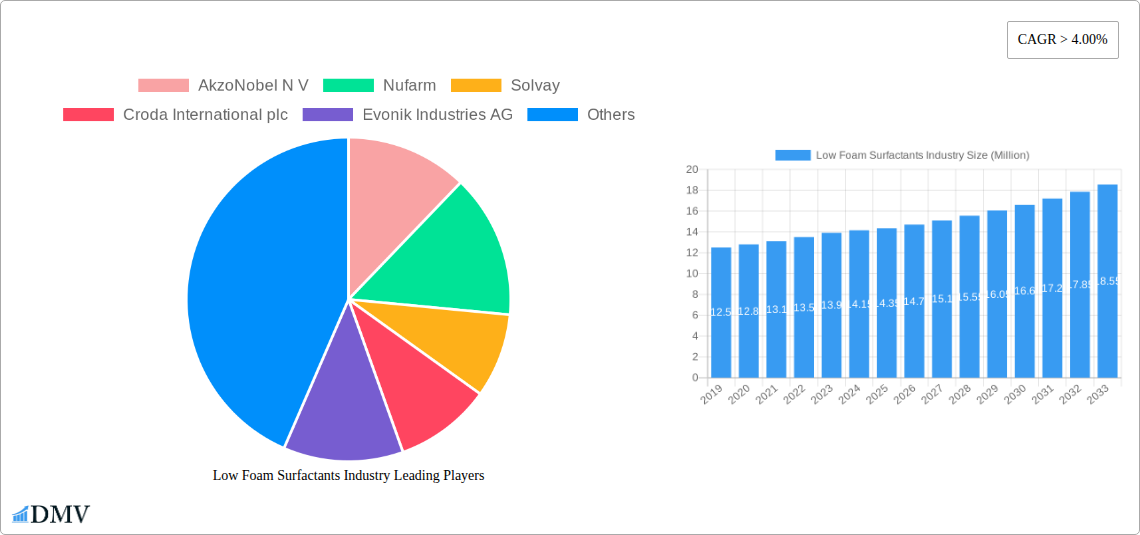
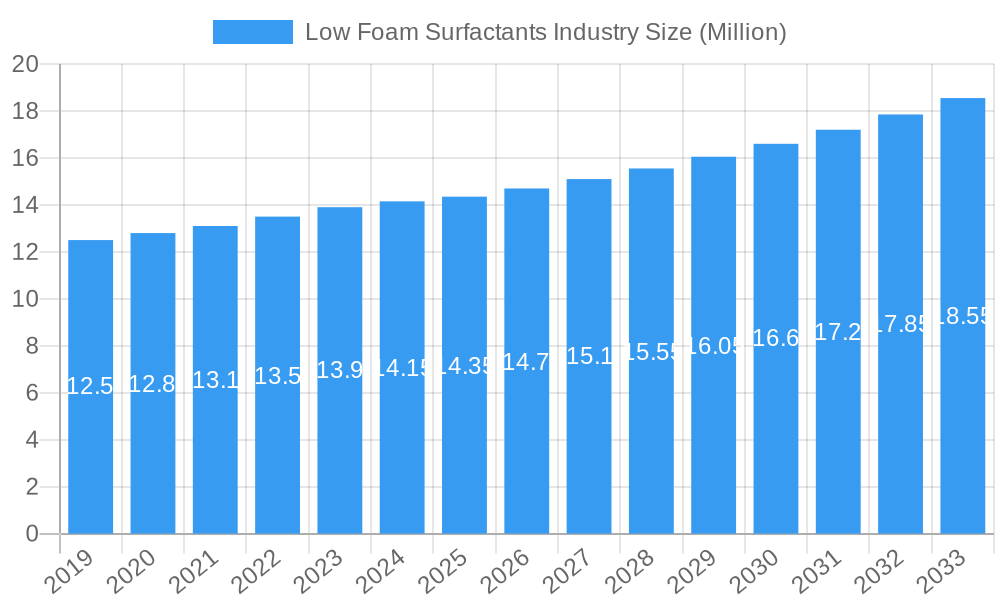
Low Foam Surfactants Industry Market Size (In Million)
The market is projected to witness a Compound Annual Growth Rate (CAGR) exceeding 4.00% over the forecast period of 2025-2033. This sustained growth trajectory is underpinned by a confluence of factors, including the expanding industrial base in emerging economies and the continuous innovation within the surfactant manufacturing sector. Key trends shaping the market include the development of bio-based and renewable surfactants, offering eco-friendly alternatives to traditional petrochemical-derived products. The pulp and paper industry, metal cleaning, and oilfield chemicals sectors are also significant contributors to market growth, leveraging low foam surfactants for their specialized operational requirements. Despite the promising outlook, certain restraints such as fluctuating raw material prices and intense market competition may present challenges. However, the ongoing research and development initiatives focused on performance enhancement and cost-effectiveness are expected to mitigate these challenges, ensuring a dynamic and expanding market for low foam surfactants.
Low Foam Surfactants Industry Company Market Share
This in-depth report provides a strategic overview of the global Low Foam Surfactants industry, offering unparalleled insights into market dynamics, technological advancements, and future growth trajectories. Covering a comprehensive study period from 2019 to 2033, with a detailed analysis of the base year 2025 and a robust forecast period of 2025-2033, this report is an indispensable resource for stakeholders seeking to navigate this evolving market. Our expert analysis leverages high-ranking keywords to ensure maximum visibility and deliver actionable intelligence for chemical manufacturers, formulators, investors, and end-users across diverse sectors.
Low Foam Surfactants Industry Market Composition & Trends
The global Low Foam Surfactants market is characterized by a moderate concentration of key players, driven by continuous innovation and stringent regulatory landscapes. The demand for high-performance, environmentally friendly surfactants is a significant catalyst for market growth. Substitute products, while present, often fall short of the specific low-foaming properties required in sensitive applications. End-user profiles are diverse, with strong demand emanating from Agrochemicals, Detergents and Cleaning Agents, and Pulp and Paper industries. Mergers and acquisition activities, while not at an exceptionally high volume, have seen significant deal values as companies seek to consolidate market share and expand their product portfolios. For instance, the market share distribution indicates that non-ionic surfactants hold a dominant position, accounting for approximately 50% of the total market value. M&A deals in the past five years have averaged values in the hundreds of millions, reflecting strategic consolidations.
Low Foam Surfactants Industry Industry Evolution
The Low Foam Surfactants industry has witnessed a remarkable evolutionary journey, marked by consistent market growth and significant technological advancements over the historical period of 2019-2024. The global market for low foam surfactants is projected to grow at a Compound Annual Growth Rate (CAGR) of approximately 5.5% from 2025 to 2033, driven by increasing demand for specialized cleaning solutions in industrial and household applications. Consumer demand has been a pivotal force, shifting towards products with enhanced performance, biodegradability, and reduced environmental impact. This evolution has spurred innovation in surfactant chemistry, leading to the development of novel formulations capable of delivering superior cleaning efficacy with minimal foam generation.
Technological advancements have played a crucial role in this evolution. The introduction of new synthesis methods and the refinement of existing ones have allowed for the production of more efficient and sustainable low foam surfactants. For example, advancements in ethoxylation and propoxylation technologies have enabled formulators to precisely control the hydrophilic-lipophilic balance (HLB) of surfactants, tailoring their performance for specific applications. Adoption metrics for high-performance non-ionic surfactants, particularly in industrial cleaning, have surged by over 20% in the last three years. Furthermore, the increasing focus on green chemistry has led to a greater emphasis on bio-based and biodegradable surfactant options, a trend that is expected to accelerate in the forecast period. This shift is also supported by regulatory initiatives promoting the use of eco-friendly chemical ingredients, further shaping the industry's growth trajectory. The market's ability to adapt to these evolving demands and technological landscapes underscores its resilience and potential for sustained growth.
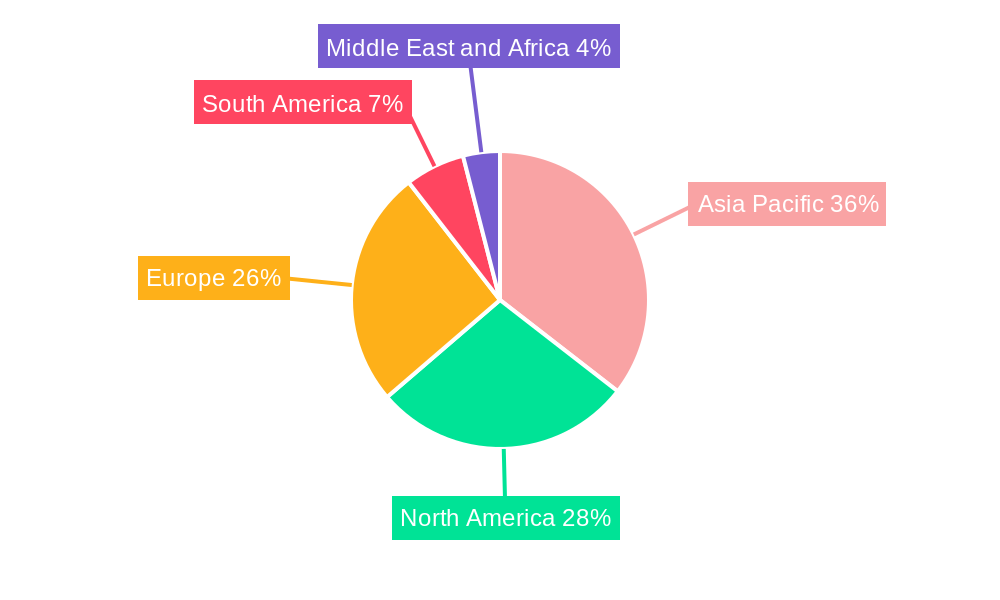
Leading Regions, Countries, or Segments in Low Foam Surfactants Industry
The global Low Foam Surfactants market exhibits distinct regional and segmental dominance, driven by a confluence of economic factors, regulatory landscapes, and end-user industry demands. Among the different surfactant types, non-ionic surfactants consistently hold the largest market share, estimated at over 50% of the total market value in 2025. Their versatility and compatibility with various formulations make them indispensable across numerous applications.
In terms of end-user industries, Detergents and Cleaning Agents and Agrochemicals are the primary growth engines. The escalating demand for effective and low-foaming cleaning solutions in both household and industrial settings, coupled with the need for efficient and specialized formulations in agriculture, propels the consumption of low foam surfactants. The Food and Dairy Process Cleaners segment also presents significant growth potential due to stringent hygiene standards and the requirement for non-foaming cleaning agents that do not interfere with processing.
Geographically, North America and Europe currently lead the market, owing to established industrial bases, advanced technological infrastructure, and strong consumer awareness regarding product performance and environmental impact. However, the Asia-Pacific region is emerging as a rapid growth hotbed, driven by industrialization, a burgeoning middle class, and increasing investments in manufacturing sectors, particularly in China and India.
Key drivers for regional dominance include:
- Investment Trends: Significant R&D investments by major players like BASF SE, Dow, and Evonik Industries AG in these leading regions, focusing on product innovation and capacity expansion.
- Regulatory Support: Stringent environmental regulations in North America and Europe, which encourage the adoption of eco-friendly and high-performance surfactants, indirectly boosting the low foam segment.
- End-User Industry Presence: The substantial presence of key end-user industries such as automotive (for metal cleaning and metal working fluids), textiles, and personal care in these dominant regions.
- Technological Adoption: Higher adoption rates of advanced cleaning technologies and formulations that specifically require low foam surfactants.
The dominance of these segments and regions is further underscored by specific market data, with the non-ionic surfactant segment alone valued at an estimated $3,500 Million in 2025. The Detergents and Cleaning Agents sector is expected to contribute over $2,000 Million to the market value in the same year.
Low Foam Surfactants Industry Product Innovations
Product innovation in the Low Foam Surfactants industry is relentlessly focused on enhancing performance while minimizing environmental impact. Leading companies are developing novel surfactant architectures and blends that offer superior detergency, wetting, and emulsification properties with significantly reduced foam profiles. For instance, advanced non-ionic surfactant blends, like BASF SE's Dehypound M and Dehypound HDG, are engineered for multi-soil, multi-application cleaning, demonstrating exceptional degreasing capabilities without excessive foaming. Furthermore, the industry is witnessing a surge in bio-based surfactants, exemplified by Clariant's launch of 100% bio-based surfactant ranges, driving sustainability and appealing to eco-conscious consumers and industries. These innovations not only meet stringent performance requirements but also align with global sustainability goals, offering a competitive edge and opening new market avenues.
Propelling Factors for Low Foam Surfactants Industry Growth
The Low Foam Surfactants industry's growth is propelled by several key factors. Technological advancements in surfactant chemistry, enabling the development of more efficient and specialized low-foaming agents, are paramount. The increasing demand for high-performance cleaning solutions across diverse end-user industries, including Agrochemicals, Detergents and Cleaning Agents, and Food and Dairy Process Cleaners, directly fuels market expansion. Furthermore, stringent environmental regulations promoting the use of biodegradable and eco-friendly chemicals are a significant driver, pushing manufacturers towards sustainable low foam surfactant alternatives. The expanding applications in oilfield chemicals and metal working fluids, where foam control is critical, also contribute to market growth.
Obstacles in the Low Foam Surfactants Industry Market
Despite robust growth, the Low Foam Surfactants industry faces several obstacles. High production costs associated with certain specialized low foam surfactant chemistries can limit widespread adoption, particularly in price-sensitive markets. Supply chain disruptions, as witnessed in recent years, can impact raw material availability and price volatility, affecting manufacturing schedules and profitability. Stringent regulatory hurdles and evolving compliance standards in different regions can also present challenges for market entry and product development. Moreover, the presence of established conventional surfactants that offer a lower cost-performance ratio in less demanding applications creates competitive pressure. The development of novel alternatives that mimic the performance of low foam surfactants at a reduced cost remains a continuous challenge.
Future Opportunities in Low Foam Surfactants Industry
Emerging opportunities in the Low Foam Surfactants industry are abundant, driven by evolving market needs and technological breakthroughs. The increasing focus on sustainability and green chemistry presents a significant opportunity for bio-based and biodegradable low foam surfactants. Emerging markets in Asia-Pacific and Latin America, with their growing industrial sectors and increasing consumer demand for sophisticated cleaning products, offer substantial untapped potential. The continuous development of specialized applications, such as in advanced electronics cleaning, advanced materials processing, and enhanced oil recovery, will create demand for highly tailored low foam surfactant solutions. Furthermore, digitalization and automation in manufacturing processes can lead to more efficient production and cost optimization, opening avenues for wider market penetration.
Major Players in the Low Foam Surfactants Industry Ecosystem
- AkzoNobel N V
- Nufarm
- Solvay
- Croda International plc
- Evonik Industries AG
- BASF SE
- Huntsman International LLC
- Dow
- KAO CORPORATION
- Oxiteno SA
- Stepan Company
- Clariant AG
Key Developments in Low Foam Surfactants Industry Industry
- April 2022: BASF SE announced the expansion of a new line of products, such as Dehypound M and Dehypound HDG. These high-performance nonionic surfactant blends are used for multi-soil, multi-application cleaning, and degreasing, enhancing the company's offering in industrial cleaning solutions.
- February 2022: Clariant launched a 100% bio-based surfactant range, driving the transition toward renewable carbon. The development of bio-based surfactants will help the company to further expand its sustainable product portfolio across the globe, aligning with growing market demand for eco-friendly ingredients.
Strategic Low Foam Surfactants Industry Market Forecast
The strategic forecast for the Low Foam Surfactants market is overwhelmingly positive, projected to reach an estimated value of over $12,000 Million by 2033. This growth will be significantly influenced by the rising global demand for high-performance cleaning agents in industries like Agrochemicals and Detergents. The unwavering focus on sustainability will continue to drive innovation in bio-based and biodegradable low foam surfactants, creating substantial market opportunities. Furthermore, advancements in application technology, particularly in sectors like oilfield chemicals and specialized industrial cleaning, will necessitate the development and adoption of advanced low foam surfactant formulations. The strategic expansion by key players, coupled with favorable regulatory trends and increasing consumer awareness, will ensure a robust and sustained growth trajectory for this vital industry segment.
Low Foam Surfactants Industry Segmentation
-
1. Type
- 1.1. Amphoteric
- 1.2. Cationic
- 1.3. Non-ionic
-
2. End-user Industry
- 2.1. Agrochemicals
- 2.2. Food and Dairy Process Cleaners
- 2.3. Detergents and Cleaning Agents
- 2.4. Pulp and Paper
- 2.5. Metal Cleaning and Metal Working Fluids
- 2.6. Oilfield Chemicals
- 2.7. Others (Textiles, Personal care, etc.)
Low Foam Surfactants Industry Segmentation By Geography
-
1. Asia Pacific
- 1.1. China
- 1.2. India
- 1.3. Japan
- 1.4. South Korea
- 1.5. Rest of Asia Pacific
-
2. North America
- 2.1. United States
- 2.2. Canada
- 2.3. Mexico
-
3. Europe
- 3.1. Germany
- 3.2. United Kingdom
- 3.3. Italy
- 3.4. France
- 3.5. Rest of Europe
-
4. South America
- 4.1. Brazil
- 4.2. Argentina
- 4.3. Rest of South America
-
5. Middle East and Africa
- 5.1. Saudi Arabia
- 5.2. South Africa
- 5.3. Rest of Middle East and Africa
Low Foam Surfactants Industry Regional Market Share
Geographic Coverage of Low Foam Surfactants Industry
Low Foam Surfactants Industry REPORT HIGHLIGHTS
| Aspects | Details |
|---|---|
| Study Period | 2020-2034 |
| Base Year | 2025 |
| Estimated Year | 2026 |
| Forecast Period | 2026-2034 |
| Historical Period | 2020-2025 |
| Growth Rate | CAGR of > 4.00% from 2020-2034 |
| Segmentation |
|
Table of Contents
- 1. Introduction
- 1.1. Research Scope
- 1.2. Market Segmentation
- 1.3. Research Objective
- 1.4. Definitions and Assumptions
- 2. Executive Summary
- 2.1. Market Snapshot
- 3. Market Dynamics
- 3.1. Market Drivers
- 3.2. Market Restrains
- 3.3. Market Trends
- 3.4. Market Opportunities
- 4. Market Factor Analysis
- 4.1. Porters Five Forces
- 4.1.1. Bargaining Power of Suppliers
- 4.1.2. Bargaining Power of Buyers
- 4.1.3. Threat of New Entrants
- 4.1.4. Threat of Substitutes
- 4.1.5. Competitive Rivalry
- 4.2. PESTEL analysis
- 4.3. BCG Analysis
- 4.3.1. Stars (High Growth, High Market Share)
- 4.3.2. Cash Cows (Low Growth, High Market Share)
- 4.3.3. Question Mark (High Growth, Low Market Share)
- 4.3.4. Dogs (Low Growth, Low Market Share)
- 4.4. Ansoff Matrix Analysis
- 4.5. Supply Chain Analysis
- 4.6. Regulatory Landscape
- 4.7. Current Market Potential and Opportunity Assessment (TAM–SAM–SOM Framework)
- 4.8. DMV Analyst Note
- 4.1. Porters Five Forces
- 5. Market Analysis, Insights and Forecast 2021-2033
- 5.1. Market Analysis, Insights and Forecast - by Type
- 5.1.1. Amphoteric
- 5.1.2. Cationic
- 5.1.3. Non-ionic
- 5.2. Market Analysis, Insights and Forecast - by End-user Industry
- 5.2.1. Agrochemicals
- 5.2.2. Food and Dairy Process Cleaners
- 5.2.3. Detergents and Cleaning Agents
- 5.2.4. Pulp and Paper
- 5.2.5. Metal Cleaning and Metal Working Fluids
- 5.2.6. Oilfield Chemicals
- 5.2.7. Others (Textiles, Personal care, etc.)
- 5.3. Market Analysis, Insights and Forecast - by Region
- 5.3.1. Asia Pacific
- 5.3.2. North America
- 5.3.3. Europe
- 5.3.4. South America
- 5.3.5. Middle East and Africa
- 5.1. Market Analysis, Insights and Forecast - by Type
- 6. Global Low Foam Surfactants Industry Analysis, Insights and Forecast, 2021-2033
- 6.1. Market Analysis, Insights and Forecast - by Type
- 6.1.1. Amphoteric
- 6.1.2. Cationic
- 6.1.3. Non-ionic
- 6.2. Market Analysis, Insights and Forecast - by End-user Industry
- 6.2.1. Agrochemicals
- 6.2.2. Food and Dairy Process Cleaners
- 6.2.3. Detergents and Cleaning Agents
- 6.2.4. Pulp and Paper
- 6.2.5. Metal Cleaning and Metal Working Fluids
- 6.2.6. Oilfield Chemicals
- 6.2.7. Others (Textiles, Personal care, etc.)
- 6.1. Market Analysis, Insights and Forecast - by Type
- 7. Asia Pacific Low Foam Surfactants Industry Analysis, Insights and Forecast, 2020-2032
- 7.1. Market Analysis, Insights and Forecast - by Type
- 7.1.1. Amphoteric
- 7.1.2. Cationic
- 7.1.3. Non-ionic
- 7.2. Market Analysis, Insights and Forecast - by End-user Industry
- 7.2.1. Agrochemicals
- 7.2.2. Food and Dairy Process Cleaners
- 7.2.3. Detergents and Cleaning Agents
- 7.2.4. Pulp and Paper
- 7.2.5. Metal Cleaning and Metal Working Fluids
- 7.2.6. Oilfield Chemicals
- 7.2.7. Others (Textiles, Personal care, etc.)
- 7.1. Market Analysis, Insights and Forecast - by Type
- 8. North America Low Foam Surfactants Industry Analysis, Insights and Forecast, 2020-2032
- 8.1. Market Analysis, Insights and Forecast - by Type
- 8.1.1. Amphoteric
- 8.1.2. Cationic
- 8.1.3. Non-ionic
- 8.2. Market Analysis, Insights and Forecast - by End-user Industry
- 8.2.1. Agrochemicals
- 8.2.2. Food and Dairy Process Cleaners
- 8.2.3. Detergents and Cleaning Agents
- 8.2.4. Pulp and Paper
- 8.2.5. Metal Cleaning and Metal Working Fluids
- 8.2.6. Oilfield Chemicals
- 8.2.7. Others (Textiles, Personal care, etc.)
- 8.1. Market Analysis, Insights and Forecast - by Type
- 9. Europe Low Foam Surfactants Industry Analysis, Insights and Forecast, 2020-2032
- 9.1. Market Analysis, Insights and Forecast - by Type
- 9.1.1. Amphoteric
- 9.1.2. Cationic
- 9.1.3. Non-ionic
- 9.2. Market Analysis, Insights and Forecast - by End-user Industry
- 9.2.1. Agrochemicals
- 9.2.2. Food and Dairy Process Cleaners
- 9.2.3. Detergents and Cleaning Agents
- 9.2.4. Pulp and Paper
- 9.2.5. Metal Cleaning and Metal Working Fluids
- 9.2.6. Oilfield Chemicals
- 9.2.7. Others (Textiles, Personal care, etc.)
- 9.1. Market Analysis, Insights and Forecast - by Type
- 10. South America Low Foam Surfactants Industry Analysis, Insights and Forecast, 2020-2032
- 10.1. Market Analysis, Insights and Forecast - by Type
- 10.1.1. Amphoteric
- 10.1.2. Cationic
- 10.1.3. Non-ionic
- 10.2. Market Analysis, Insights and Forecast - by End-user Industry
- 10.2.1. Agrochemicals
- 10.2.2. Food and Dairy Process Cleaners
- 10.2.3. Detergents and Cleaning Agents
- 10.2.4. Pulp and Paper
- 10.2.5. Metal Cleaning and Metal Working Fluids
- 10.2.6. Oilfield Chemicals
- 10.2.7. Others (Textiles, Personal care, etc.)
- 10.1. Market Analysis, Insights and Forecast - by Type
- 11. Middle East and Africa Low Foam Surfactants Industry Analysis, Insights and Forecast, 2020-2032
- 11.1. Market Analysis, Insights and Forecast - by Type
- 11.1.1. Amphoteric
- 11.1.2. Cationic
- 11.1.3. Non-ionic
- 11.2. Market Analysis, Insights and Forecast - by End-user Industry
- 11.2.1. Agrochemicals
- 11.2.2. Food and Dairy Process Cleaners
- 11.2.3. Detergents and Cleaning Agents
- 11.2.4. Pulp and Paper
- 11.2.5. Metal Cleaning and Metal Working Fluids
- 11.2.6. Oilfield Chemicals
- 11.2.7. Others (Textiles, Personal care, etc.)
- 11.1. Market Analysis, Insights and Forecast - by Type
- 12. Competitive Analysis
- 12.1. Company Profiles
- 12.1.1 AkzoNobel N V
- 12.1.1.1. Company Overview
- 12.1.1.2. Products
- 12.1.1.3. Company Financials
- 12.1.1.4. SWOT Analysis
- 12.1.2 Nufarm
- 12.1.2.1. Company Overview
- 12.1.2.2. Products
- 12.1.2.3. Company Financials
- 12.1.2.4. SWOT Analysis
- 12.1.3 Solvay
- 12.1.3.1. Company Overview
- 12.1.3.2. Products
- 12.1.3.3. Company Financials
- 12.1.3.4. SWOT Analysis
- 12.1.4 Croda International plc
- 12.1.4.1. Company Overview
- 12.1.4.2. Products
- 12.1.4.3. Company Financials
- 12.1.4.4. SWOT Analysis
- 12.1.5 Evonik Industries AG
- 12.1.5.1. Company Overview
- 12.1.5.2. Products
- 12.1.5.3. Company Financials
- 12.1.5.4. SWOT Analysis
- 12.1.6 BASF SE
- 12.1.6.1. Company Overview
- 12.1.6.2. Products
- 12.1.6.3. Company Financials
- 12.1.6.4. SWOT Analysis
- 12.1.7 Huntsman International LLC
- 12.1.7.1. Company Overview
- 12.1.7.2. Products
- 12.1.7.3. Company Financials
- 12.1.7.4. SWOT Analysis
- 12.1.8 Dow
- 12.1.8.1. Company Overview
- 12.1.8.2. Products
- 12.1.8.3. Company Financials
- 12.1.8.4. SWOT Analysis
- 12.1.9 KAO CORPORATION
- 12.1.9.1. Company Overview
- 12.1.9.2. Products
- 12.1.9.3. Company Financials
- 12.1.9.4. SWOT Analysis
- 12.1.10 Oxiteno SA
- 12.1.10.1. Company Overview
- 12.1.10.2. Products
- 12.1.10.3. Company Financials
- 12.1.10.4. SWOT Analysis
- 12.1.11 Stepan Company*List Not Exhaustive
- 12.1.11.1. Company Overview
- 12.1.11.2. Products
- 12.1.11.3. Company Financials
- 12.1.11.4. SWOT Analysis
- 12.1.12 Clariant AG
- 12.1.12.1. Company Overview
- 12.1.12.2. Products
- 12.1.12.3. Company Financials
- 12.1.12.4. SWOT Analysis
- 12.1.1 AkzoNobel N V
- 12.2. Market Entropy
- 12.2.1 Company's Key Areas Served
- 12.2.2 Recent Developments
- 12.3. Company Market Share Analysis 2025
- 12.3.1 Top 5 Companies Market Share Analysis
- 12.3.2 Top 3 Companies Market Share Analysis
- 12.4. List of Potential Customers
- 13. Research Methodology
List of Figures
- Figure 1: Global Low Foam Surfactants Industry Revenue Breakdown (Million, %) by Region 2025 & 2033
- Figure 2: Global Low Foam Surfactants Industry Volume Breakdown (liter , %) by Region 2025 & 2033
- Figure 3: Asia Pacific Low Foam Surfactants Industry Revenue (Million), by Type 2025 & 2033
- Figure 4: Asia Pacific Low Foam Surfactants Industry Volume (liter ), by Type 2025 & 2033
- Figure 5: Asia Pacific Low Foam Surfactants Industry Revenue Share (%), by Type 2025 & 2033
- Figure 6: Asia Pacific Low Foam Surfactants Industry Volume Share (%), by Type 2025 & 2033
- Figure 7: Asia Pacific Low Foam Surfactants Industry Revenue (Million), by End-user Industry 2025 & 2033
- Figure 8: Asia Pacific Low Foam Surfactants Industry Volume (liter ), by End-user Industry 2025 & 2033
- Figure 9: Asia Pacific Low Foam Surfactants Industry Revenue Share (%), by End-user Industry 2025 & 2033
- Figure 10: Asia Pacific Low Foam Surfactants Industry Volume Share (%), by End-user Industry 2025 & 2033
- Figure 11: Asia Pacific Low Foam Surfactants Industry Revenue (Million), by Country 2025 & 2033
- Figure 12: Asia Pacific Low Foam Surfactants Industry Volume (liter ), by Country 2025 & 2033
- Figure 13: Asia Pacific Low Foam Surfactants Industry Revenue Share (%), by Country 2025 & 2033
- Figure 14: Asia Pacific Low Foam Surfactants Industry Volume Share (%), by Country 2025 & 2033
- Figure 15: North America Low Foam Surfactants Industry Revenue (Million), by Type 2025 & 2033
- Figure 16: North America Low Foam Surfactants Industry Volume (liter ), by Type 2025 & 2033
- Figure 17: North America Low Foam Surfactants Industry Revenue Share (%), by Type 2025 & 2033
- Figure 18: North America Low Foam Surfactants Industry Volume Share (%), by Type 2025 & 2033
- Figure 19: North America Low Foam Surfactants Industry Revenue (Million), by End-user Industry 2025 & 2033
- Figure 20: North America Low Foam Surfactants Industry Volume (liter ), by End-user Industry 2025 & 2033
- Figure 21: North America Low Foam Surfactants Industry Revenue Share (%), by End-user Industry 2025 & 2033
- Figure 22: North America Low Foam Surfactants Industry Volume Share (%), by End-user Industry 2025 & 2033
- Figure 23: North America Low Foam Surfactants Industry Revenue (Million), by Country 2025 & 2033
- Figure 24: North America Low Foam Surfactants Industry Volume (liter ), by Country 2025 & 2033
- Figure 25: North America Low Foam Surfactants Industry Revenue Share (%), by Country 2025 & 2033
- Figure 26: North America Low Foam Surfactants Industry Volume Share (%), by Country 2025 & 2033
- Figure 27: Europe Low Foam Surfactants Industry Revenue (Million), by Type 2025 & 2033
- Figure 28: Europe Low Foam Surfactants Industry Volume (liter ), by Type 2025 & 2033
- Figure 29: Europe Low Foam Surfactants Industry Revenue Share (%), by Type 2025 & 2033
- Figure 30: Europe Low Foam Surfactants Industry Volume Share (%), by Type 2025 & 2033
- Figure 31: Europe Low Foam Surfactants Industry Revenue (Million), by End-user Industry 2025 & 2033
- Figure 32: Europe Low Foam Surfactants Industry Volume (liter ), by End-user Industry 2025 & 2033
- Figure 33: Europe Low Foam Surfactants Industry Revenue Share (%), by End-user Industry 2025 & 2033
- Figure 34: Europe Low Foam Surfactants Industry Volume Share (%), by End-user Industry 2025 & 2033
- Figure 35: Europe Low Foam Surfactants Industry Revenue (Million), by Country 2025 & 2033
- Figure 36: Europe Low Foam Surfactants Industry Volume (liter ), by Country 2025 & 2033
- Figure 37: Europe Low Foam Surfactants Industry Revenue Share (%), by Country 2025 & 2033
- Figure 38: Europe Low Foam Surfactants Industry Volume Share (%), by Country 2025 & 2033
- Figure 39: South America Low Foam Surfactants Industry Revenue (Million), by Type 2025 & 2033
- Figure 40: South America Low Foam Surfactants Industry Volume (liter ), by Type 2025 & 2033
- Figure 41: South America Low Foam Surfactants Industry Revenue Share (%), by Type 2025 & 2033
- Figure 42: South America Low Foam Surfactants Industry Volume Share (%), by Type 2025 & 2033
- Figure 43: South America Low Foam Surfactants Industry Revenue (Million), by End-user Industry 2025 & 2033
- Figure 44: South America Low Foam Surfactants Industry Volume (liter ), by End-user Industry 2025 & 2033
- Figure 45: South America Low Foam Surfactants Industry Revenue Share (%), by End-user Industry 2025 & 2033
- Figure 46: South America Low Foam Surfactants Industry Volume Share (%), by End-user Industry 2025 & 2033
- Figure 47: South America Low Foam Surfactants Industry Revenue (Million), by Country 2025 & 2033
- Figure 48: South America Low Foam Surfactants Industry Volume (liter ), by Country 2025 & 2033
- Figure 49: South America Low Foam Surfactants Industry Revenue Share (%), by Country 2025 & 2033
- Figure 50: South America Low Foam Surfactants Industry Volume Share (%), by Country 2025 & 2033
- Figure 51: Middle East and Africa Low Foam Surfactants Industry Revenue (Million), by Type 2025 & 2033
- Figure 52: Middle East and Africa Low Foam Surfactants Industry Volume (liter ), by Type 2025 & 2033
- Figure 53: Middle East and Africa Low Foam Surfactants Industry Revenue Share (%), by Type 2025 & 2033
- Figure 54: Middle East and Africa Low Foam Surfactants Industry Volume Share (%), by Type 2025 & 2033
- Figure 55: Middle East and Africa Low Foam Surfactants Industry Revenue (Million), by End-user Industry 2025 & 2033
- Figure 56: Middle East and Africa Low Foam Surfactants Industry Volume (liter ), by End-user Industry 2025 & 2033
- Figure 57: Middle East and Africa Low Foam Surfactants Industry Revenue Share (%), by End-user Industry 2025 & 2033
- Figure 58: Middle East and Africa Low Foam Surfactants Industry Volume Share (%), by End-user Industry 2025 & 2033
- Figure 59: Middle East and Africa Low Foam Surfactants Industry Revenue (Million), by Country 2025 & 2033
- Figure 60: Middle East and Africa Low Foam Surfactants Industry Volume (liter ), by Country 2025 & 2033
- Figure 61: Middle East and Africa Low Foam Surfactants Industry Revenue Share (%), by Country 2025 & 2033
- Figure 62: Middle East and Africa Low Foam Surfactants Industry Volume Share (%), by Country 2025 & 2033
List of Tables
- Table 1: Global Low Foam Surfactants Industry Revenue Million Forecast, by Type 2020 & 2033
- Table 2: Global Low Foam Surfactants Industry Volume liter Forecast, by Type 2020 & 2033
- Table 3: Global Low Foam Surfactants Industry Revenue Million Forecast, by End-user Industry 2020 & 2033
- Table 4: Global Low Foam Surfactants Industry Volume liter Forecast, by End-user Industry 2020 & 2033
- Table 5: Global Low Foam Surfactants Industry Revenue Million Forecast, by Region 2020 & 2033
- Table 6: Global Low Foam Surfactants Industry Volume liter Forecast, by Region 2020 & 2033
- Table 7: Global Low Foam Surfactants Industry Revenue Million Forecast, by Type 2020 & 2033
- Table 8: Global Low Foam Surfactants Industry Volume liter Forecast, by Type 2020 & 2033
- Table 9: Global Low Foam Surfactants Industry Revenue Million Forecast, by End-user Industry 2020 & 2033
- Table 10: Global Low Foam Surfactants Industry Volume liter Forecast, by End-user Industry 2020 & 2033
- Table 11: Global Low Foam Surfactants Industry Revenue Million Forecast, by Country 2020 & 2033
- Table 12: Global Low Foam Surfactants Industry Volume liter Forecast, by Country 2020 & 2033
- Table 13: China Low Foam Surfactants Industry Revenue (Million) Forecast, by Application 2020 & 2033
- Table 14: China Low Foam Surfactants Industry Volume (liter ) Forecast, by Application 2020 & 2033
- Table 15: India Low Foam Surfactants Industry Revenue (Million) Forecast, by Application 2020 & 2033
- Table 16: India Low Foam Surfactants Industry Volume (liter ) Forecast, by Application 2020 & 2033
- Table 17: Japan Low Foam Surfactants Industry Revenue (Million) Forecast, by Application 2020 & 2033
- Table 18: Japan Low Foam Surfactants Industry Volume (liter ) Forecast, by Application 2020 & 2033
- Table 19: South Korea Low Foam Surfactants Industry Revenue (Million) Forecast, by Application 2020 & 2033
- Table 20: South Korea Low Foam Surfactants Industry Volume (liter ) Forecast, by Application 2020 & 2033
- Table 21: Rest of Asia Pacific Low Foam Surfactants Industry Revenue (Million) Forecast, by Application 2020 & 2033
- Table 22: Rest of Asia Pacific Low Foam Surfactants Industry Volume (liter ) Forecast, by Application 2020 & 2033
- Table 23: Global Low Foam Surfactants Industry Revenue Million Forecast, by Type 2020 & 2033
- Table 24: Global Low Foam Surfactants Industry Volume liter Forecast, by Type 2020 & 2033
- Table 25: Global Low Foam Surfactants Industry Revenue Million Forecast, by End-user Industry 2020 & 2033
- Table 26: Global Low Foam Surfactants Industry Volume liter Forecast, by End-user Industry 2020 & 2033
- Table 27: Global Low Foam Surfactants Industry Revenue Million Forecast, by Country 2020 & 2033
- Table 28: Global Low Foam Surfactants Industry Volume liter Forecast, by Country 2020 & 2033
- Table 29: United States Low Foam Surfactants Industry Revenue (Million) Forecast, by Application 2020 & 2033
- Table 30: United States Low Foam Surfactants Industry Volume (liter ) Forecast, by Application 2020 & 2033
- Table 31: Canada Low Foam Surfactants Industry Revenue (Million) Forecast, by Application 2020 & 2033
- Table 32: Canada Low Foam Surfactants Industry Volume (liter ) Forecast, by Application 2020 & 2033
- Table 33: Mexico Low Foam Surfactants Industry Revenue (Million) Forecast, by Application 2020 & 2033
- Table 34: Mexico Low Foam Surfactants Industry Volume (liter ) Forecast, by Application 2020 & 2033
- Table 35: Global Low Foam Surfactants Industry Revenue Million Forecast, by Type 2020 & 2033
- Table 36: Global Low Foam Surfactants Industry Volume liter Forecast, by Type 2020 & 2033
- Table 37: Global Low Foam Surfactants Industry Revenue Million Forecast, by End-user Industry 2020 & 2033
- Table 38: Global Low Foam Surfactants Industry Volume liter Forecast, by End-user Industry 2020 & 2033
- Table 39: Global Low Foam Surfactants Industry Revenue Million Forecast, by Country 2020 & 2033
- Table 40: Global Low Foam Surfactants Industry Volume liter Forecast, by Country 2020 & 2033
- Table 41: Germany Low Foam Surfactants Industry Revenue (Million) Forecast, by Application 2020 & 2033
- Table 42: Germany Low Foam Surfactants Industry Volume (liter ) Forecast, by Application 2020 & 2033
- Table 43: United Kingdom Low Foam Surfactants Industry Revenue (Million) Forecast, by Application 2020 & 2033
- Table 44: United Kingdom Low Foam Surfactants Industry Volume (liter ) Forecast, by Application 2020 & 2033
- Table 45: Italy Low Foam Surfactants Industry Revenue (Million) Forecast, by Application 2020 & 2033
- Table 46: Italy Low Foam Surfactants Industry Volume (liter ) Forecast, by Application 2020 & 2033
- Table 47: France Low Foam Surfactants Industry Revenue (Million) Forecast, by Application 2020 & 2033
- Table 48: France Low Foam Surfactants Industry Volume (liter ) Forecast, by Application 2020 & 2033
- Table 49: Rest of Europe Low Foam Surfactants Industry Revenue (Million) Forecast, by Application 2020 & 2033
- Table 50: Rest of Europe Low Foam Surfactants Industry Volume (liter ) Forecast, by Application 2020 & 2033
- Table 51: Global Low Foam Surfactants Industry Revenue Million Forecast, by Type 2020 & 2033
- Table 52: Global Low Foam Surfactants Industry Volume liter Forecast, by Type 2020 & 2033
- Table 53: Global Low Foam Surfactants Industry Revenue Million Forecast, by End-user Industry 2020 & 2033
- Table 54: Global Low Foam Surfactants Industry Volume liter Forecast, by End-user Industry 2020 & 2033
- Table 55: Global Low Foam Surfactants Industry Revenue Million Forecast, by Country 2020 & 2033
- Table 56: Global Low Foam Surfactants Industry Volume liter Forecast, by Country 2020 & 2033
- Table 57: Brazil Low Foam Surfactants Industry Revenue (Million) Forecast, by Application 2020 & 2033
- Table 58: Brazil Low Foam Surfactants Industry Volume (liter ) Forecast, by Application 2020 & 2033
- Table 59: Argentina Low Foam Surfactants Industry Revenue (Million) Forecast, by Application 2020 & 2033
- Table 60: Argentina Low Foam Surfactants Industry Volume (liter ) Forecast, by Application 2020 & 2033
- Table 61: Rest of South America Low Foam Surfactants Industry Revenue (Million) Forecast, by Application 2020 & 2033
- Table 62: Rest of South America Low Foam Surfactants Industry Volume (liter ) Forecast, by Application 2020 & 2033
- Table 63: Global Low Foam Surfactants Industry Revenue Million Forecast, by Type 2020 & 2033
- Table 64: Global Low Foam Surfactants Industry Volume liter Forecast, by Type 2020 & 2033
- Table 65: Global Low Foam Surfactants Industry Revenue Million Forecast, by End-user Industry 2020 & 2033
- Table 66: Global Low Foam Surfactants Industry Volume liter Forecast, by End-user Industry 2020 & 2033
- Table 67: Global Low Foam Surfactants Industry Revenue Million Forecast, by Country 2020 & 2033
- Table 68: Global Low Foam Surfactants Industry Volume liter Forecast, by Country 2020 & 2033
- Table 69: Saudi Arabia Low Foam Surfactants Industry Revenue (Million) Forecast, by Application 2020 & 2033
- Table 70: Saudi Arabia Low Foam Surfactants Industry Volume (liter ) Forecast, by Application 2020 & 2033
- Table 71: South Africa Low Foam Surfactants Industry Revenue (Million) Forecast, by Application 2020 & 2033
- Table 72: South Africa Low Foam Surfactants Industry Volume (liter ) Forecast, by Application 2020 & 2033
- Table 73: Rest of Middle East and Africa Low Foam Surfactants Industry Revenue (Million) Forecast, by Application 2020 & 2033
- Table 74: Rest of Middle East and Africa Low Foam Surfactants Industry Volume (liter ) Forecast, by Application 2020 & 2033
Frequently Asked Questions
1. What is the projected Compound Annual Growth Rate (CAGR) of the Low Foam Surfactants Industry?
The projected CAGR is approximately > 4.00%.
2. Which companies are prominent players in the Low Foam Surfactants Industry?
Key companies in the market include AkzoNobel N V, Nufarm, Solvay, Croda International plc, Evonik Industries AG, BASF SE, Huntsman International LLC, Dow, KAO CORPORATION, Oxiteno SA, Stepan Company*List Not Exhaustive, Clariant AG.
3. What are the main segments of the Low Foam Surfactants Industry?
The market segments include Type, End-user Industry.
4. Can you provide details about the market size?
The market size is estimated to be USD 14.35 Million as of 2022.
5. What are some drivers contributing to market growth?
Significant Growth in Detergents and Cleaning Agents; Increased Demand for Sustainable Surfactants; The rising demand for personal care products.
6. What are the notable trends driving market growth?
Detergents and Cleaning Agents End-user Industry Segment to Dominate the Market.
7. Are there any restraints impacting market growth?
The Stringent Enviornmental Regulations; The Availability of Other Substitutes.
8. Can you provide examples of recent developments in the market?
April 2022: BASF SE announced the expansion of a new line of products, such as Dehypound M and Dehypound HDG. These high-performance nonionic surfactant blends are used for multi-soil, multi-application cleaning, and degreasing.
9. What pricing options are available for accessing the report?
Pricing options include single-user, multi-user, and enterprise licenses priced at USD 4750, USD 5250, and USD 8750 respectively.
10. Is the market size provided in terms of value or volume?
The market size is provided in terms of value, measured in Million and volume, measured in liter .
11. Are there any specific market keywords associated with the report?
Yes, the market keyword associated with the report is "Low Foam Surfactants Industry," which aids in identifying and referencing the specific market segment covered.
12. How do I determine which pricing option suits my needs best?
The pricing options vary based on user requirements and access needs. Individual users may opt for single-user licenses, while businesses requiring broader access may choose multi-user or enterprise licenses for cost-effective access to the report.
13. Are there any additional resources or data provided in the Low Foam Surfactants Industry report?
While the report offers comprehensive insights, it's advisable to review the specific contents or supplementary materials provided to ascertain if additional resources or data are available.
14. How can I stay updated on further developments or reports in the Low Foam Surfactants Industry?
To stay informed about further developments, trends, and reports in the Low Foam Surfactants Industry, consider subscribing to industry newsletters, following relevant companies and organizations, or regularly checking reputable industry news sources and publications.
Methodology
Step 1 - Identification of Relevant Samples Size from Population Database


Step 2 - Approaches for Defining Global Market Size (Value, Volume* & Price*)

Note*: In applicable scenarios
Step 3 - Data Sources
Primary Research
- Web Analytics
- Survey Reports
- Research Institute
- Latest Research Reports
- Opinion Leaders
Secondary Research
- Annual Reports
- White Paper
- Latest Press Release
- Industry Association
- Paid Database
- Investor Presentations

Step 4 - Data Triangulation
Involves using different sources of information in order to increase the validity of a study
These sources are likely to be stakeholders in a program - participants, other researchers, program staff, other community members, and so on.
Then we put all data in single framework & apply various statistical tools to find out the dynamic on the market.
During the analysis stage, feedback from the stakeholder groups would be compared to determine areas of agreement as well as areas of divergence