

Key Insights
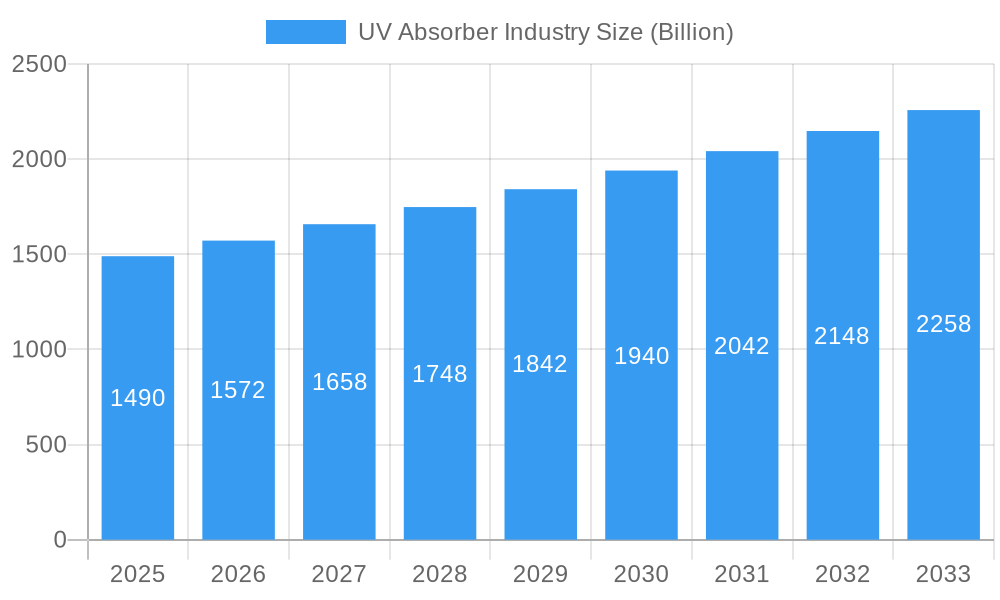
The global UV absorber market is poised for robust expansion, currently valued at an estimated $1.49 billion. This growth is fueled by a projected Compound Annual Growth Rate (CAGR) of 5.5% from 2025 to 2033, indicating sustained and significant market development. Key drivers for this expansion include the escalating demand for enhanced product longevity and performance across various industries, particularly in plastics, coatings, and personal care products. As consumers and manufacturers alike become more aware of the detrimental effects of UV radiation on materials and skin, the need for effective UV protection solutions intensifies. The increasing adoption of UV absorbers in automotive coatings to prevent fading and degradation, in packaging to protect sensitive contents, and in outdoor furniture and building materials to withstand environmental exposure are major contributors to this upward trend. Furthermore, advancements in UV absorber technology, leading to more efficient and environmentally friendly formulations, are also stimulating market growth.
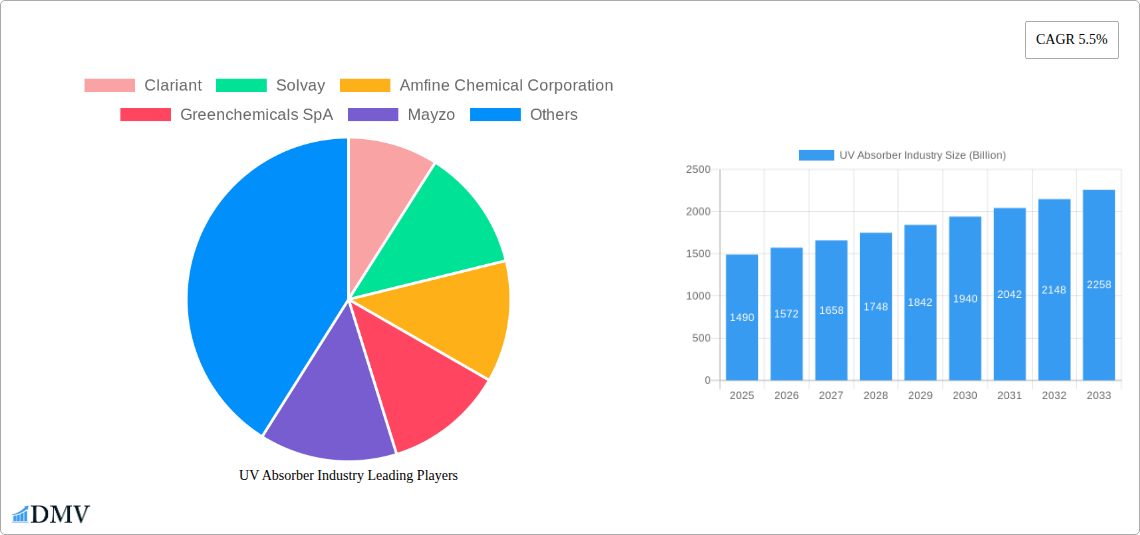
UV Absorber Industry Market Size (In Billion)
The market's segmentation reveals diverse application areas, with plastics and coatings being dominant sectors. Within the 'Types' segment, Benzotriazole and Benzophenone UV absorbers are expected to hold significant market share due to their established efficacy and broad applicability. The 'Personal Care' segment is also experiencing notable growth, driven by the demand for sunscreens and other cosmetic products offering advanced UV protection. While the market benefits from strong demand drivers, certain restraints, such as fluctuating raw material prices and the development of alternative UV protection technologies, warrant strategic consideration. However, the overall outlook remains highly optimistic, with the Asia Pacific region anticipated to lead in market consumption and production due to its burgeoning industrial landscape and increasing disposable incomes. Companies are actively investing in research and development to innovate and cater to the evolving needs of these dynamic end-use industries, ensuring a continuous supply of advanced UV protection solutions.
UV Absorber Industry Company Market Share
UV Absorber Industry Market Composition & Trends
The global UV absorber market is characterized by a moderate to high level of concentration, with key players like BASF SE, Clariant, and Solvay holding significant market share. Innovation is a crucial driver, fueled by increasing demand for enhanced material durability and protection against UV degradation across various applications. The regulatory landscape, particularly concerning environmental impact and safety standards, is evolving, influencing product development and adoption. Substitute products, while present, often lack the comprehensive performance and longevity offered by advanced UV absorbers. End-user profiles span diverse industries, including automotive, construction, electronics, packaging, and personal care, each with unique protection requirements. Mergers and acquisitions (M&A) remain a strategic tool for market consolidation and expansion, with recent deal values estimated to be in the range of XXX Billion.
- Market Share Distribution: Leading companies collectively hold over 60% of the market.
- M&A Deal Values: Estimated total M&A deal values in the historical period reached XXX Billion.
- Innovation Catalysts: Growing demand for extended product lifespans and enhanced UV protection.
- Regulatory Landscape: Increasing focus on REACH compliance and eco-friendly formulations.
- Substitute Products: Mineral-based sunscreens and physical barriers, offering limited UV protection compared to chemical absorbers.
- End-User Profiles: Plastics manufacturers, automotive paint suppliers, coatings formulators, personal care product developers, and packaging companies.
UV Absorber Industry Industry Evolution
The UV absorber industry has witnessed remarkable evolution, driven by escalating demand for durable and UV-resistant materials across a multitude of applications. From its nascent stages focused on basic protection, the market has matured into a sophisticated sector offering specialized solutions tailored to specific end-use requirements. The study period, spanning from 2019 to 2033, encapsulates significant growth trajectories, with the base year 2025 projecting a market valuation of XXX Billion. This growth is intrinsically linked to technological advancements that have yielded more effective, environmentally sustainable, and versatile UV absorber formulations. For instance, the development of high-performance Benzotriazole and Triazine UV absorbers has enabled their widespread adoption in demanding sectors like automotive coatings and advanced plastics. Consumer awareness regarding the detrimental effects of UV radiation on materials and human health has also played a pivotal role, shifting preferences towards products incorporating superior UV protection. This heightened demand translates into accelerated adoption metrics, with the application of UV absorbers in plastics expected to see a Compound Annual Growth Rate (CAGR) of approximately XX% during the forecast period of 2025–2033. Furthermore, the personal care segment, driven by the quest for effective sunscreens and anti-aging products, continues to be a strong contributor to market expansion. The industry's ability to innovate in response to these evolving demands, offering solutions with improved light fastness, thermal stability, and reduced migration, has been key to its sustained growth and resilience, projecting a market size of XXX Billion by 2033.
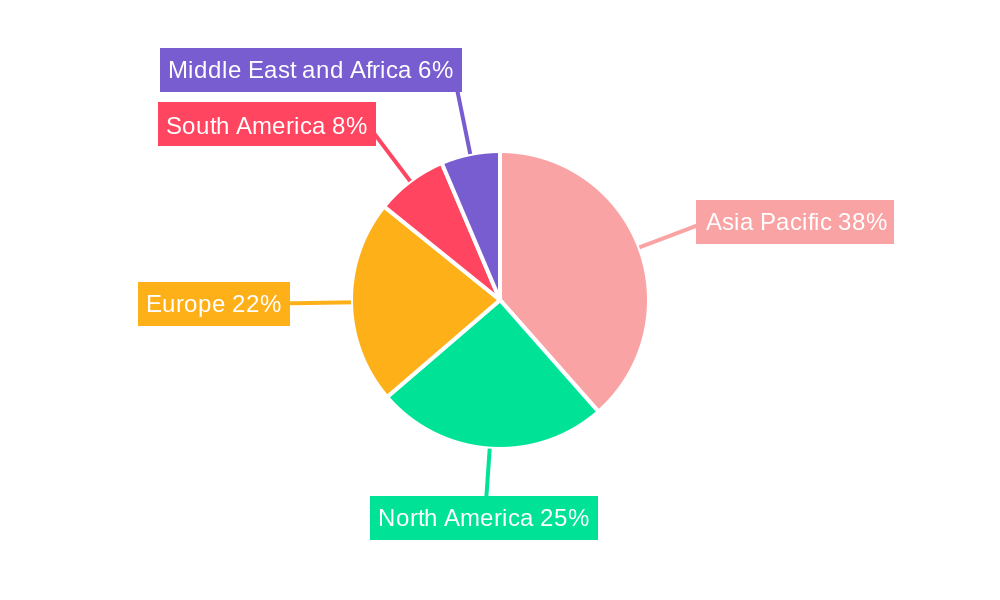
Leading Regions, Countries, or Segments in UV Absorber Industry
The global UV absorber market exhibits distinct regional and segmental dominance, shaped by manufacturing capabilities, regulatory frameworks, and end-user industry concentration. Asia Pacific, particularly China, stands out as the leading region, driven by its robust manufacturing base for plastics, coatings, and personal care products, coupled with substantial investments in R&D. The region's significant production capacity for raw materials and intermediate chemicals also contributes to its leading position. Within this dynamic market, the Plastics segment emerges as a dominant application, accounting for an estimated XX% of the total market share in 2025. The ever-increasing use of plastics in automotive, construction, packaging, and consumer goods necessitates effective UV protection to prevent degradation, yellowing, and loss of mechanical properties.
Key drivers for this dominance include:
- Investment Trends: Significant capital investments in polymer production and processing facilities across Asia Pacific, particularly in China, South Korea, and India.
- Regulatory Support: Favorable government policies promoting domestic manufacturing and export of chemical additives.
- End-User Demand: Proliferation of the automotive, construction, and electronics industries, heavily reliant on durable plastic components.
- Cost-Effectiveness: Competitive pricing of UV absorbers manufactured in the region.
Among the different types of UV absorbers, Benzotriazoles and Triazines are particularly prominent, offering excellent efficacy and broad-spectrum UV protection. Benzotriazoles are widely used in plastics and coatings due to their high absorption capacity and good compatibility. Triazines are gaining traction for their superior thermal stability and lower volatility, making them ideal for high-temperature processing applications and demanding outdoor environments. The Coatings application segment also holds substantial market share, driven by the automotive, industrial, and architectural coatings sectors seeking to enhance the lifespan and aesthetic appeal of painted surfaces. The Personal Care segment, while smaller in volume, is a high-value market, driven by stringent regulatory requirements for sunscreens and cosmetic formulations.
UV Absorber Industry Product Innovations
Product innovation in the UV absorber industry is characterized by the development of advanced chemistries offering superior performance and sustainability. New generation Benzotriazoles and Triazines exhibit enhanced photostability, reduced migration, and broader UV absorption spectra, leading to extended product lifetimes for plastics, coatings, and textiles. For instance, the introduction of novel Triazine derivatives with improved compatibility in polyolefins and engineering plastics has opened new application avenues. Furthermore, eco-friendly UV absorbers with lower VOC emissions and better biodegradability are gaining prominence, aligning with growing environmental concerns. These advancements are crucial for industries like automotive, where coatings demand exceptional weatherability, and in consumer electronics, where material integrity is paramount.
Propelling Factors for UV Absorber Industry Growth
Several key factors are propelling the growth of the UV absorber industry. Firstly, the increasing global demand for durable and long-lasting materials across sectors like automotive, construction, and electronics is a primary driver. Secondly, growing consumer awareness regarding the detrimental effects of UV radiation on both products and human health fuels the demand for UV protection solutions. Technologically, continuous innovation in developing more effective, safer, and environmentally friendly UV absorber formulations, such as low-VOC and high-performance Triazines, is expanding application possibilities. Government regulations promoting product longevity and material durability also indirectly contribute to market expansion. The personal care segment, with its relentless pursuit of effective sunscreens, further bolsters this growth trajectory.
Obstacles in the UV Absorber Industry Market
Despite robust growth, the UV absorber industry faces several obstacles. Stringent environmental regulations and evolving safety standards in regions like Europe (e.g., REACH) can increase compliance costs and necessitate product reformulation, potentially impacting market accessibility for certain chemicals. Supply chain disruptions, particularly for key raw materials, can lead to price volatility and production delays, affecting overall market stability. Intense competition among numerous global and regional players often leads to price pressures, squeezing profit margins. Furthermore, the development of cost-effective and equally effective alternative technologies or natural UV protection methods could pose a threat to the market share of traditional UV absorbers.
Future Opportunities in UV Absorber Industry
Emerging opportunities in the UV absorber industry are diverse and promising. The increasing demand for high-performance UV absorbers in specialized applications like advanced composites, flexible electronics, and renewable energy technologies (e.g., solar panels) presents significant growth potential. The growing trend towards sustainable and bio-based UV absorbers, driven by consumer demand and environmental consciousness, offers a lucrative niche. Expansion into developing economies with rapidly growing manufacturing sectors and increasing disposable incomes will unlock new market segments. Furthermore, technological advancements in encapsulation and controlled-release systems for UV absorbers can enhance their efficacy and reduce their environmental impact, opening up new product development avenues.
Major Players in the UV Absorber Industry Ecosystem
- BASF SE
- Clariant
- Solvay
- Amfine Chemical Corporation
- Greenchemicals SpA
- Mayzo
- Everlight Chemical Industrial Corp
- Anhui Best Progress Imp & Exp Co Ltd
- Huntsman International LLC
- Partners in Chemicals
- Hangzhou Disheng Import&Export Co Ltd
- Suqian Liansheng Technology Co Ltd
- Rianlon Corporation
- NYACOL® Nano Technologies Inc
- SABO S p A
- Hunan Chemical BV
- Tiangang Auxiliary Co Ltd
- Milliken Chemical
- The Cary Company
Key Developments in UV Absorber Industry Industry
- 2023: BASF SE launched a new series of high-performance UV absorbers for demanding automotive coating applications, enhancing scratch resistance and gloss retention.
- 2022: Clariant acquired the remaining stake in its former joint venture, expanding its portfolio of additives for plastics.
- 2022: Solvay introduced a new generation of UV stabilizers for polycarbonates, improving clarity and longevity in electronic displays.
- 2021: Rianlon Corporation announced significant expansion of its production capacity for UV absorbers, catering to the growing demand from Asia Pacific.
- 2020: Amfine Chemical Corporation unveiled innovative UV absorbers for packaging applications, meeting stringent food contact regulations.
- 2020: Greenchemicals SpA focused on developing sustainable UV absorber solutions with improved environmental profiles.
Strategic UV Absorber Industry Market Forecast
The strategic UV absorber market forecast indicates sustained growth, driven by escalating demand for material protection and enhanced product longevity across diverse industries. Key growth catalysts include continuous technological innovation in developing higher-performance and eco-friendly UV absorber formulations, particularly Benzotriazoles and Triazines. The expanding applications in high-growth sectors such as electric vehicles, renewable energy, and advanced packaging will further bolster market potential. Increasing consumer awareness and stringent regulations emphasizing product durability and safety will solidify the demand for UV absorbers. Strategic collaborations and mergers are expected to shape market dynamics, while expansion into emerging economies presents significant untapped opportunities, promising a robust future for the UV absorber industry, with the market expected to reach XXX Billion by 2033.
UV Absorber Industry Segmentation
-
1. Types
- 1.1. Benzotriazole
- 1.2. Triazine
- 1.3. Benzophenone
- 1.4. Others
-
2. Application
- 2.1. Adhesives
- 2.2. Coatings
- 2.3. Personal Care
- 2.4. Plastics
- 2.5. Others
UV Absorber Industry Segmentation By Geography
-
1. Asia Pacific
- 1.1. China
- 1.2. India
- 1.3. Japan
- 1.4. South Korea
- 1.5. Rest of Asia Pacific
-
2. North America
- 2.1. United States
- 2.2. Canada
- 2.3. Mexico
-
3. Europe
- 3.1. Germany
- 3.2. United Kingdom
- 3.3. France
- 3.4. Italy
- 3.5. Rest of Europe
-
4. South America
- 4.1. Brazil
- 4.2. Argentina
- 4.3. Rest of South America
-
5. Middle East and Africa
- 5.1. Saudi Arabia
- 5.2. South Africa
- 5.3. Rest of Middle East and Africa
UV Absorber Industry Regional Market Share
Geographic Coverage of UV Absorber Industry
UV Absorber Industry REPORT HIGHLIGHTS
| Aspects | Details |
|---|---|
| Study Period | 2020-2034 |
| Base Year | 2025 |
| Estimated Year | 2026 |
| Forecast Period | 2026-2034 |
| Historical Period | 2020-2025 |
| Growth Rate | CAGR of 5.5% from 2020-2034 |
| Segmentation |
|
Table of Contents
- 1. Introduction
- 1.1. Research Scope
- 1.2. Market Segmentation
- 1.3. Research Objective
- 1.4. Definitions and Assumptions
- 2. Executive Summary
- 2.1. Market Snapshot
- 3. Market Dynamics
- 3.1. Market Drivers
- 3.2. Market Restrains
- 3.3. Market Trends
- 3.4. Market Opportunities
- 4. Market Factor Analysis
- 4.1. Porters Five Forces
- 4.1.1. Bargaining Power of Suppliers
- 4.1.2. Bargaining Power of Buyers
- 4.1.3. Threat of New Entrants
- 4.1.4. Threat of Substitutes
- 4.1.5. Competitive Rivalry
- 4.2. PESTEL analysis
- 4.3. BCG Analysis
- 4.3.1. Stars (High Growth, High Market Share)
- 4.3.2. Cash Cows (Low Growth, High Market Share)
- 4.3.3. Question Mark (High Growth, Low Market Share)
- 4.3.4. Dogs (Low Growth, Low Market Share)
- 4.4. Ansoff Matrix Analysis
- 4.5. Supply Chain Analysis
- 4.6. Regulatory Landscape
- 4.7. Current Market Potential and Opportunity Assessment (TAM–SAM–SOM Framework)
- 4.8. DMV Analyst Note
- 4.1. Porters Five Forces
- 5. Market Analysis, Insights and Forecast 2021-2033
- 5.1. Market Analysis, Insights and Forecast - by Types
- 5.1.1. Benzotriazole
- 5.1.2. Triazine
- 5.1.3. Benzophenone
- 5.1.4. Others
- 5.2. Market Analysis, Insights and Forecast - by Application
- 5.2.1. Adhesives
- 5.2.2. Coatings
- 5.2.3. Personal Care
- 5.2.4. Plastics
- 5.2.5. Others
- 5.3. Market Analysis, Insights and Forecast - by Region
- 5.3.1. Asia Pacific
- 5.3.2. North America
- 5.3.3. Europe
- 5.3.4. South America
- 5.3.5. Middle East and Africa
- 5.1. Market Analysis, Insights and Forecast - by Types
- 6. Global UV Absorber Industry Analysis, Insights and Forecast, 2021-2033
- 6.1. Market Analysis, Insights and Forecast - by Types
- 6.1.1. Benzotriazole
- 6.1.2. Triazine
- 6.1.3. Benzophenone
- 6.1.4. Others
- 6.2. Market Analysis, Insights and Forecast - by Application
- 6.2.1. Adhesives
- 6.2.2. Coatings
- 6.2.3. Personal Care
- 6.2.4. Plastics
- 6.2.5. Others
- 6.1. Market Analysis, Insights and Forecast - by Types
- 7. Asia Pacific UV Absorber Industry Analysis, Insights and Forecast, 2020-2032
- 7.1. Market Analysis, Insights and Forecast - by Types
- 7.1.1. Benzotriazole
- 7.1.2. Triazine
- 7.1.3. Benzophenone
- 7.1.4. Others
- 7.2. Market Analysis, Insights and Forecast - by Application
- 7.2.1. Adhesives
- 7.2.2. Coatings
- 7.2.3. Personal Care
- 7.2.4. Plastics
- 7.2.5. Others
- 7.1. Market Analysis, Insights and Forecast - by Types
- 8. North America UV Absorber Industry Analysis, Insights and Forecast, 2020-2032
- 8.1. Market Analysis, Insights and Forecast - by Types
- 8.1.1. Benzotriazole
- 8.1.2. Triazine
- 8.1.3. Benzophenone
- 8.1.4. Others
- 8.2. Market Analysis, Insights and Forecast - by Application
- 8.2.1. Adhesives
- 8.2.2. Coatings
- 8.2.3. Personal Care
- 8.2.4. Plastics
- 8.2.5. Others
- 8.1. Market Analysis, Insights and Forecast - by Types
- 9. Europe UV Absorber Industry Analysis, Insights and Forecast, 2020-2032
- 9.1. Market Analysis, Insights and Forecast - by Types
- 9.1.1. Benzotriazole
- 9.1.2. Triazine
- 9.1.3. Benzophenone
- 9.1.4. Others
- 9.2. Market Analysis, Insights and Forecast - by Application
- 9.2.1. Adhesives
- 9.2.2. Coatings
- 9.2.3. Personal Care
- 9.2.4. Plastics
- 9.2.5. Others
- 9.1. Market Analysis, Insights and Forecast - by Types
- 10. South America UV Absorber Industry Analysis, Insights and Forecast, 2020-2032
- 10.1. Market Analysis, Insights and Forecast - by Types
- 10.1.1. Benzotriazole
- 10.1.2. Triazine
- 10.1.3. Benzophenone
- 10.1.4. Others
- 10.2. Market Analysis, Insights and Forecast - by Application
- 10.2.1. Adhesives
- 10.2.2. Coatings
- 10.2.3. Personal Care
- 10.2.4. Plastics
- 10.2.5. Others
- 10.1. Market Analysis, Insights and Forecast - by Types
- 11. Middle East and Africa UV Absorber Industry Analysis, Insights and Forecast, 2020-2032
- 11.1. Market Analysis, Insights and Forecast - by Types
- 11.1.1. Benzotriazole
- 11.1.2. Triazine
- 11.1.3. Benzophenone
- 11.1.4. Others
- 11.2. Market Analysis, Insights and Forecast - by Application
- 11.2.1. Adhesives
- 11.2.2. Coatings
- 11.2.3. Personal Care
- 11.2.4. Plastics
- 11.2.5. Others
- 11.1. Market Analysis, Insights and Forecast - by Types
- 12. Competitive Analysis
- 12.1. Company Profiles
- 12.1.1 Clariant
- 12.1.1.1. Company Overview
- 12.1.1.2. Products
- 12.1.1.3. Company Financials
- 12.1.1.4. SWOT Analysis
- 12.1.2 Solvay
- 12.1.2.1. Company Overview
- 12.1.2.2. Products
- 12.1.2.3. Company Financials
- 12.1.2.4. SWOT Analysis
- 12.1.3 Amfine Chemical Corporation
- 12.1.3.1. Company Overview
- 12.1.3.2. Products
- 12.1.3.3. Company Financials
- 12.1.3.4. SWOT Analysis
- 12.1.4 Greenchemicals SpA
- 12.1.4.1. Company Overview
- 12.1.4.2. Products
- 12.1.4.3. Company Financials
- 12.1.4.4. SWOT Analysis
- 12.1.5 Mayzo
- 12.1.5.1. Company Overview
- 12.1.5.2. Products
- 12.1.5.3. Company Financials
- 12.1.5.4. SWOT Analysis
- 12.1.6 Everlight Chemical Industrial Corp
- 12.1.6.1. Company Overview
- 12.1.6.2. Products
- 12.1.6.3. Company Financials
- 12.1.6.4. SWOT Analysis
- 12.1.7 Anhui Best Progress Imp & Exp Co Ltd
- 12.1.7.1. Company Overview
- 12.1.7.2. Products
- 12.1.7.3. Company Financials
- 12.1.7.4. SWOT Analysis
- 12.1.8 BASF SE
- 12.1.8.1. Company Overview
- 12.1.8.2. Products
- 12.1.8.3. Company Financials
- 12.1.8.4. SWOT Analysis
- 12.1.9 Huntsman International LLC
- 12.1.9.1. Company Overview
- 12.1.9.2. Products
- 12.1.9.3. Company Financials
- 12.1.9.4. SWOT Analysis
- 12.1.10 Partners in Chemicals
- 12.1.10.1. Company Overview
- 12.1.10.2. Products
- 12.1.10.3. Company Financials
- 12.1.10.4. SWOT Analysis
- 12.1.11 Hangzhou Disheng Import&Export Co Ltd
- 12.1.11.1. Company Overview
- 12.1.11.2. Products
- 12.1.11.3. Company Financials
- 12.1.11.4. SWOT Analysis
- 12.1.12 Suqian Liansheng Technology Co Ltd
- 12.1.12.1. Company Overview
- 12.1.12.2. Products
- 12.1.12.3. Company Financials
- 12.1.12.4. SWOT Analysis
- 12.1.13 Rianlon Corporation
- 12.1.13.1. Company Overview
- 12.1.13.2. Products
- 12.1.13.3. Company Financials
- 12.1.13.4. SWOT Analysis
- 12.1.14 NYACOL® Nano Technologies Inc
- 12.1.14.1. Company Overview
- 12.1.14.2. Products
- 12.1.14.3. Company Financials
- 12.1.14.4. SWOT Analysis
- 12.1.15 Suqian Liansheng Technology Co Ltd
- 12.1.15.1. Company Overview
- 12.1.15.2. Products
- 12.1.15.3. Company Financials
- 12.1.15.4. SWOT Analysis
- 12.1.16 SABO S p A
- 12.1.16.1. Company Overview
- 12.1.16.2. Products
- 12.1.16.3. Company Financials
- 12.1.16.4. SWOT Analysis
- 12.1.17 Hunan Chemical BV
- 12.1.17.1. Company Overview
- 12.1.17.2. Products
- 12.1.17.3. Company Financials
- 12.1.17.4. SWOT Analysis
- 12.1.18 Tiangang Auxiliary Co Ltd
- 12.1.18.1. Company Overview
- 12.1.18.2. Products
- 12.1.18.3. Company Financials
- 12.1.18.4. SWOT Analysis
- 12.1.19 Milliken Chemical
- 12.1.19.1. Company Overview
- 12.1.19.2. Products
- 12.1.19.3. Company Financials
- 12.1.19.4. SWOT Analysis
- 12.1.20 The Cary Company
- 12.1.20.1. Company Overview
- 12.1.20.2. Products
- 12.1.20.3. Company Financials
- 12.1.20.4. SWOT Analysis
- 12.1.1 Clariant
- 12.2. Market Entropy
- 12.2.1 Company's Key Areas Served
- 12.2.2 Recent Developments
- 12.3. Company Market Share Analysis 2025
- 12.3.1 Top 5 Companies Market Share Analysis
- 12.3.2 Top 3 Companies Market Share Analysis
- 12.4. List of Potential Customers
- 13. Research Methodology
List of Figures
- Figure 1: Global UV Absorber Industry Revenue Breakdown (Billion, %) by Region 2025 & 2033
- Figure 2: Global UV Absorber Industry Volume Breakdown (K Tons, %) by Region 2025 & 2033
- Figure 3: Asia Pacific UV Absorber Industry Revenue (Billion), by Types 2025 & 2033
- Figure 4: Asia Pacific UV Absorber Industry Volume (K Tons), by Types 2025 & 2033
- Figure 5: Asia Pacific UV Absorber Industry Revenue Share (%), by Types 2025 & 2033
- Figure 6: Asia Pacific UV Absorber Industry Volume Share (%), by Types 2025 & 2033
- Figure 7: Asia Pacific UV Absorber Industry Revenue (Billion), by Application 2025 & 2033
- Figure 8: Asia Pacific UV Absorber Industry Volume (K Tons), by Application 2025 & 2033
- Figure 9: Asia Pacific UV Absorber Industry Revenue Share (%), by Application 2025 & 2033
- Figure 10: Asia Pacific UV Absorber Industry Volume Share (%), by Application 2025 & 2033
- Figure 11: Asia Pacific UV Absorber Industry Revenue (Billion), by Country 2025 & 2033
- Figure 12: Asia Pacific UV Absorber Industry Volume (K Tons), by Country 2025 & 2033
- Figure 13: Asia Pacific UV Absorber Industry Revenue Share (%), by Country 2025 & 2033
- Figure 14: Asia Pacific UV Absorber Industry Volume Share (%), by Country 2025 & 2033
- Figure 15: North America UV Absorber Industry Revenue (Billion), by Types 2025 & 2033
- Figure 16: North America UV Absorber Industry Volume (K Tons), by Types 2025 & 2033
- Figure 17: North America UV Absorber Industry Revenue Share (%), by Types 2025 & 2033
- Figure 18: North America UV Absorber Industry Volume Share (%), by Types 2025 & 2033
- Figure 19: North America UV Absorber Industry Revenue (Billion), by Application 2025 & 2033
- Figure 20: North America UV Absorber Industry Volume (K Tons), by Application 2025 & 2033
- Figure 21: North America UV Absorber Industry Revenue Share (%), by Application 2025 & 2033
- Figure 22: North America UV Absorber Industry Volume Share (%), by Application 2025 & 2033
- Figure 23: North America UV Absorber Industry Revenue (Billion), by Country 2025 & 2033
- Figure 24: North America UV Absorber Industry Volume (K Tons), by Country 2025 & 2033
- Figure 25: North America UV Absorber Industry Revenue Share (%), by Country 2025 & 2033
- Figure 26: North America UV Absorber Industry Volume Share (%), by Country 2025 & 2033
- Figure 27: Europe UV Absorber Industry Revenue (Billion), by Types 2025 & 2033
- Figure 28: Europe UV Absorber Industry Volume (K Tons), by Types 2025 & 2033
- Figure 29: Europe UV Absorber Industry Revenue Share (%), by Types 2025 & 2033
- Figure 30: Europe UV Absorber Industry Volume Share (%), by Types 2025 & 2033
- Figure 31: Europe UV Absorber Industry Revenue (Billion), by Application 2025 & 2033
- Figure 32: Europe UV Absorber Industry Volume (K Tons), by Application 2025 & 2033
- Figure 33: Europe UV Absorber Industry Revenue Share (%), by Application 2025 & 2033
- Figure 34: Europe UV Absorber Industry Volume Share (%), by Application 2025 & 2033
- Figure 35: Europe UV Absorber Industry Revenue (Billion), by Country 2025 & 2033
- Figure 36: Europe UV Absorber Industry Volume (K Tons), by Country 2025 & 2033
- Figure 37: Europe UV Absorber Industry Revenue Share (%), by Country 2025 & 2033
- Figure 38: Europe UV Absorber Industry Volume Share (%), by Country 2025 & 2033
- Figure 39: South America UV Absorber Industry Revenue (Billion), by Types 2025 & 2033
- Figure 40: South America UV Absorber Industry Volume (K Tons), by Types 2025 & 2033
- Figure 41: South America UV Absorber Industry Revenue Share (%), by Types 2025 & 2033
- Figure 42: South America UV Absorber Industry Volume Share (%), by Types 2025 & 2033
- Figure 43: South America UV Absorber Industry Revenue (Billion), by Application 2025 & 2033
- Figure 44: South America UV Absorber Industry Volume (K Tons), by Application 2025 & 2033
- Figure 45: South America UV Absorber Industry Revenue Share (%), by Application 2025 & 2033
- Figure 46: South America UV Absorber Industry Volume Share (%), by Application 2025 & 2033
- Figure 47: South America UV Absorber Industry Revenue (Billion), by Country 2025 & 2033
- Figure 48: South America UV Absorber Industry Volume (K Tons), by Country 2025 & 2033
- Figure 49: South America UV Absorber Industry Revenue Share (%), by Country 2025 & 2033
- Figure 50: South America UV Absorber Industry Volume Share (%), by Country 2025 & 2033
- Figure 51: Middle East and Africa UV Absorber Industry Revenue (Billion), by Types 2025 & 2033
- Figure 52: Middle East and Africa UV Absorber Industry Volume (K Tons), by Types 2025 & 2033
- Figure 53: Middle East and Africa UV Absorber Industry Revenue Share (%), by Types 2025 & 2033
- Figure 54: Middle East and Africa UV Absorber Industry Volume Share (%), by Types 2025 & 2033
- Figure 55: Middle East and Africa UV Absorber Industry Revenue (Billion), by Application 2025 & 2033
- Figure 56: Middle East and Africa UV Absorber Industry Volume (K Tons), by Application 2025 & 2033
- Figure 57: Middle East and Africa UV Absorber Industry Revenue Share (%), by Application 2025 & 2033
- Figure 58: Middle East and Africa UV Absorber Industry Volume Share (%), by Application 2025 & 2033
- Figure 59: Middle East and Africa UV Absorber Industry Revenue (Billion), by Country 2025 & 2033
- Figure 60: Middle East and Africa UV Absorber Industry Volume (K Tons), by Country 2025 & 2033
- Figure 61: Middle East and Africa UV Absorber Industry Revenue Share (%), by Country 2025 & 2033
- Figure 62: Middle East and Africa UV Absorber Industry Volume Share (%), by Country 2025 & 2033
List of Tables
- Table 1: Global UV Absorber Industry Revenue Billion Forecast, by Types 2020 & 2033
- Table 2: Global UV Absorber Industry Volume K Tons Forecast, by Types 2020 & 2033
- Table 3: Global UV Absorber Industry Revenue Billion Forecast, by Application 2020 & 2033
- Table 4: Global UV Absorber Industry Volume K Tons Forecast, by Application 2020 & 2033
- Table 5: Global UV Absorber Industry Revenue Billion Forecast, by Region 2020 & 2033
- Table 6: Global UV Absorber Industry Volume K Tons Forecast, by Region 2020 & 2033
- Table 7: Global UV Absorber Industry Revenue Billion Forecast, by Types 2020 & 2033
- Table 8: Global UV Absorber Industry Volume K Tons Forecast, by Types 2020 & 2033
- Table 9: Global UV Absorber Industry Revenue Billion Forecast, by Application 2020 & 2033
- Table 10: Global UV Absorber Industry Volume K Tons Forecast, by Application 2020 & 2033
- Table 11: Global UV Absorber Industry Revenue Billion Forecast, by Country 2020 & 2033
- Table 12: Global UV Absorber Industry Volume K Tons Forecast, by Country 2020 & 2033
- Table 13: China UV Absorber Industry Revenue (Billion) Forecast, by Application 2020 & 2033
- Table 14: China UV Absorber Industry Volume (K Tons) Forecast, by Application 2020 & 2033
- Table 15: India UV Absorber Industry Revenue (Billion) Forecast, by Application 2020 & 2033
- Table 16: India UV Absorber Industry Volume (K Tons) Forecast, by Application 2020 & 2033
- Table 17: Japan UV Absorber Industry Revenue (Billion) Forecast, by Application 2020 & 2033
- Table 18: Japan UV Absorber Industry Volume (K Tons) Forecast, by Application 2020 & 2033
- Table 19: South Korea UV Absorber Industry Revenue (Billion) Forecast, by Application 2020 & 2033
- Table 20: South Korea UV Absorber Industry Volume (K Tons) Forecast, by Application 2020 & 2033
- Table 21: Rest of Asia Pacific UV Absorber Industry Revenue (Billion) Forecast, by Application 2020 & 2033
- Table 22: Rest of Asia Pacific UV Absorber Industry Volume (K Tons) Forecast, by Application 2020 & 2033
- Table 23: Global UV Absorber Industry Revenue Billion Forecast, by Types 2020 & 2033
- Table 24: Global UV Absorber Industry Volume K Tons Forecast, by Types 2020 & 2033
- Table 25: Global UV Absorber Industry Revenue Billion Forecast, by Application 2020 & 2033
- Table 26: Global UV Absorber Industry Volume K Tons Forecast, by Application 2020 & 2033
- Table 27: Global UV Absorber Industry Revenue Billion Forecast, by Country 2020 & 2033
- Table 28: Global UV Absorber Industry Volume K Tons Forecast, by Country 2020 & 2033
- Table 29: United States UV Absorber Industry Revenue (Billion) Forecast, by Application 2020 & 2033
- Table 30: United States UV Absorber Industry Volume (K Tons) Forecast, by Application 2020 & 2033
- Table 31: Canada UV Absorber Industry Revenue (Billion) Forecast, by Application 2020 & 2033
- Table 32: Canada UV Absorber Industry Volume (K Tons) Forecast, by Application 2020 & 2033
- Table 33: Mexico UV Absorber Industry Revenue (Billion) Forecast, by Application 2020 & 2033
- Table 34: Mexico UV Absorber Industry Volume (K Tons) Forecast, by Application 2020 & 2033
- Table 35: Global UV Absorber Industry Revenue Billion Forecast, by Types 2020 & 2033
- Table 36: Global UV Absorber Industry Volume K Tons Forecast, by Types 2020 & 2033
- Table 37: Global UV Absorber Industry Revenue Billion Forecast, by Application 2020 & 2033
- Table 38: Global UV Absorber Industry Volume K Tons Forecast, by Application 2020 & 2033
- Table 39: Global UV Absorber Industry Revenue Billion Forecast, by Country 2020 & 2033
- Table 40: Global UV Absorber Industry Volume K Tons Forecast, by Country 2020 & 2033
- Table 41: Germany UV Absorber Industry Revenue (Billion) Forecast, by Application 2020 & 2033
- Table 42: Germany UV Absorber Industry Volume (K Tons) Forecast, by Application 2020 & 2033
- Table 43: United Kingdom UV Absorber Industry Revenue (Billion) Forecast, by Application 2020 & 2033
- Table 44: United Kingdom UV Absorber Industry Volume (K Tons) Forecast, by Application 2020 & 2033
- Table 45: France UV Absorber Industry Revenue (Billion) Forecast, by Application 2020 & 2033
- Table 46: France UV Absorber Industry Volume (K Tons) Forecast, by Application 2020 & 2033
- Table 47: Italy UV Absorber Industry Revenue (Billion) Forecast, by Application 2020 & 2033
- Table 48: Italy UV Absorber Industry Volume (K Tons) Forecast, by Application 2020 & 2033
- Table 49: Rest of Europe UV Absorber Industry Revenue (Billion) Forecast, by Application 2020 & 2033
- Table 50: Rest of Europe UV Absorber Industry Volume (K Tons) Forecast, by Application 2020 & 2033
- Table 51: Global UV Absorber Industry Revenue Billion Forecast, by Types 2020 & 2033
- Table 52: Global UV Absorber Industry Volume K Tons Forecast, by Types 2020 & 2033
- Table 53: Global UV Absorber Industry Revenue Billion Forecast, by Application 2020 & 2033
- Table 54: Global UV Absorber Industry Volume K Tons Forecast, by Application 2020 & 2033
- Table 55: Global UV Absorber Industry Revenue Billion Forecast, by Country 2020 & 2033
- Table 56: Global UV Absorber Industry Volume K Tons Forecast, by Country 2020 & 2033
- Table 57: Brazil UV Absorber Industry Revenue (Billion) Forecast, by Application 2020 & 2033
- Table 58: Brazil UV Absorber Industry Volume (K Tons) Forecast, by Application 2020 & 2033
- Table 59: Argentina UV Absorber Industry Revenue (Billion) Forecast, by Application 2020 & 2033
- Table 60: Argentina UV Absorber Industry Volume (K Tons) Forecast, by Application 2020 & 2033
- Table 61: Rest of South America UV Absorber Industry Revenue (Billion) Forecast, by Application 2020 & 2033
- Table 62: Rest of South America UV Absorber Industry Volume (K Tons) Forecast, by Application 2020 & 2033
- Table 63: Global UV Absorber Industry Revenue Billion Forecast, by Types 2020 & 2033
- Table 64: Global UV Absorber Industry Volume K Tons Forecast, by Types 2020 & 2033
- Table 65: Global UV Absorber Industry Revenue Billion Forecast, by Application 2020 & 2033
- Table 66: Global UV Absorber Industry Volume K Tons Forecast, by Application 2020 & 2033
- Table 67: Global UV Absorber Industry Revenue Billion Forecast, by Country 2020 & 2033
- Table 68: Global UV Absorber Industry Volume K Tons Forecast, by Country 2020 & 2033
- Table 69: Saudi Arabia UV Absorber Industry Revenue (Billion) Forecast, by Application 2020 & 2033
- Table 70: Saudi Arabia UV Absorber Industry Volume (K Tons) Forecast, by Application 2020 & 2033
- Table 71: South Africa UV Absorber Industry Revenue (Billion) Forecast, by Application 2020 & 2033
- Table 72: South Africa UV Absorber Industry Volume (K Tons) Forecast, by Application 2020 & 2033
- Table 73: Rest of Middle East and Africa UV Absorber Industry Revenue (Billion) Forecast, by Application 2020 & 2033
- Table 74: Rest of Middle East and Africa UV Absorber Industry Volume (K Tons) Forecast, by Application 2020 & 2033
Frequently Asked Questions
1. What is the projected Compound Annual Growth Rate (CAGR) of the UV Absorber Industry?
The projected CAGR is approximately 5.5%.
2. Which companies are prominent players in the UV Absorber Industry?
Key companies in the market include Clariant, Solvay, Amfine Chemical Corporation, Greenchemicals SpA, Mayzo, Everlight Chemical Industrial Corp, Anhui Best Progress Imp & Exp Co Ltd, BASF SE, Huntsman International LLC, Partners in Chemicals, Hangzhou Disheng Import&Export Co Ltd, Suqian Liansheng Technology Co Ltd , Rianlon Corporation, NYACOL® Nano Technologies Inc, Suqian Liansheng Technology Co Ltd, SABO S p A, Hunan Chemical BV, Tiangang Auxiliary Co Ltd, Milliken Chemical, The Cary Company.
3. What are the main segments of the UV Absorber Industry?
The market segments include Types, Application.
4. Can you provide details about the market size?
The market size is estimated to be USD 1.49 Billion as of 2022.
5. What are some drivers contributing to market growth?
; Growing Application in Plastics and Packaging; Other Drivers.
6. What are the notable trends driving market growth?
Plastic to Dominate the Market.
7. Are there any restraints impacting market growth?
; Environmental Concerns of Benzotriazole UV Absorber; Unfavorable Conditions Arising Due to COVID-19 Outbreak.
8. Can you provide examples of recent developments in the market?
N/A
9. What pricing options are available for accessing the report?
Pricing options include single-user, multi-user, and enterprise licenses priced at USD 4750, USD 5250, and USD 8750 respectively.
10. Is the market size provided in terms of value or volume?
The market size is provided in terms of value, measured in Billion and volume, measured in K Tons.
11. Are there any specific market keywords associated with the report?
Yes, the market keyword associated with the report is "UV Absorber Industry," which aids in identifying and referencing the specific market segment covered.
12. How do I determine which pricing option suits my needs best?
The pricing options vary based on user requirements and access needs. Individual users may opt for single-user licenses, while businesses requiring broader access may choose multi-user or enterprise licenses for cost-effective access to the report.
13. Are there any additional resources or data provided in the UV Absorber Industry report?
While the report offers comprehensive insights, it's advisable to review the specific contents or supplementary materials provided to ascertain if additional resources or data are available.
14. How can I stay updated on further developments or reports in the UV Absorber Industry?
To stay informed about further developments, trends, and reports in the UV Absorber Industry, consider subscribing to industry newsletters, following relevant companies and organizations, or regularly checking reputable industry news sources and publications.
Methodology
Step 1 - Identification of Relevant Samples Size from Population Database


Step 2 - Approaches for Defining Global Market Size (Value, Volume* & Price*)

Note*: In applicable scenarios
Step 3 - Data Sources
Primary Research
- Web Analytics
- Survey Reports
- Research Institute
- Latest Research Reports
- Opinion Leaders
Secondary Research
- Annual Reports
- White Paper
- Latest Press Release
- Industry Association
- Paid Database
- Investor Presentations

Step 4 - Data Triangulation
Involves using different sources of information in order to increase the validity of a study
These sources are likely to be stakeholders in a program - participants, other researchers, program staff, other community members, and so on.
Then we put all data in single framework & apply various statistical tools to find out the dynamic on the market.
During the analysis stage, feedback from the stakeholder groups would be compared to determine areas of agreement as well as areas of divergence