

Key Insights
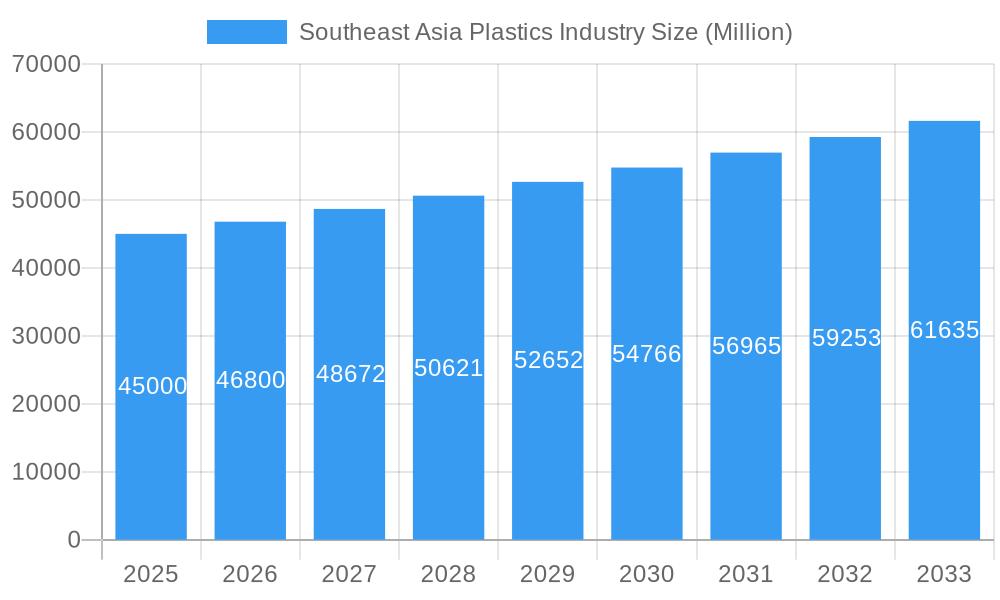
The Southeast Asia plastics market is projected for substantial growth, expected to reach $12,452.7 million by 2024, exhibiting a CAGR of 5.15%. This expansion is driven by robust demand across key sectors, with packaging leading the way. Factors like a growing consumer base and the booming e-commerce sector in nations such as Indonesia, Vietnam, and the Philippines are significantly boosting packaging solutions. Additionally, the rapidly developing electrical & electronics, automotive, and construction industries present considerable opportunities for high-performance engineering plastics. The increasing focus on sustainability and circular economy principles is also accelerating the adoption of bioplastics, signaling a move towards eco-friendly material choices.
Southeast Asia Plastics Industry Market Size (In Billion)
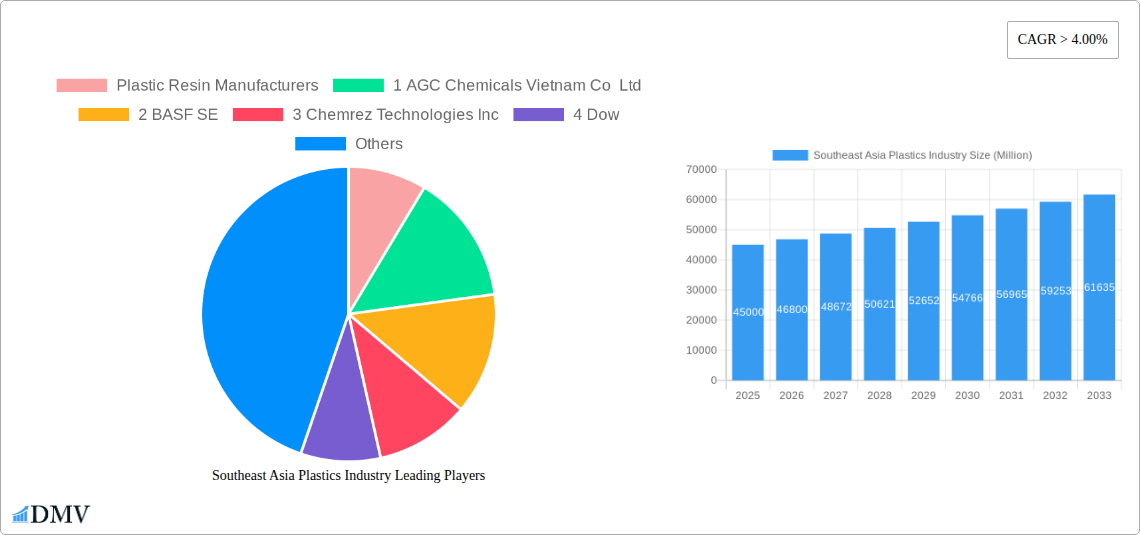
Advancements in manufacturing technologies, including blow molding, extrusion, and injection molding, are enhancing efficiency and product diversity. Major global players like BASF SE, Dow, and DuPont, alongside regional leaders such as JG Summit Petrochemical Corporation and Philippine Resins Industries Inc., are investing in innovation and capacity. Despite this, challenges such as fluctuating raw material costs and stricter regulations on plastic waste management persist. Successfully navigating these hurdles while leveraging strong application demand and strategic investments will be vital for sustained market growth and leadership.
Southeast Asia Plastics Industry Company Market Share
Southeast Asia Plastics Industry Market Composition & Trends
This comprehensive report dives deep into the dynamic Southeast Asia plastics industry, offering a granular view of its market composition and evolving trends. The market exhibits a moderate concentration, with a mix of large multinational corporations and emerging local players vying for market share. Innovation catalysts are primarily driven by the increasing demand for sustainable materials, advanced packaging solutions, and high-performance plastics in sectors like automotive and electronics. Regulatory landscapes are shifting, with governments across the region implementing stricter environmental policies and promoting circular economy initiatives, impacting virgin plastic production and recycling infrastructure. Substitute products, such as paper, glass, and metal, pose a continuous challenge, particularly in the packaging segment, though the inherent cost-effectiveness and versatility of plastics often maintain their dominance. End-user profiles are diverse, ranging from large-scale manufacturers requiring bulk resins to specialized converters producing niche plastic products. Mergers and acquisitions (M&A) activities are on the rise as companies seek to consolidate their market positions, gain access to new technologies, and expand their geographical reach. M&A deal values are estimated to be in the range of several hundred Million to over a Billion dollars, reflecting strategic consolidation and investment in the region's plastic manufacturing capabilities. Market share distribution is dynamic, with key segments like packaging and construction demonstrating significant contributions to the overall market value.
- Market Concentration: Moderate, with a blend of global giants and regional specialists.
- Innovation Drivers: Sustainability, advanced materials, and specialized applications.
- Regulatory Influence: Increasing focus on environmental compliance and circularity.
- Substitute Threats: Continuous competition from paper, glass, and metal, particularly in packaging.
- End-User Segments: Diverse, from large-scale industrial consumers to niche product manufacturers.
- M&A Activity: Significant, with strategic acquisitions to enhance market presence and capabilities.
- Estimated M&A Deal Value: Ranging from hundreds of Millions to over a Billion dollars.
Southeast Asia Plastics Industry Industry Evolution
The Southeast Asia plastics industry has undergone a remarkable evolution, driven by a confluence of economic growth, technological advancements, and shifting consumer demands. Over the historical period of 2019–2024, the market witnessed steady growth, buoyed by robust demand from burgeoning economies and expanding manufacturing sectors. The base year, 2025, marks a pivotal point where established trends are solidifying and new growth trajectories are emerging. The forecast period, 2025–2033, anticipates accelerated expansion, fueled by increasing urbanization, a growing middle class, and continued industrialization across key geographies like Indonesia, Thailand, Malaysia, Singapore, the Philippines, and Vietnam. Technological advancements have been instrumental in this evolution. Innovations in polymer science have led to the development of higher-performance plastics with enhanced durability, lighter weight, and improved recyclability. The adoption of advanced manufacturing technologies such as Industry 4.0 principles, including automation and digitalization, is revolutionizing production processes, leading to greater efficiency and reduced operational costs. Extrusion and injection molding continue to be dominant technologies, catering to the vast demand for plastic products in packaging, automotive, and construction. However, there's a noticeable surge in the adoption of specialized molding techniques and additive manufacturing for complex designs and custom applications. Consumer demands are also playing a critical role. There's a growing preference for convenient, safe, and aesthetically pleasing plastic products, particularly in consumer goods and packaging. Concurrently, a heightened awareness of environmental issues is driving demand for sustainable plastic solutions, including recycled content and biodegradable alternatives. This dual demand – for performance and sustainability – is pushing manufacturers to innovate and adapt their product portfolios. The market growth trajectory is projected to be strong, with an estimated Compound Annual Growth Rate (CAGR) of approximately 5-7% during the forecast period. Adoption metrics for new technologies and sustainable materials are expected to see significant increases, indicating a proactive industry response to evolving market dynamics. The industry's evolution is characterized by a dynamic interplay between economic imperatives, technological innovation, and a growing consciousness towards environmental stewardship.
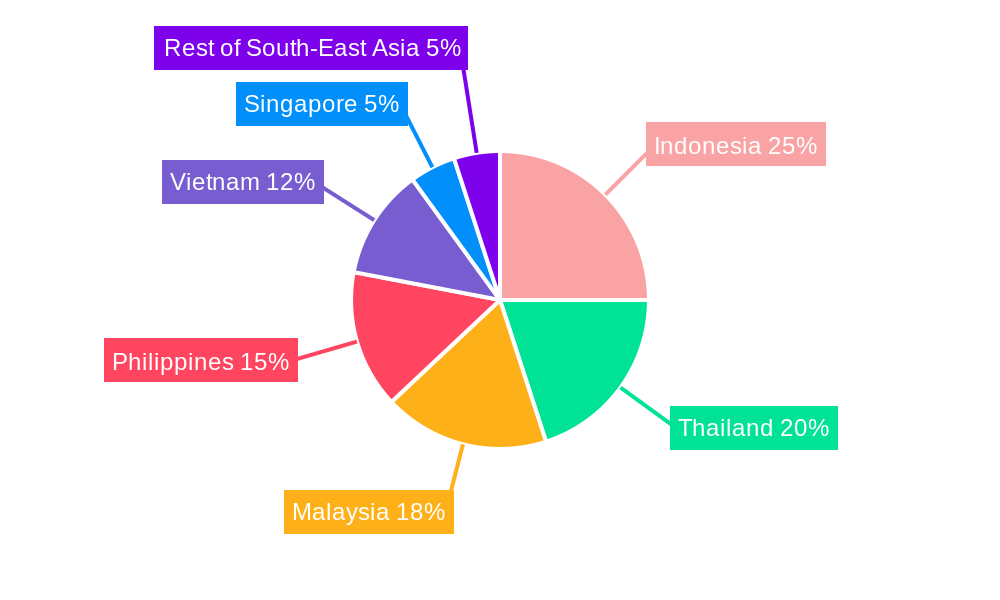
Leading Regions, Countries, or Segments in Southeast Asia Plastics Industry
The Southeast Asia plastics industry is a vibrant tapestry woven with regional strengths and specialized segment dominance. Within this dynamic landscape, Packaging emerges as a consistently leading application segment, driven by the region's rapidly growing consumer base and the inherent need for efficient and safe product containment. The burgeoning e-commerce sector further amplifies this demand for innovative and durable packaging solutions. Indonesia stands out as a leading country, owing to its vast population, growing middle class, and significant manufacturing base, making it a powerhouse for plastic consumption and production. Thailand and Vietnam also exhibit substantial market presence, characterized by strong export-oriented manufacturing and increasing domestic demand.
- Dominant Application Segment: Packaging, a multi-billion dollar market segment, driven by food & beverage, personal care, and e-commerce sectors.
- Key Drivers for Packaging Dominance:
- Growing consumer disposable income leading to increased consumption of packaged goods.
- Expansion of the e-commerce industry necessitating robust and protective packaging.
- Demand for flexible and rigid packaging solutions across various end-user industries.
- Innovation in sustainable packaging materials and designs.
- Key Drivers for Packaging Dominance:
- Leading Country: Indonesia, with a market size estimated to be in the tens of Billions of dollars.
- Dominance Factors in Indonesia:
- Largest population in Southeast Asia, providing a massive consumer base.
- Significant presence of multinational and local plastic product manufacturers.
- Government initiatives supporting industrial growth and investment.
- Abundant raw material availability for certain plastic types.
- Dominance Factors in Indonesia:
- Prominent Technology: Extrusion and Injection Molding remain the workhorses of the industry, accounting for a substantial portion of the production volume and market value, estimated to be over 80% of the technological segment. These technologies are essential for producing a wide array of products, from films and pipes to complex components.
- Drivers for Extrusion/Injection Molding Dominance:
- Versatility in producing a wide range of plastic products.
- Cost-effectiveness for mass production.
- Established infrastructure and expertise in the region.
- Continuous technological advancements improving efficiency and precision.
- Drivers for Extrusion/Injection Molding Dominance:
- Key Type Segment: Traditional Plastics, including Polyethylene (PE), Polypropylene (PP), and Polyvinyl Chloride (PVC), continue to dominate due to their cost-effectiveness and widespread applications across various industries. Their market value is in the tens of Billions of dollars.
- Reasons for Traditional Plastics Dominance:
- Lower production costs compared to engineering or bioplastics.
- Well-established supply chains and manufacturing capabilities.
- Broad applicability in high-volume sectors like packaging and construction.
- Ongoing efforts to improve recyclability and circularity of traditional plastics.
- Reasons for Traditional Plastics Dominance:
- Significant Geography: Rest of South-East Asia, encompassing countries like Cambodia, Laos, Myanmar, and Brunei, represents a rapidly emerging market with untapped potential, particularly in consumer goods and infrastructure development, contributing several hundred Million dollars to the regional market.
- Growth Catalysts in Emerging Geographies:
- Increasing foreign direct investment in manufacturing.
- Urbanization and rising consumer spending power.
- Government focus on developing industrial zones and infrastructure.
- Growing demand for basic plastic products in households and small businesses.
- Growth Catalysts in Emerging Geographies:
Southeast Asia Plastics Industry Product Innovations
The Southeast Asia plastics industry is buzzing with innovative product development, driven by the pursuit of enhanced performance, sustainability, and specialized applications. Manufacturers are increasingly focusing on developing advanced plastic compounds with superior mechanical properties, thermal resistance, and chemical inertness for demanding sectors like automotive and electrical & electronics. A significant trend is the integration of recycled content into high-quality plastic products, often achieving performance metrics comparable to virgin materials. Innovations in bioplastics are also gaining traction, with new formulations offering biodegradability and compostability without compromising functionality, particularly in food packaging and single-use items. Performance metrics such as increased tensile strength, improved impact resistance, and extended product lifecycles are key selling propositions for these novel materials and products.
Propelling Factors for Southeast Asia Plastics Industry Growth
The growth of the Southeast Asia plastics industry is propelled by a powerful combination of economic, technological, and demographic forces. A burgeoning middle class with rising disposable incomes translates directly into increased demand for plastic-containing consumer goods, packaging, and durables. Government support through favorable industrial policies and infrastructure development further fuels investment and expansion. Technological advancements in polymer science and manufacturing processes enable the production of higher-performing, more sustainable, and cost-effective plastic solutions. For instance, innovations in recycling technologies are making recycled plastics more viable for a wider range of applications, addressing environmental concerns and creating new market opportunities.
- Economic Growth & Rising Disposable Income: Driving demand for consumer goods, packaging, and appliances.
- Favorable Government Policies: Incentives for manufacturing, infrastructure development, and investment.
- Technological Advancements: Leading to improved material properties, efficient production, and sustainable solutions.
- Urbanization: Increasing the need for housing, infrastructure, and consumer products.
- Growth of Key End-Use Industries: Such as automotive, electrical & electronics, and construction, which are significant consumers of plastic materials.
Obstacles in the Southeast Asia Plastics Industry Market
Despite its robust growth, the Southeast Asia plastics industry faces several significant obstacles. Stringent and evolving environmental regulations, particularly concerning single-use plastics and waste management, pose compliance challenges and necessitate substantial investment in sustainable practices. Supply chain disruptions, exacerbated by geopolitical events and fluctuating raw material prices, can impact production costs and lead times, affecting market stability. Intense competition, both from regional players and international manufacturers, exerts downward pressure on prices and margins. Furthermore, public perception and growing consumer concern over plastic pollution create reputational risks and necessitate proactive communication and action regarding the industry's sustainability efforts.
- Regulatory Hurdles: Increasingly strict environmental policies on plastic usage and waste.
- Supply Chain Volatility: Fluctuating raw material costs and availability.
- Intense Competition: Pressure on pricing and profitability from numerous market participants.
- Negative Public Perception: Growing consumer and societal concern over plastic waste and pollution.
- Investment in Sustainable Infrastructure: The cost associated with transitioning to circular economy models.
Future Opportunities in Southeast Asia Plastics Industry
The future of the Southeast Asia plastics industry is ripe with opportunities, particularly in the realm of sustainable solutions and high-growth application sectors. The increasing global and regional push towards a circular economy presents a massive opportunity for companies investing in advanced recycling technologies, the development of biodegradable and compostable plastics, and the incorporation of higher percentages of recycled content into their products. Emerging markets within Southeast Asia offer untapped potential for expansion, driven by developing economies and increasing consumer demand for basic plastic goods. Furthermore, the growing demand for lightweight and high-performance plastics in sectors like electric vehicles and renewable energy infrastructure presents significant avenues for innovation and market penetration.
- Circular Economy Solutions: Investment in advanced recycling, bioplastics, and recycled content incorporation.
- Emerging Market Penetration: Tapping into the vast potential of developing economies within the region.
- High-Performance Plastics Applications: Serving the growing needs of electric vehicles, renewable energy, and advanced electronics.
- Smart Packaging Innovations: Development of intelligent and functional packaging solutions.
- Digitalization and Automation: Enhancing operational efficiency and supply chain management.
Major Players in the Southeast Asia Plastics Industry Ecosystem
- AGC Chemicals Vietnam Co Ltd
- BASF SE
- Chemrez Technologies Inc
- Dow
- DuPont
- JG Summit Petrochemical Corporation
- LyondellBasell Industries Holdings B V
- Nan Ya Plastics Corporation (Formosa)
- NPC Alliance Corporation
- Petron Corporation
- Philippine Resins Industries Inc
- Ampac Holdings LLC
- Bavico Ltd
- Binh Minh Plastic
- Chan Thuan Thanh Plastic Mechanical & Trading Co Ltd
- Cholon Plastic Co Ltd
- City Long (Cambodia) Co Ltd
- Duy Tan Plastics Corporation
Key Developments in Southeast Asia Plastics Industry Industry
- 2023/2024: Major plastic resin manufacturers announced significant investments in expanding production capacities for high-demand polymers like polyethylene and polypropylene to meet growing regional demand. This includes multi-hundred Million dollar expansions.
- 2023: Several plastic product manufacturers focused on developing and launching new product lines incorporating a higher percentage of recycled content, responding to increased consumer and regulatory pressure for sustainability.
- 2023: Key players in the automotive and electronics sectors are increasing their adoption of engineering plastics for lightweighting and enhanced performance, driving innovation in specialized polymer compounds.
- 2024: Companies are actively exploring strategic partnerships and M&A opportunities to consolidate their market position and gain access to new technologies, particularly in the area of chemical recycling and bioplastics. Several deals worth hundreds of Millions are in advanced stages.
- 2024: Governments in countries like Vietnam and Thailand are introducing new incentives and regulations to promote plastic waste management and the development of a circular economy, influencing investment decisions and R&D focus.
Strategic Southeast Asia Plastics Industry Market Forecast
The strategic forecast for the Southeast Asia plastics industry is exceptionally positive, driven by sustained economic expansion, increasing urbanization, and a growing middle class that fuels demand across key application sectors like packaging, automotive, and construction. The pivotal role of technological innovation, particularly in advanced materials and sustainable solutions, will continue to shape market dynamics, offering significant growth catalysts. The industry is poised for substantial expansion, with an estimated market value projected to reach tens of Billions of dollars by 2033. Companies that strategically invest in circular economy initiatives, digital transformation, and high-performance material development will be best positioned to capitalize on future opportunities and achieve market leadership in this dynamic and evolving sector.
Southeast Asia Plastics Industry Segmentation
-
1. Type
- 1.1. Traditional Plastics
- 1.2. Engineering Plastics
- 1.3. Bioplastics
-
2. Technology
- 2.1. Blow Molding
- 2.2. Extrusion
- 2.3. Injection Molding
- 2.4. Other Technologies
-
3. Application
- 3.1. Packaging
- 3.2. Electrical and Electronics
- 3.3. Building and Construction
- 3.4. Automotive and Transportation
- 3.5. Housewares
- 3.6. Furniture and Bedding
- 3.7. Other Applications
-
4. Geography
- 4.1. Indonesia
- 4.2. Thailand
- 4.3. Malaysia
- 4.4. Singapore
- 4.5. Philippines
- 4.6. Vietnam
- 4.7. Rest of South-East Asia
Southeast Asia Plastics Industry Segmentation By Geography
- 1. Indonesia
- 2. Thailand
- 3. Malaysia
- 4. Singapore
- 5. Philippines
- 6. Vietnam
- 7. Rest of South East Asia
Southeast Asia Plastics Industry Regional Market Share
Geographic Coverage of Southeast Asia Plastics Industry
Southeast Asia Plastics Industry REPORT HIGHLIGHTS
| Aspects | Details |
|---|---|
| Study Period | 2020-2034 |
| Base Year | 2025 |
| Estimated Year | 2026 |
| Forecast Period | 2026-2034 |
| Historical Period | 2020-2025 |
| Growth Rate | CAGR of 5.15% from 2020-2034 |
| Segmentation |
|
Table of Contents
- 1. Introduction
- 1.1. Research Scope
- 1.2. Market Segmentation
- 1.3. Research Objective
- 1.4. Definitions and Assumptions
- 2. Executive Summary
- 2.1. Market Snapshot
- 3. Market Dynamics
- 3.1. Market Drivers
- 3.2. Market Restrains
- 3.3. Market Trends
- 3.4. Market Opportunities
- 4. Market Factor Analysis
- 4.1. Porters Five Forces
- 4.1.1. Bargaining Power of Suppliers
- 4.1.2. Bargaining Power of Buyers
- 4.1.3. Threat of New Entrants
- 4.1.4. Threat of Substitutes
- 4.1.5. Competitive Rivalry
- 4.2. PESTEL analysis
- 4.3. BCG Analysis
- 4.3.1. Stars (High Growth, High Market Share)
- 4.3.2. Cash Cows (Low Growth, High Market Share)
- 4.3.3. Question Mark (High Growth, Low Market Share)
- 4.3.4. Dogs (Low Growth, Low Market Share)
- 4.4. Ansoff Matrix Analysis
- 4.5. Supply Chain Analysis
- 4.6. Regulatory Landscape
- 4.7. Current Market Potential and Opportunity Assessment (TAM–SAM–SOM Framework)
- 4.8. DMV Analyst Note
- 4.1. Porters Five Forces
- 5. Market Analysis, Insights and Forecast 2021-2033
- 5.1. Market Analysis, Insights and Forecast - by Type
- 5.1.1. Traditional Plastics
- 5.1.2. Engineering Plastics
- 5.1.3. Bioplastics
- 5.2. Market Analysis, Insights and Forecast - by Technology
- 5.2.1. Blow Molding
- 5.2.2. Extrusion
- 5.2.3. Injection Molding
- 5.2.4. Other Technologies
- 5.3. Market Analysis, Insights and Forecast - by Application
- 5.3.1. Packaging
- 5.3.2. Electrical and Electronics
- 5.3.3. Building and Construction
- 5.3.4. Automotive and Transportation
- 5.3.5. Housewares
- 5.3.6. Furniture and Bedding
- 5.3.7. Other Applications
- 5.4. Market Analysis, Insights and Forecast - by Geography
- 5.4.1. Indonesia
- 5.4.2. Thailand
- 5.4.3. Malaysia
- 5.4.4. Singapore
- 5.4.5. Philippines
- 5.4.6. Vietnam
- 5.4.7. Rest of South-East Asia
- 5.5. Market Analysis, Insights and Forecast - by Region
- 5.5.1. Indonesia
- 5.5.2. Thailand
- 5.5.3. Malaysia
- 5.5.4. Singapore
- 5.5.5. Philippines
- 5.5.6. Vietnam
- 5.5.7. Rest of South East Asia
- 5.1. Market Analysis, Insights and Forecast - by Type
- 6. Global Southeast Asia Plastics Industry Analysis, Insights and Forecast, 2021-2033
- 6.1. Market Analysis, Insights and Forecast - by Type
- 6.1.1. Traditional Plastics
- 6.1.2. Engineering Plastics
- 6.1.3. Bioplastics
- 6.2. Market Analysis, Insights and Forecast - by Technology
- 6.2.1. Blow Molding
- 6.2.2. Extrusion
- 6.2.3. Injection Molding
- 6.2.4. Other Technologies
- 6.3. Market Analysis, Insights and Forecast - by Application
- 6.3.1. Packaging
- 6.3.2. Electrical and Electronics
- 6.3.3. Building and Construction
- 6.3.4. Automotive and Transportation
- 6.3.5. Housewares
- 6.3.6. Furniture and Bedding
- 6.3.7. Other Applications
- 6.4. Market Analysis, Insights and Forecast - by Geography
- 6.4.1. Indonesia
- 6.4.2. Thailand
- 6.4.3. Malaysia
- 6.4.4. Singapore
- 6.4.5. Philippines
- 6.4.6. Vietnam
- 6.4.7. Rest of South-East Asia
- 6.1. Market Analysis, Insights and Forecast - by Type
- 7. Indonesia Southeast Asia Plastics Industry Analysis, Insights and Forecast, 2020-2032
- 7.1. Market Analysis, Insights and Forecast - by Type
- 7.1.1. Traditional Plastics
- 7.1.2. Engineering Plastics
- 7.1.3. Bioplastics
- 7.2. Market Analysis, Insights and Forecast - by Technology
- 7.2.1. Blow Molding
- 7.2.2. Extrusion
- 7.2.3. Injection Molding
- 7.2.4. Other Technologies
- 7.3. Market Analysis, Insights and Forecast - by Application
- 7.3.1. Packaging
- 7.3.2. Electrical and Electronics
- 7.3.3. Building and Construction
- 7.3.4. Automotive and Transportation
- 7.3.5. Housewares
- 7.3.6. Furniture and Bedding
- 7.3.7. Other Applications
- 7.4. Market Analysis, Insights and Forecast - by Geography
- 7.4.1. Indonesia
- 7.4.2. Thailand
- 7.4.3. Malaysia
- 7.4.4. Singapore
- 7.4.5. Philippines
- 7.4.6. Vietnam
- 7.4.7. Rest of South-East Asia
- 7.1. Market Analysis, Insights and Forecast - by Type
- 8. Thailand Southeast Asia Plastics Industry Analysis, Insights and Forecast, 2020-2032
- 8.1. Market Analysis, Insights and Forecast - by Type
- 8.1.1. Traditional Plastics
- 8.1.2. Engineering Plastics
- 8.1.3. Bioplastics
- 8.2. Market Analysis, Insights and Forecast - by Technology
- 8.2.1. Blow Molding
- 8.2.2. Extrusion
- 8.2.3. Injection Molding
- 8.2.4. Other Technologies
- 8.3. Market Analysis, Insights and Forecast - by Application
- 8.3.1. Packaging
- 8.3.2. Electrical and Electronics
- 8.3.3. Building and Construction
- 8.3.4. Automotive and Transportation
- 8.3.5. Housewares
- 8.3.6. Furniture and Bedding
- 8.3.7. Other Applications
- 8.4. Market Analysis, Insights and Forecast - by Geography
- 8.4.1. Indonesia
- 8.4.2. Thailand
- 8.4.3. Malaysia
- 8.4.4. Singapore
- 8.4.5. Philippines
- 8.4.6. Vietnam
- 8.4.7. Rest of South-East Asia
- 8.1. Market Analysis, Insights and Forecast - by Type
- 9. Malaysia Southeast Asia Plastics Industry Analysis, Insights and Forecast, 2020-2032
- 9.1. Market Analysis, Insights and Forecast - by Type
- 9.1.1. Traditional Plastics
- 9.1.2. Engineering Plastics
- 9.1.3. Bioplastics
- 9.2. Market Analysis, Insights and Forecast - by Technology
- 9.2.1. Blow Molding
- 9.2.2. Extrusion
- 9.2.3. Injection Molding
- 9.2.4. Other Technologies
- 9.3. Market Analysis, Insights and Forecast - by Application
- 9.3.1. Packaging
- 9.3.2. Electrical and Electronics
- 9.3.3. Building and Construction
- 9.3.4. Automotive and Transportation
- 9.3.5. Housewares
- 9.3.6. Furniture and Bedding
- 9.3.7. Other Applications
- 9.4. Market Analysis, Insights and Forecast - by Geography
- 9.4.1. Indonesia
- 9.4.2. Thailand
- 9.4.3. Malaysia
- 9.4.4. Singapore
- 9.4.5. Philippines
- 9.4.6. Vietnam
- 9.4.7. Rest of South-East Asia
- 9.1. Market Analysis, Insights and Forecast - by Type
- 10. Singapore Southeast Asia Plastics Industry Analysis, Insights and Forecast, 2020-2032
- 10.1. Market Analysis, Insights and Forecast - by Type
- 10.1.1. Traditional Plastics
- 10.1.2. Engineering Plastics
- 10.1.3. Bioplastics
- 10.2. Market Analysis, Insights and Forecast - by Technology
- 10.2.1. Blow Molding
- 10.2.2. Extrusion
- 10.2.3. Injection Molding
- 10.2.4. Other Technologies
- 10.3. Market Analysis, Insights and Forecast - by Application
- 10.3.1. Packaging
- 10.3.2. Electrical and Electronics
- 10.3.3. Building and Construction
- 10.3.4. Automotive and Transportation
- 10.3.5. Housewares
- 10.3.6. Furniture and Bedding
- 10.3.7. Other Applications
- 10.4. Market Analysis, Insights and Forecast - by Geography
- 10.4.1. Indonesia
- 10.4.2. Thailand
- 10.4.3. Malaysia
- 10.4.4. Singapore
- 10.4.5. Philippines
- 10.4.6. Vietnam
- 10.4.7. Rest of South-East Asia
- 10.1. Market Analysis, Insights and Forecast - by Type
- 11. Philippines Southeast Asia Plastics Industry Analysis, Insights and Forecast, 2020-2032
- 11.1. Market Analysis, Insights and Forecast - by Type
- 11.1.1. Traditional Plastics
- 11.1.2. Engineering Plastics
- 11.1.3. Bioplastics
- 11.2. Market Analysis, Insights and Forecast - by Technology
- 11.2.1. Blow Molding
- 11.2.2. Extrusion
- 11.2.3. Injection Molding
- 11.2.4. Other Technologies
- 11.3. Market Analysis, Insights and Forecast - by Application
- 11.3.1. Packaging
- 11.3.2. Electrical and Electronics
- 11.3.3. Building and Construction
- 11.3.4. Automotive and Transportation
- 11.3.5. Housewares
- 11.3.6. Furniture and Bedding
- 11.3.7. Other Applications
- 11.4. Market Analysis, Insights and Forecast - by Geography
- 11.4.1. Indonesia
- 11.4.2. Thailand
- 11.4.3. Malaysia
- 11.4.4. Singapore
- 11.4.5. Philippines
- 11.4.6. Vietnam
- 11.4.7. Rest of South-East Asia
- 11.1. Market Analysis, Insights and Forecast - by Type
- 12. Vietnam Southeast Asia Plastics Industry Analysis, Insights and Forecast, 2020-2032
- 12.1. Market Analysis, Insights and Forecast - by Type
- 12.1.1. Traditional Plastics
- 12.1.2. Engineering Plastics
- 12.1.3. Bioplastics
- 12.2. Market Analysis, Insights and Forecast - by Technology
- 12.2.1. Blow Molding
- 12.2.2. Extrusion
- 12.2.3. Injection Molding
- 12.2.4. Other Technologies
- 12.3. Market Analysis, Insights and Forecast - by Application
- 12.3.1. Packaging
- 12.3.2. Electrical and Electronics
- 12.3.3. Building and Construction
- 12.3.4. Automotive and Transportation
- 12.3.5. Housewares
- 12.3.6. Furniture and Bedding
- 12.3.7. Other Applications
- 12.4. Market Analysis, Insights and Forecast - by Geography
- 12.4.1. Indonesia
- 12.4.2. Thailand
- 12.4.3. Malaysia
- 12.4.4. Singapore
- 12.4.5. Philippines
- 12.4.6. Vietnam
- 12.4.7. Rest of South-East Asia
- 12.1. Market Analysis, Insights and Forecast - by Type
- 13. Rest of South East Asia Southeast Asia Plastics Industry Analysis, Insights and Forecast, 2020-2032
- 13.1. Market Analysis, Insights and Forecast - by Type
- 13.1.1. Traditional Plastics
- 13.1.2. Engineering Plastics
- 13.1.3. Bioplastics
- 13.2. Market Analysis, Insights and Forecast - by Technology
- 13.2.1. Blow Molding
- 13.2.2. Extrusion
- 13.2.3. Injection Molding
- 13.2.4. Other Technologies
- 13.3. Market Analysis, Insights and Forecast - by Application
- 13.3.1. Packaging
- 13.3.2. Electrical and Electronics
- 13.3.3. Building and Construction
- 13.3.4. Automotive and Transportation
- 13.3.5. Housewares
- 13.3.6. Furniture and Bedding
- 13.3.7. Other Applications
- 13.4. Market Analysis, Insights and Forecast - by Geography
- 13.4.1. Indonesia
- 13.4.2. Thailand
- 13.4.3. Malaysia
- 13.4.4. Singapore
- 13.4.5. Philippines
- 13.4.6. Vietnam
- 13.4.7. Rest of South-East Asia
- 13.1. Market Analysis, Insights and Forecast - by Type
- 14. Competitive Analysis
- 14.1. Company Profiles
- 14.1.1 Plastic Resin Manufacturers
- 14.1.1.1. Company Overview
- 14.1.1.2. Products
- 14.1.1.3. Company Financials
- 14.1.1.4. SWOT Analysis
- 14.1.2 1 AGC Chemicals Vietnam Co Ltd
- 14.1.2.1. Company Overview
- 14.1.2.2. Products
- 14.1.2.3. Company Financials
- 14.1.2.4. SWOT Analysis
- 14.1.3 2 BASF SE
- 14.1.3.1. Company Overview
- 14.1.3.2. Products
- 14.1.3.3. Company Financials
- 14.1.3.4. SWOT Analysis
- 14.1.4 3 Chemrez Technologies Inc
- 14.1.4.1. Company Overview
- 14.1.4.2. Products
- 14.1.4.3. Company Financials
- 14.1.4.4. SWOT Analysis
- 14.1.5 4 Dow
- 14.1.5.1. Company Overview
- 14.1.5.2. Products
- 14.1.5.3. Company Financials
- 14.1.5.4. SWOT Analysis
- 14.1.6 5 DuPont
- 14.1.6.1. Company Overview
- 14.1.6.2. Products
- 14.1.6.3. Company Financials
- 14.1.6.4. SWOT Analysis
- 14.1.7 6 JG summit Petrochemical Corporation
- 14.1.7.1. Company Overview
- 14.1.7.2. Products
- 14.1.7.3. Company Financials
- 14.1.7.4. SWOT Analysis
- 14.1.8 7 LyondellBasell Industries Holdings B V
- 14.1.8.1. Company Overview
- 14.1.8.2. Products
- 14.1.8.3. Company Financials
- 14.1.8.4. SWOT Analysis
- 14.1.9 8 Nan Ya Plastics Corporation (Formosa)
- 14.1.9.1. Company Overview
- 14.1.9.2. Products
- 14.1.9.3. Company Financials
- 14.1.9.4. SWOT Analysis
- 14.1.10 9 NPC Alliance Corporation
- 14.1.10.1. Company Overview
- 14.1.10.2. Products
- 14.1.10.3. Company Financials
- 14.1.10.4. SWOT Analysis
- 14.1.11 10 Petron Corporation
- 14.1.11.1. Company Overview
- 14.1.11.2. Products
- 14.1.11.3. Company Financials
- 14.1.11.4. SWOT Analysis
- 14.1.12 11 Philippine Resins Industries Inc
- 14.1.12.1. Company Overview
- 14.1.12.2. Products
- 14.1.12.3. Company Financials
- 14.1.12.4. SWOT Analysis
- 14.1.13 Plastic Product Manufacturers
- 14.1.13.1. Company Overview
- 14.1.13.2. Products
- 14.1.13.3. Company Financials
- 14.1.13.4. SWOT Analysis
- 14.1.14 1 Ampac Holdings LLC
- 14.1.14.1. Company Overview
- 14.1.14.2. Products
- 14.1.14.3. Company Financials
- 14.1.14.4. SWOT Analysis
- 14.1.15 2 Bavico Ltd
- 14.1.15.1. Company Overview
- 14.1.15.2. Products
- 14.1.15.3. Company Financials
- 14.1.15.4. SWOT Analysis
- 14.1.16 3 Binh Minh Plastic
- 14.1.16.1. Company Overview
- 14.1.16.2. Products
- 14.1.16.3. Company Financials
- 14.1.16.4. SWOT Analysis
- 14.1.17 4 Chan Thuan Thanh Plastic Mechanical & Trading Co Ltd
- 14.1.17.1. Company Overview
- 14.1.17.2. Products
- 14.1.17.3. Company Financials
- 14.1.17.4. SWOT Analysis
- 14.1.18 5 Cholon Plastic Co Ltd
- 14.1.18.1. Company Overview
- 14.1.18.2. Products
- 14.1.18.3. Company Financials
- 14.1.18.4. SWOT Analysis
- 14.1.19 6 City Long (Cambodia) Co Ltd
- 14.1.19.1. Company Overview
- 14.1.19.2. Products
- 14.1.19.3. Company Financials
- 14.1.19.4. SWOT Analysis
- 14.1.20 7 Duy Tan Plastics Corporation*List Not Exhaustive
- 14.1.20.1. Company Overview
- 14.1.20.2. Products
- 14.1.20.3. Company Financials
- 14.1.20.4. SWOT Analysis
- 14.1.1 Plastic Resin Manufacturers
- 14.2. Market Entropy
- 14.2.1 Company's Key Areas Served
- 14.2.2 Recent Developments
- 14.3. Company Market Share Analysis 2025
- 14.3.1 Top 5 Companies Market Share Analysis
- 14.3.2 Top 3 Companies Market Share Analysis
- 14.4. List of Potential Customers
- 15. Research Methodology
List of Figures
- Figure 1: Global Southeast Asia Plastics Industry Revenue Breakdown (million, %) by Region 2025 & 2033
- Figure 2: Indonesia Southeast Asia Plastics Industry Revenue (million), by Type 2025 & 2033
- Figure 3: Indonesia Southeast Asia Plastics Industry Revenue Share (%), by Type 2025 & 2033
- Figure 4: Indonesia Southeast Asia Plastics Industry Revenue (million), by Technology 2025 & 2033
- Figure 5: Indonesia Southeast Asia Plastics Industry Revenue Share (%), by Technology 2025 & 2033
- Figure 6: Indonesia Southeast Asia Plastics Industry Revenue (million), by Application 2025 & 2033
- Figure 7: Indonesia Southeast Asia Plastics Industry Revenue Share (%), by Application 2025 & 2033
- Figure 8: Indonesia Southeast Asia Plastics Industry Revenue (million), by Geography 2025 & 2033
- Figure 9: Indonesia Southeast Asia Plastics Industry Revenue Share (%), by Geography 2025 & 2033
- Figure 10: Indonesia Southeast Asia Plastics Industry Revenue (million), by Country 2025 & 2033
- Figure 11: Indonesia Southeast Asia Plastics Industry Revenue Share (%), by Country 2025 & 2033
- Figure 12: Thailand Southeast Asia Plastics Industry Revenue (million), by Type 2025 & 2033
- Figure 13: Thailand Southeast Asia Plastics Industry Revenue Share (%), by Type 2025 & 2033
- Figure 14: Thailand Southeast Asia Plastics Industry Revenue (million), by Technology 2025 & 2033
- Figure 15: Thailand Southeast Asia Plastics Industry Revenue Share (%), by Technology 2025 & 2033
- Figure 16: Thailand Southeast Asia Plastics Industry Revenue (million), by Application 2025 & 2033
- Figure 17: Thailand Southeast Asia Plastics Industry Revenue Share (%), by Application 2025 & 2033
- Figure 18: Thailand Southeast Asia Plastics Industry Revenue (million), by Geography 2025 & 2033
- Figure 19: Thailand Southeast Asia Plastics Industry Revenue Share (%), by Geography 2025 & 2033
- Figure 20: Thailand Southeast Asia Plastics Industry Revenue (million), by Country 2025 & 2033
- Figure 21: Thailand Southeast Asia Plastics Industry Revenue Share (%), by Country 2025 & 2033
- Figure 22: Malaysia Southeast Asia Plastics Industry Revenue (million), by Type 2025 & 2033
- Figure 23: Malaysia Southeast Asia Plastics Industry Revenue Share (%), by Type 2025 & 2033
- Figure 24: Malaysia Southeast Asia Plastics Industry Revenue (million), by Technology 2025 & 2033
- Figure 25: Malaysia Southeast Asia Plastics Industry Revenue Share (%), by Technology 2025 & 2033
- Figure 26: Malaysia Southeast Asia Plastics Industry Revenue (million), by Application 2025 & 2033
- Figure 27: Malaysia Southeast Asia Plastics Industry Revenue Share (%), by Application 2025 & 2033
- Figure 28: Malaysia Southeast Asia Plastics Industry Revenue (million), by Geography 2025 & 2033
- Figure 29: Malaysia Southeast Asia Plastics Industry Revenue Share (%), by Geography 2025 & 2033
- Figure 30: Malaysia Southeast Asia Plastics Industry Revenue (million), by Country 2025 & 2033
- Figure 31: Malaysia Southeast Asia Plastics Industry Revenue Share (%), by Country 2025 & 2033
- Figure 32: Singapore Southeast Asia Plastics Industry Revenue (million), by Type 2025 & 2033
- Figure 33: Singapore Southeast Asia Plastics Industry Revenue Share (%), by Type 2025 & 2033
- Figure 34: Singapore Southeast Asia Plastics Industry Revenue (million), by Technology 2025 & 2033
- Figure 35: Singapore Southeast Asia Plastics Industry Revenue Share (%), by Technology 2025 & 2033
- Figure 36: Singapore Southeast Asia Plastics Industry Revenue (million), by Application 2025 & 2033
- Figure 37: Singapore Southeast Asia Plastics Industry Revenue Share (%), by Application 2025 & 2033
- Figure 38: Singapore Southeast Asia Plastics Industry Revenue (million), by Geography 2025 & 2033
- Figure 39: Singapore Southeast Asia Plastics Industry Revenue Share (%), by Geography 2025 & 2033
- Figure 40: Singapore Southeast Asia Plastics Industry Revenue (million), by Country 2025 & 2033
- Figure 41: Singapore Southeast Asia Plastics Industry Revenue Share (%), by Country 2025 & 2033
- Figure 42: Philippines Southeast Asia Plastics Industry Revenue (million), by Type 2025 & 2033
- Figure 43: Philippines Southeast Asia Plastics Industry Revenue Share (%), by Type 2025 & 2033
- Figure 44: Philippines Southeast Asia Plastics Industry Revenue (million), by Technology 2025 & 2033
- Figure 45: Philippines Southeast Asia Plastics Industry Revenue Share (%), by Technology 2025 & 2033
- Figure 46: Philippines Southeast Asia Plastics Industry Revenue (million), by Application 2025 & 2033
- Figure 47: Philippines Southeast Asia Plastics Industry Revenue Share (%), by Application 2025 & 2033
- Figure 48: Philippines Southeast Asia Plastics Industry Revenue (million), by Geography 2025 & 2033
- Figure 49: Philippines Southeast Asia Plastics Industry Revenue Share (%), by Geography 2025 & 2033
- Figure 50: Philippines Southeast Asia Plastics Industry Revenue (million), by Country 2025 & 2033
- Figure 51: Philippines Southeast Asia Plastics Industry Revenue Share (%), by Country 2025 & 2033
- Figure 52: Vietnam Southeast Asia Plastics Industry Revenue (million), by Type 2025 & 2033
- Figure 53: Vietnam Southeast Asia Plastics Industry Revenue Share (%), by Type 2025 & 2033
- Figure 54: Vietnam Southeast Asia Plastics Industry Revenue (million), by Technology 2025 & 2033
- Figure 55: Vietnam Southeast Asia Plastics Industry Revenue Share (%), by Technology 2025 & 2033
- Figure 56: Vietnam Southeast Asia Plastics Industry Revenue (million), by Application 2025 & 2033
- Figure 57: Vietnam Southeast Asia Plastics Industry Revenue Share (%), by Application 2025 & 2033
- Figure 58: Vietnam Southeast Asia Plastics Industry Revenue (million), by Geography 2025 & 2033
- Figure 59: Vietnam Southeast Asia Plastics Industry Revenue Share (%), by Geography 2025 & 2033
- Figure 60: Vietnam Southeast Asia Plastics Industry Revenue (million), by Country 2025 & 2033
- Figure 61: Vietnam Southeast Asia Plastics Industry Revenue Share (%), by Country 2025 & 2033
- Figure 62: Rest of South East Asia Southeast Asia Plastics Industry Revenue (million), by Type 2025 & 2033
- Figure 63: Rest of South East Asia Southeast Asia Plastics Industry Revenue Share (%), by Type 2025 & 2033
- Figure 64: Rest of South East Asia Southeast Asia Plastics Industry Revenue (million), by Technology 2025 & 2033
- Figure 65: Rest of South East Asia Southeast Asia Plastics Industry Revenue Share (%), by Technology 2025 & 2033
- Figure 66: Rest of South East Asia Southeast Asia Plastics Industry Revenue (million), by Application 2025 & 2033
- Figure 67: Rest of South East Asia Southeast Asia Plastics Industry Revenue Share (%), by Application 2025 & 2033
- Figure 68: Rest of South East Asia Southeast Asia Plastics Industry Revenue (million), by Geography 2025 & 2033
- Figure 69: Rest of South East Asia Southeast Asia Plastics Industry Revenue Share (%), by Geography 2025 & 2033
- Figure 70: Rest of South East Asia Southeast Asia Plastics Industry Revenue (million), by Country 2025 & 2033
- Figure 71: Rest of South East Asia Southeast Asia Plastics Industry Revenue Share (%), by Country 2025 & 2033
List of Tables
- Table 1: Global Southeast Asia Plastics Industry Revenue million Forecast, by Type 2020 & 2033
- Table 2: Global Southeast Asia Plastics Industry Revenue million Forecast, by Technology 2020 & 2033
- Table 3: Global Southeast Asia Plastics Industry Revenue million Forecast, by Application 2020 & 2033
- Table 4: Global Southeast Asia Plastics Industry Revenue million Forecast, by Geography 2020 & 2033
- Table 5: Global Southeast Asia Plastics Industry Revenue million Forecast, by Region 2020 & 2033
- Table 6: Global Southeast Asia Plastics Industry Revenue million Forecast, by Type 2020 & 2033
- Table 7: Global Southeast Asia Plastics Industry Revenue million Forecast, by Technology 2020 & 2033
- Table 8: Global Southeast Asia Plastics Industry Revenue million Forecast, by Application 2020 & 2033
- Table 9: Global Southeast Asia Plastics Industry Revenue million Forecast, by Geography 2020 & 2033
- Table 10: Global Southeast Asia Plastics Industry Revenue million Forecast, by Country 2020 & 2033
- Table 11: Global Southeast Asia Plastics Industry Revenue million Forecast, by Type 2020 & 2033
- Table 12: Global Southeast Asia Plastics Industry Revenue million Forecast, by Technology 2020 & 2033
- Table 13: Global Southeast Asia Plastics Industry Revenue million Forecast, by Application 2020 & 2033
- Table 14: Global Southeast Asia Plastics Industry Revenue million Forecast, by Geography 2020 & 2033
- Table 15: Global Southeast Asia Plastics Industry Revenue million Forecast, by Country 2020 & 2033
- Table 16: Global Southeast Asia Plastics Industry Revenue million Forecast, by Type 2020 & 2033
- Table 17: Global Southeast Asia Plastics Industry Revenue million Forecast, by Technology 2020 & 2033
- Table 18: Global Southeast Asia Plastics Industry Revenue million Forecast, by Application 2020 & 2033
- Table 19: Global Southeast Asia Plastics Industry Revenue million Forecast, by Geography 2020 & 2033
- Table 20: Global Southeast Asia Plastics Industry Revenue million Forecast, by Country 2020 & 2033
- Table 21: Global Southeast Asia Plastics Industry Revenue million Forecast, by Type 2020 & 2033
- Table 22: Global Southeast Asia Plastics Industry Revenue million Forecast, by Technology 2020 & 2033
- Table 23: Global Southeast Asia Plastics Industry Revenue million Forecast, by Application 2020 & 2033
- Table 24: Global Southeast Asia Plastics Industry Revenue million Forecast, by Geography 2020 & 2033
- Table 25: Global Southeast Asia Plastics Industry Revenue million Forecast, by Country 2020 & 2033
- Table 26: Global Southeast Asia Plastics Industry Revenue million Forecast, by Type 2020 & 2033
- Table 27: Global Southeast Asia Plastics Industry Revenue million Forecast, by Technology 2020 & 2033
- Table 28: Global Southeast Asia Plastics Industry Revenue million Forecast, by Application 2020 & 2033
- Table 29: Global Southeast Asia Plastics Industry Revenue million Forecast, by Geography 2020 & 2033
- Table 30: Global Southeast Asia Plastics Industry Revenue million Forecast, by Country 2020 & 2033
- Table 31: Global Southeast Asia Plastics Industry Revenue million Forecast, by Type 2020 & 2033
- Table 32: Global Southeast Asia Plastics Industry Revenue million Forecast, by Technology 2020 & 2033
- Table 33: Global Southeast Asia Plastics Industry Revenue million Forecast, by Application 2020 & 2033
- Table 34: Global Southeast Asia Plastics Industry Revenue million Forecast, by Geography 2020 & 2033
- Table 35: Global Southeast Asia Plastics Industry Revenue million Forecast, by Country 2020 & 2033
- Table 36: Global Southeast Asia Plastics Industry Revenue million Forecast, by Type 2020 & 2033
- Table 37: Global Southeast Asia Plastics Industry Revenue million Forecast, by Technology 2020 & 2033
- Table 38: Global Southeast Asia Plastics Industry Revenue million Forecast, by Application 2020 & 2033
- Table 39: Global Southeast Asia Plastics Industry Revenue million Forecast, by Geography 2020 & 2033
- Table 40: Global Southeast Asia Plastics Industry Revenue million Forecast, by Country 2020 & 2033
Frequently Asked Questions
1. What is the projected Compound Annual Growth Rate (CAGR) of the Southeast Asia Plastics Industry?
The projected CAGR is approximately 5.15%.
2. Which companies are prominent players in the Southeast Asia Plastics Industry?
Key companies in the market include Plastic Resin Manufacturers, 1 AGC Chemicals Vietnam Co Ltd, 2 BASF SE, 3 Chemrez Technologies Inc, 4 Dow, 5 DuPont, 6 JG summit Petrochemical Corporation, 7 LyondellBasell Industries Holdings B V, 8 Nan Ya Plastics Corporation (Formosa), 9 NPC Alliance Corporation, 10 Petron Corporation, 11 Philippine Resins Industries Inc, Plastic Product Manufacturers, 1 Ampac Holdings LLC, 2 Bavico Ltd, 3 Binh Minh Plastic, 4 Chan Thuan Thanh Plastic Mechanical & Trading Co Ltd, 5 Cholon Plastic Co Ltd, 6 City Long (Cambodia) Co Ltd, 7 Duy Tan Plastics Corporation*List Not Exhaustive.
3. What are the main segments of the Southeast Asia Plastics Industry?
The market segments include Type, Technology, Application, Geography.
4. Can you provide details about the market size?
The market size is estimated to be USD 12452.7 million as of 2022.
5. What are some drivers contributing to market growth?
Rising Demand from Food and Beverage Packaging; Rapid Increase in the Downstream Processing Capacity Additions; Other Drivers.
6. What are the notable trends driving market growth?
Injection Molding Technology to Dominate the Market.
7. Are there any restraints impacting market growth?
Rising Demand from Food and Beverage Packaging; Rapid Increase in the Downstream Processing Capacity Additions; Other Drivers.
8. Can you provide examples of recent developments in the market?
The recent developments pertaining to the major players in the market are being covered in the complete study.
9. What pricing options are available for accessing the report?
Pricing options include single-user, multi-user, and enterprise licenses priced at USD 4750, USD 5250, and USD 8750 respectively.
10. Is the market size provided in terms of value or volume?
The market size is provided in terms of value, measured in million.
11. Are there any specific market keywords associated with the report?
Yes, the market keyword associated with the report is "Southeast Asia Plastics Industry," which aids in identifying and referencing the specific market segment covered.
12. How do I determine which pricing option suits my needs best?
The pricing options vary based on user requirements and access needs. Individual users may opt for single-user licenses, while businesses requiring broader access may choose multi-user or enterprise licenses for cost-effective access to the report.
13. Are there any additional resources or data provided in the Southeast Asia Plastics Industry report?
While the report offers comprehensive insights, it's advisable to review the specific contents or supplementary materials provided to ascertain if additional resources or data are available.
14. How can I stay updated on further developments or reports in the Southeast Asia Plastics Industry?
To stay informed about further developments, trends, and reports in the Southeast Asia Plastics Industry, consider subscribing to industry newsletters, following relevant companies and organizations, or regularly checking reputable industry news sources and publications.
Methodology
Step 1 - Identification of Relevant Samples Size from Population Database


Step 2 - Approaches for Defining Global Market Size (Value, Volume* & Price*)

Note*: In applicable scenarios
Step 3 - Data Sources
Primary Research
- Web Analytics
- Survey Reports
- Research Institute
- Latest Research Reports
- Opinion Leaders
Secondary Research
- Annual Reports
- White Paper
- Latest Press Release
- Industry Association
- Paid Database
- Investor Presentations

Step 4 - Data Triangulation
Involves using different sources of information in order to increase the validity of a study
These sources are likely to be stakeholders in a program - participants, other researchers, program staff, other community members, and so on.
Then we put all data in single framework & apply various statistical tools to find out the dynamic on the market.
During the analysis stage, feedback from the stakeholder groups would be compared to determine areas of agreement as well as areas of divergence