

Key Insights
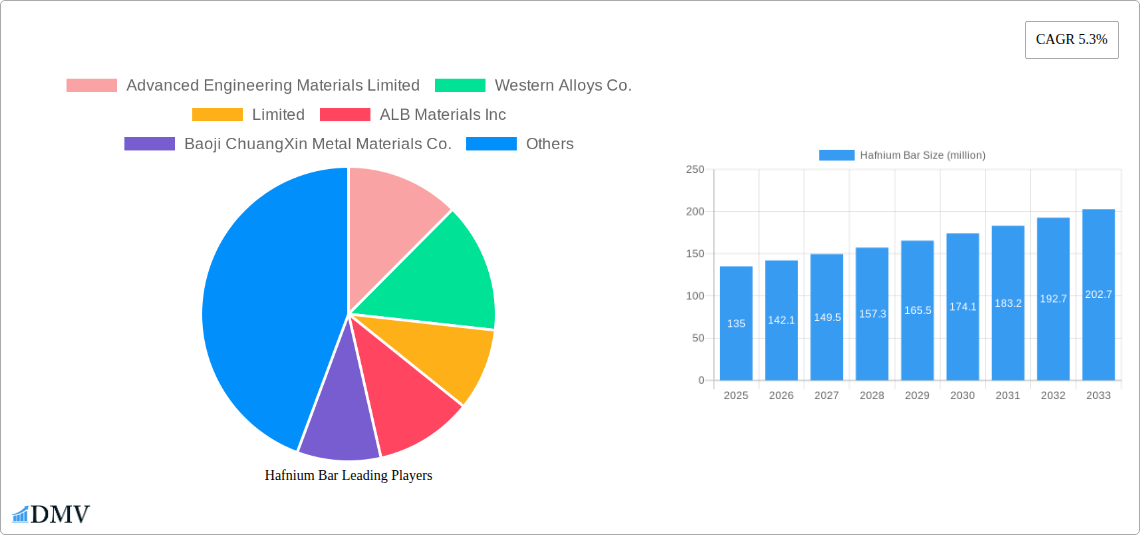
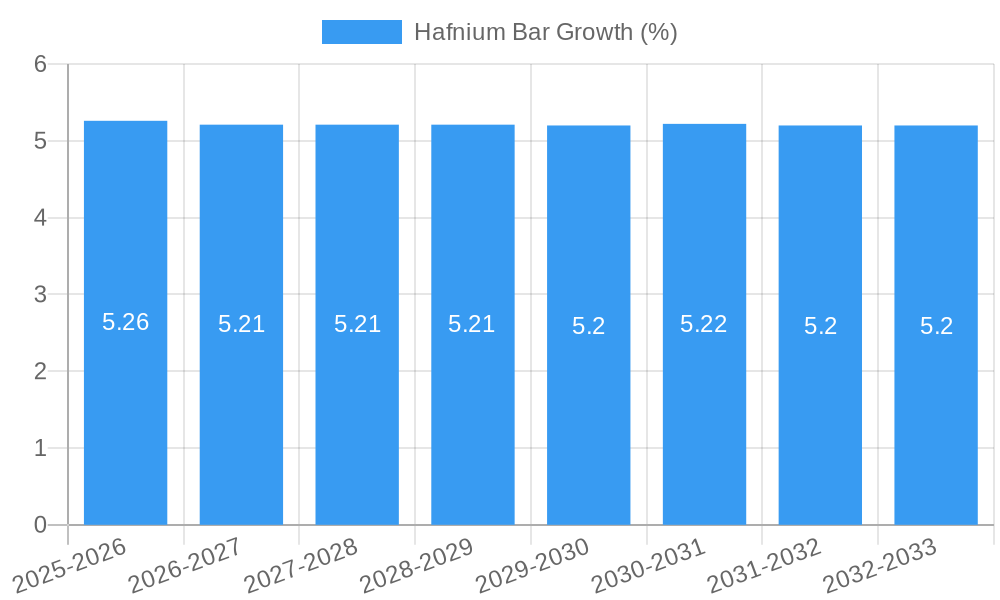
The global Hafnium Bar market is poised for robust growth, projected to reach a substantial market size of USD 135 million by 2025, with an estimated Compound Annual Growth Rate (CAGR) of 5.3% expected to continue through 2033. This expansion is primarily fueled by the increasing demand from the nuclear industry, where hafnium's exceptional neutron absorption properties make it indispensable for control rods and shielding. Furthermore, the burgeoning electronics industry, particularly in the development of advanced semiconductors and high-performance components, is a significant growth driver. Emerging applications in aerospace and medical devices are also contributing to market dynamics, showcasing the versatility and critical nature of hafnium bars. The market is characterized by a clear segmentation based on purity levels, with a strong emphasis on high-purity grades (97%-99% and >99%) due to their stringent application requirements.
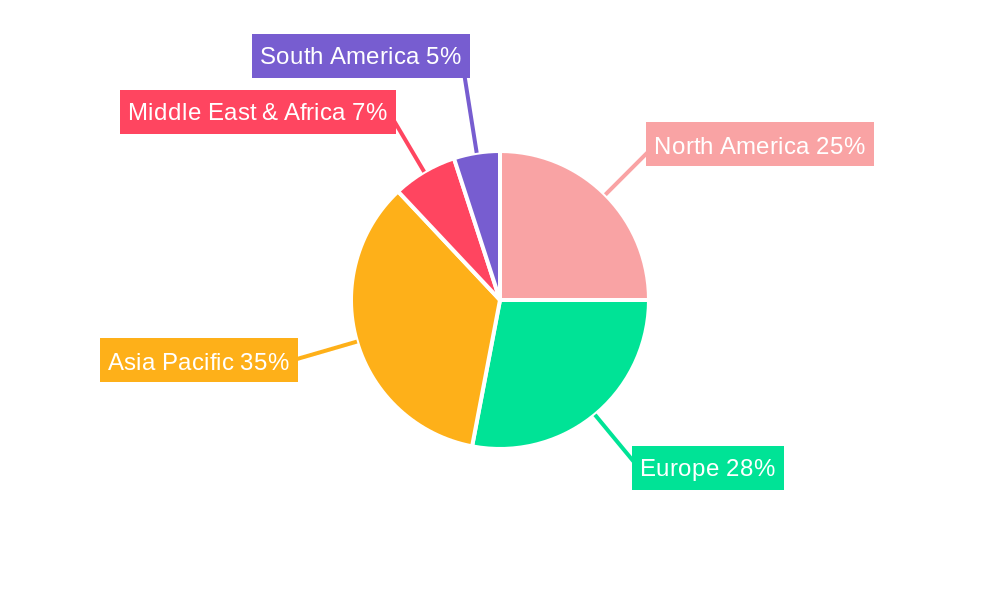
The market's trajectory is further shaped by several key trends, including advancements in hafnium extraction and refining technologies, leading to improved quality and cost-effectiveness. Increased investment in research and development for novel hafnium alloys and their applications is also a prominent trend. However, certain restraints, such as the relatively high cost of raw materials and complex processing requirements, could temper the growth rate to some extent. Geographically, the Asia Pacific region, led by China and Japan, is anticipated to emerge as a dominant market due to its substantial industrial base and increasing technological adoption. North America and Europe also represent significant markets, driven by their established nuclear and advanced manufacturing sectors. Key players like Advanced Engineering Materials Limited, Western Alloys Co., Limited, and American Elements are actively engaged in expanding their production capabilities and product portfolios to cater to this growing global demand.
Hafnium Bar Market Analysis: Unlocking Growth Opportunities (2019–2033)
This comprehensive Hafnium Bar market report delves into the intricate dynamics of this high-value specialty metal, providing critical insights for stakeholders across the Nuclear Industry, Electronics Industry, and Others. Covering a study period from 2019 to 2033, with a base and estimated year of 2025, this report offers a detailed examination of historical trends, current market conditions, and robust future forecasts. Discover the pivotal role of hafnium bars in advanced manufacturing, strategic defense, and cutting-edge technology.
Hafnium Bar Market Composition & Trends
The hafnium bar market exhibits a moderate concentration, driven by specialized production processes and stringent quality requirements. Innovation catalysts include advancements in nuclear reactor technology and the increasing demand for high-performance electronic components. The regulatory landscape, particularly concerning nuclear materials and export controls, plays a significant role in shaping market access and growth. Substitute products, such as other refractory metals, are present but often fall short in meeting the unique properties of hafnium in critical applications. End-user profiles span government defense agencies, nuclear power plant operators, and advanced semiconductor manufacturers. Mergers and acquisitions (M&A) activities, while less frequent than in broader metal markets, are strategic, focusing on consolidating expertise and securing supply chains.
- Market Share Distribution: Leading players hold significant but fragmented market shares, indicating potential for consolidation and strategic partnerships.
- M&A Deal Values: While specific deal values are proprietary, strategic acquisitions in recent years have ranged from tens to hundreds of million.
- Innovation Focus: Research and development efforts are concentrated on improving hafnium purity, enhancing fabrication techniques, and exploring new alloy compositions.
- Regulatory Impact: Compliance with international treaties and national security regulations is paramount for market participation.
Hafnium Bar Industry Evolution
The hafnium bar industry has witnessed steady evolution, marked by sustained demand from its core applications and emerging technological frontiers. From 2019 to 2024, the historical period demonstrates a consistent upward trajectory, driven by global investments in nuclear energy infrastructure and the continuous miniaturization and enhancement of electronic devices. The base year of 2025 positions the market at a critical juncture, poised for accelerated growth fueled by technological breakthroughs and evolving geopolitical landscapes. Market growth trajectories are intrinsically linked to the lifecycle of nuclear power plants, including new construction, maintenance, and decommissioning, as well as the relentless pursuit of faster and more efficient semiconductor technologies. Technological advancements in hafnium refining and processing have enabled the production of higher purity grades, crucial for sensitive applications. Shifting consumer demands, while not directly driving the hafnium bar market, influence the downstream industries (electronics) that consume it, indirectly shaping production volumes and specifications. Adoption metrics for new hafnium-based alloys in specialized applications are showing promising growth rates, indicating a proactive industry. The forecast period of 2025–2033 is expected to see robust expansion, with an estimated compound annual growth rate (CAGR) of xx% to xx%, as new applications in aerospace and advanced research gain traction. The industry's ability to adapt to evolving material science challenges and maintain a stable supply chain will be key to capitalizing on this predicted growth.
Leading Regions, Countries, or Segments in Hafnium Bar
The Nuclear Industry segment, particularly for hafnium bars with purity levels >99%, stands as the dominant force within the global hafnium bar market. This dominance is most pronounced in regions with established nuclear energy programs and advanced defense sectors.
- Dominant Region: North America and Europe currently lead in hafnium bar consumption for nuclear applications, owing to their extensive nuclear power plant infrastructure and significant investment in research and development of advanced nuclear technologies.
- Key Drivers in the Nuclear Industry:
- Stringent Purity Requirements: The critical nature of nuclear control rods and fuel cladding necessitates the highest purity hafnium (>99%), driving demand for specialized producers.
- Long-term Nuclear Power Investments: Continued investment in extending the lifespan of existing nuclear power plants and the development of new reactor designs ensure a sustained demand for hafnium components.
- Defense Applications: Hafnium's neutron absorption properties make it indispensable for control mechanisms in naval reactors and other defense-related nuclear applications.
- Regulatory Support: Government policies and international agreements promoting nuclear safety and energy independence indirectly bolster the demand for hafnium.
- Dominant Purity Segment: The >99% purity segment is the largest and most lucrative, directly correlating with the critical requirements of the nuclear sector. While the 97%-99% purity grades find application in some specialized nuclear components and advanced electronics, the demand for ultra-high purity hafnium remains paramount.
- Emerging Trends in Electronics: The Electronics Industry, while a smaller consumer currently, is a significant growth area, especially for hafnium with purities 97%-99%. As semiconductor technology advances, hafnium's dielectric properties are being increasingly explored for next-generation microprocessors and memory devices, promising substantial future demand.
Hafnium Bar Product Innovations
Product innovations in the hafnium bar market are primarily focused on enhancing material purity and developing advanced alloy compositions for specialized applications. Manufacturers are investing in improved refining techniques to achieve hafnium purities exceeding 99.9%, a critical requirement for next-generation nuclear reactors and advanced semiconductor manufacturing. New alloy formulations are being explored to improve mechanical strength, corrosion resistance, and high-temperature performance, expanding their utility in aerospace and demanding industrial environments. Performance metrics are continuously being optimized for neutron absorption efficiency in nuclear applications and dielectric constant in electronic components. Unique selling propositions include ultra-high purity grades, tailored alloy compositions, and specialized bar dimensions that cater to niche market demands.
Propelling Factors for Hafnium Bar Growth
The hafnium bar market's growth is propelled by several key factors. Technologically, the expansion of the nuclear power industry, driven by the global push for low-carbon energy solutions, is a primary driver. Advancements in nuclear reactor designs that leverage hafnium's unique neutron absorption properties further stimulate demand. Economically, increasing investments in high-performance electronics, particularly in areas like advanced semiconductors and specialized sensors, are opening new avenues for hafnium utilization. Regulatory influences, such as government support for nuclear energy programs and favorable trade policies for critical materials, also play a crucial role in fostering market expansion.
Obstacles in the Hafnium Bar Market
Despite its promising growth, the hafnium bar market faces significant obstacles. Regulatory challenges, including stringent export controls and the complex licensing processes associated with nuclear materials, can impede market access and increase operational costs. Supply chain disruptions, particularly concerning the availability of raw hafnium ore and the specialized manufacturing capabilities, pose a constant threat. Competitive pressures from alternative materials in certain applications, though limited, require continuous innovation to maintain market share. The high cost of production and the niche nature of its primary applications also contribute to market fragmentation and potential price volatility.
Future Opportunities in Hafnium Bar
Emerging opportunities in the hafnium bar market are diverse and promising. The development of advanced reactor designs, including small modular reactors (SMRs) and fusion power, presents a significant long-term growth prospect. In the electronics sector, the exploration of hafnium-based gate dielectrics for advanced microchips and memory devices offers substantial untapped potential. Furthermore, new applications in aerospace, such as high-temperature components and specialized coatings, are expected to emerge. The growing demand for advanced materials in scientific research and industrial processes also presents niche opportunities for specialized hafnium products.
Major Players in the Hafnium Bar Ecosystem
- Advanced Engineering Materials Limited
- Western Alloys Co., Limited
- ALB Materials Inc
- Baoji ChuangXin Metal Materials Co.,Ltd
- American Elements
- TNTI
- Smart-elements GmbH
- Eagle Alloys Corporation
- U.S. Titanium Industry Inc.
Key Developments in Hafnium Bar Industry
- 2023: Introduction of advanced hafnium alloys with enhanced high-temperature resistance for aerospace applications.
- 2022: Significant R&D investment by leading manufacturers to achieve hafnium purity levels exceeding 99.95% for next-generation semiconductor technologies.
- 2021: Increased demand for hafnium control rods due to extended operational licenses for several nuclear power plants globally.
- 2020: Focus on optimizing hafnium refining processes to reduce production costs and improve supply chain efficiency.
- 2019: Exploration of novel hafnium-based materials for potential use in advanced battery technologies.
Strategic Hafnium Bar Market Forecast
The strategic hafnium bar market forecast anticipates sustained growth driven by the indispensable role of hafnium in the nuclear industry and its expanding applications in electronics. Future opportunities in advanced reactor technologies and next-generation semiconductor manufacturing are expected to be significant catalysts. The market's resilience will be shaped by ongoing technological innovation, the ability to navigate complex regulatory environments, and the development of robust, diversified supply chains. With a projected CAGR of xx% to xx% between 2025 and 2033, the hafnium bar market offers substantial potential for stakeholders who can align with these evolving demands and leverage its unique material properties.
Hafnium Bar Segmentation
-
1. Application
- 1.1. Nuclear Industry
- 1.2. Electronics Industry
- 1.3. Others
-
2. Types
- 2.1. Purity:<97%
- 2.2. Purity:97%-99%
- 2.3. Purity:>99%
Hafnium Bar Segmentation By Geography
-
1. North America
- 1.1. United States
- 1.2. Canada
- 1.3. Mexico
-
2. South America
- 2.1. Brazil
- 2.2. Argentina
- 2.3. Rest of South America
-
3. Europe
- 3.1. United Kingdom
- 3.2. Germany
- 3.3. France
- 3.4. Italy
- 3.5. Spain
- 3.6. Russia
- 3.7. Benelux
- 3.8. Nordics
- 3.9. Rest of Europe
-
4. Middle East & Africa
- 4.1. Turkey
- 4.2. Israel
- 4.3. GCC
- 4.4. North Africa
- 4.5. South Africa
- 4.6. Rest of Middle East & Africa
-
5. Asia Pacific
- 5.1. China
- 5.2. India
- 5.3. Japan
- 5.4. South Korea
- 5.5. ASEAN
- 5.6. Oceania
- 5.7. Rest of Asia Pacific
Hafnium Bar REPORT HIGHLIGHTS
| Aspects | Details |
|---|---|
| Study Period | 2019-2033 |
| Base Year | 2024 |
| Estimated Year | 2025 |
| Forecast Period | 2025-2033 |
| Historical Period | 2019-2024 |
| Growth Rate | CAGR of 5.3% from 2019-2033 |
| Segmentation |
|
Table of Contents
- 1. Introduction
- 1.1. Research Scope
- 1.2. Market Segmentation
- 1.3. Research Methodology
- 1.4. Definitions and Assumptions
- 2. Executive Summary
- 2.1. Introduction
- 3. Market Dynamics
- 3.1. Introduction
- 3.2. Market Drivers
- 3.3. Market Restrains
- 3.4. Market Trends
- 4. Market Factor Analysis
- 4.1. Porters Five Forces
- 4.2. Supply/Value Chain
- 4.3. PESTEL analysis
- 4.4. Market Entropy
- 4.5. Patent/Trademark Analysis
- 5. Global Hafnium Bar Analysis, Insights and Forecast, 2019-2031
- 5.1. Market Analysis, Insights and Forecast - by Application
- 5.1.1. Nuclear Industry
- 5.1.2. Electronics Industry
- 5.1.3. Others
- 5.2. Market Analysis, Insights and Forecast - by Types
- 5.2.1. Purity:<97%
- 5.2.2. Purity:97%-99%
- 5.2.3. Purity:>99%
- 5.3. Market Analysis, Insights and Forecast - by Region
- 5.3.1. North America
- 5.3.2. South America
- 5.3.3. Europe
- 5.3.4. Middle East & Africa
- 5.3.5. Asia Pacific
- 5.1. Market Analysis, Insights and Forecast - by Application
- 6. North America Hafnium Bar Analysis, Insights and Forecast, 2019-2031
- 6.1. Market Analysis, Insights and Forecast - by Application
- 6.1.1. Nuclear Industry
- 6.1.2. Electronics Industry
- 6.1.3. Others
- 6.2. Market Analysis, Insights and Forecast - by Types
- 6.2.1. Purity:<97%
- 6.2.2. Purity:97%-99%
- 6.2.3. Purity:>99%
- 6.1. Market Analysis, Insights and Forecast - by Application
- 7. South America Hafnium Bar Analysis, Insights and Forecast, 2019-2031
- 7.1. Market Analysis, Insights and Forecast - by Application
- 7.1.1. Nuclear Industry
- 7.1.2. Electronics Industry
- 7.1.3. Others
- 7.2. Market Analysis, Insights and Forecast - by Types
- 7.2.1. Purity:<97%
- 7.2.2. Purity:97%-99%
- 7.2.3. Purity:>99%
- 7.1. Market Analysis, Insights and Forecast - by Application
- 8. Europe Hafnium Bar Analysis, Insights and Forecast, 2019-2031
- 8.1. Market Analysis, Insights and Forecast - by Application
- 8.1.1. Nuclear Industry
- 8.1.2. Electronics Industry
- 8.1.3. Others
- 8.2. Market Analysis, Insights and Forecast - by Types
- 8.2.1. Purity:<97%
- 8.2.2. Purity:97%-99%
- 8.2.3. Purity:>99%
- 8.1. Market Analysis, Insights and Forecast - by Application
- 9. Middle East & Africa Hafnium Bar Analysis, Insights and Forecast, 2019-2031
- 9.1. Market Analysis, Insights and Forecast - by Application
- 9.1.1. Nuclear Industry
- 9.1.2. Electronics Industry
- 9.1.3. Others
- 9.2. Market Analysis, Insights and Forecast - by Types
- 9.2.1. Purity:<97%
- 9.2.2. Purity:97%-99%
- 9.2.3. Purity:>99%
- 9.1. Market Analysis, Insights and Forecast - by Application
- 10. Asia Pacific Hafnium Bar Analysis, Insights and Forecast, 2019-2031
- 10.1. Market Analysis, Insights and Forecast - by Application
- 10.1.1. Nuclear Industry
- 10.1.2. Electronics Industry
- 10.1.3. Others
- 10.2. Market Analysis, Insights and Forecast - by Types
- 10.2.1. Purity:<97%
- 10.2.2. Purity:97%-99%
- 10.2.3. Purity:>99%
- 10.1. Market Analysis, Insights and Forecast - by Application
- 11. Competitive Analysis
- 11.1. Global Market Share Analysis 2024
- 11.2. Company Profiles
- 11.2.1 Advanced Engineering Materials Limited
- 11.2.1.1. Overview
- 11.2.1.2. Products
- 11.2.1.3. SWOT Analysis
- 11.2.1.4. Recent Developments
- 11.2.1.5. Financials (Based on Availability)
- 11.2.2 Western Alloys Co.
- 11.2.2.1. Overview
- 11.2.2.2. Products
- 11.2.2.3. SWOT Analysis
- 11.2.2.4. Recent Developments
- 11.2.2.5. Financials (Based on Availability)
- 11.2.3 Limited
- 11.2.3.1. Overview
- 11.2.3.2. Products
- 11.2.3.3. SWOT Analysis
- 11.2.3.4. Recent Developments
- 11.2.3.5. Financials (Based on Availability)
- 11.2.4 ALB Materials Inc
- 11.2.4.1. Overview
- 11.2.4.2. Products
- 11.2.4.3. SWOT Analysis
- 11.2.4.4. Recent Developments
- 11.2.4.5. Financials (Based on Availability)
- 11.2.5 Baoji ChuangXin Metal Materials Co.
- 11.2.5.1. Overview
- 11.2.5.2. Products
- 11.2.5.3. SWOT Analysis
- 11.2.5.4. Recent Developments
- 11.2.5.5. Financials (Based on Availability)
- 11.2.6 Ltd
- 11.2.6.1. Overview
- 11.2.6.2. Products
- 11.2.6.3. SWOT Analysis
- 11.2.6.4. Recent Developments
- 11.2.6.5. Financials (Based on Availability)
- 11.2.7 American Elements
- 11.2.7.1. Overview
- 11.2.7.2. Products
- 11.2.7.3. SWOT Analysis
- 11.2.7.4. Recent Developments
- 11.2.7.5. Financials (Based on Availability)
- 11.2.8 TNTI
- 11.2.8.1. Overview
- 11.2.8.2. Products
- 11.2.8.3. SWOT Analysis
- 11.2.8.4. Recent Developments
- 11.2.8.5. Financials (Based on Availability)
- 11.2.9 Smart-elements GmbH
- 11.2.9.1. Overview
- 11.2.9.2. Products
- 11.2.9.3. SWOT Analysis
- 11.2.9.4. Recent Developments
- 11.2.9.5. Financials (Based on Availability)
- 11.2.10 Eagle Alloys Corporation
- 11.2.10.1. Overview
- 11.2.10.2. Products
- 11.2.10.3. SWOT Analysis
- 11.2.10.4. Recent Developments
- 11.2.10.5. Financials (Based on Availability)
- 11.2.11 U.S. Titanium Industry Inc.
- 11.2.11.1. Overview
- 11.2.11.2. Products
- 11.2.11.3. SWOT Analysis
- 11.2.11.4. Recent Developments
- 11.2.11.5. Financials (Based on Availability)
- 11.2.1 Advanced Engineering Materials Limited
List of Figures
- Figure 1: Global Hafnium Bar Revenue Breakdown (million, %) by Region 2024 & 2032
- Figure 2: North America Hafnium Bar Revenue (million), by Application 2024 & 2032
- Figure 3: North America Hafnium Bar Revenue Share (%), by Application 2024 & 2032
- Figure 4: North America Hafnium Bar Revenue (million), by Types 2024 & 2032
- Figure 5: North America Hafnium Bar Revenue Share (%), by Types 2024 & 2032
- Figure 6: North America Hafnium Bar Revenue (million), by Country 2024 & 2032
- Figure 7: North America Hafnium Bar Revenue Share (%), by Country 2024 & 2032
- Figure 8: South America Hafnium Bar Revenue (million), by Application 2024 & 2032
- Figure 9: South America Hafnium Bar Revenue Share (%), by Application 2024 & 2032
- Figure 10: South America Hafnium Bar Revenue (million), by Types 2024 & 2032
- Figure 11: South America Hafnium Bar Revenue Share (%), by Types 2024 & 2032
- Figure 12: South America Hafnium Bar Revenue (million), by Country 2024 & 2032
- Figure 13: South America Hafnium Bar Revenue Share (%), by Country 2024 & 2032
- Figure 14: Europe Hafnium Bar Revenue (million), by Application 2024 & 2032
- Figure 15: Europe Hafnium Bar Revenue Share (%), by Application 2024 & 2032
- Figure 16: Europe Hafnium Bar Revenue (million), by Types 2024 & 2032
- Figure 17: Europe Hafnium Bar Revenue Share (%), by Types 2024 & 2032
- Figure 18: Europe Hafnium Bar Revenue (million), by Country 2024 & 2032
- Figure 19: Europe Hafnium Bar Revenue Share (%), by Country 2024 & 2032
- Figure 20: Middle East & Africa Hafnium Bar Revenue (million), by Application 2024 & 2032
- Figure 21: Middle East & Africa Hafnium Bar Revenue Share (%), by Application 2024 & 2032
- Figure 22: Middle East & Africa Hafnium Bar Revenue (million), by Types 2024 & 2032
- Figure 23: Middle East & Africa Hafnium Bar Revenue Share (%), by Types 2024 & 2032
- Figure 24: Middle East & Africa Hafnium Bar Revenue (million), by Country 2024 & 2032
- Figure 25: Middle East & Africa Hafnium Bar Revenue Share (%), by Country 2024 & 2032
- Figure 26: Asia Pacific Hafnium Bar Revenue (million), by Application 2024 & 2032
- Figure 27: Asia Pacific Hafnium Bar Revenue Share (%), by Application 2024 & 2032
- Figure 28: Asia Pacific Hafnium Bar Revenue (million), by Types 2024 & 2032
- Figure 29: Asia Pacific Hafnium Bar Revenue Share (%), by Types 2024 & 2032
- Figure 30: Asia Pacific Hafnium Bar Revenue (million), by Country 2024 & 2032
- Figure 31: Asia Pacific Hafnium Bar Revenue Share (%), by Country 2024 & 2032
List of Tables
- Table 1: Global Hafnium Bar Revenue million Forecast, by Region 2019 & 2032
- Table 2: Global Hafnium Bar Revenue million Forecast, by Application 2019 & 2032
- Table 3: Global Hafnium Bar Revenue million Forecast, by Types 2019 & 2032
- Table 4: Global Hafnium Bar Revenue million Forecast, by Region 2019 & 2032
- Table 5: Global Hafnium Bar Revenue million Forecast, by Application 2019 & 2032
- Table 6: Global Hafnium Bar Revenue million Forecast, by Types 2019 & 2032
- Table 7: Global Hafnium Bar Revenue million Forecast, by Country 2019 & 2032
- Table 8: United States Hafnium Bar Revenue (million) Forecast, by Application 2019 & 2032
- Table 9: Canada Hafnium Bar Revenue (million) Forecast, by Application 2019 & 2032
- Table 10: Mexico Hafnium Bar Revenue (million) Forecast, by Application 2019 & 2032
- Table 11: Global Hafnium Bar Revenue million Forecast, by Application 2019 & 2032
- Table 12: Global Hafnium Bar Revenue million Forecast, by Types 2019 & 2032
- Table 13: Global Hafnium Bar Revenue million Forecast, by Country 2019 & 2032
- Table 14: Brazil Hafnium Bar Revenue (million) Forecast, by Application 2019 & 2032
- Table 15: Argentina Hafnium Bar Revenue (million) Forecast, by Application 2019 & 2032
- Table 16: Rest of South America Hafnium Bar Revenue (million) Forecast, by Application 2019 & 2032
- Table 17: Global Hafnium Bar Revenue million Forecast, by Application 2019 & 2032
- Table 18: Global Hafnium Bar Revenue million Forecast, by Types 2019 & 2032
- Table 19: Global Hafnium Bar Revenue million Forecast, by Country 2019 & 2032
- Table 20: United Kingdom Hafnium Bar Revenue (million) Forecast, by Application 2019 & 2032
- Table 21: Germany Hafnium Bar Revenue (million) Forecast, by Application 2019 & 2032
- Table 22: France Hafnium Bar Revenue (million) Forecast, by Application 2019 & 2032
- Table 23: Italy Hafnium Bar Revenue (million) Forecast, by Application 2019 & 2032
- Table 24: Spain Hafnium Bar Revenue (million) Forecast, by Application 2019 & 2032
- Table 25: Russia Hafnium Bar Revenue (million) Forecast, by Application 2019 & 2032
- Table 26: Benelux Hafnium Bar Revenue (million) Forecast, by Application 2019 & 2032
- Table 27: Nordics Hafnium Bar Revenue (million) Forecast, by Application 2019 & 2032
- Table 28: Rest of Europe Hafnium Bar Revenue (million) Forecast, by Application 2019 & 2032
- Table 29: Global Hafnium Bar Revenue million Forecast, by Application 2019 & 2032
- Table 30: Global Hafnium Bar Revenue million Forecast, by Types 2019 & 2032
- Table 31: Global Hafnium Bar Revenue million Forecast, by Country 2019 & 2032
- Table 32: Turkey Hafnium Bar Revenue (million) Forecast, by Application 2019 & 2032
- Table 33: Israel Hafnium Bar Revenue (million) Forecast, by Application 2019 & 2032
- Table 34: GCC Hafnium Bar Revenue (million) Forecast, by Application 2019 & 2032
- Table 35: North Africa Hafnium Bar Revenue (million) Forecast, by Application 2019 & 2032
- Table 36: South Africa Hafnium Bar Revenue (million) Forecast, by Application 2019 & 2032
- Table 37: Rest of Middle East & Africa Hafnium Bar Revenue (million) Forecast, by Application 2019 & 2032
- Table 38: Global Hafnium Bar Revenue million Forecast, by Application 2019 & 2032
- Table 39: Global Hafnium Bar Revenue million Forecast, by Types 2019 & 2032
- Table 40: Global Hafnium Bar Revenue million Forecast, by Country 2019 & 2032
- Table 41: China Hafnium Bar Revenue (million) Forecast, by Application 2019 & 2032
- Table 42: India Hafnium Bar Revenue (million) Forecast, by Application 2019 & 2032
- Table 43: Japan Hafnium Bar Revenue (million) Forecast, by Application 2019 & 2032
- Table 44: South Korea Hafnium Bar Revenue (million) Forecast, by Application 2019 & 2032
- Table 45: ASEAN Hafnium Bar Revenue (million) Forecast, by Application 2019 & 2032
- Table 46: Oceania Hafnium Bar Revenue (million) Forecast, by Application 2019 & 2032
- Table 47: Rest of Asia Pacific Hafnium Bar Revenue (million) Forecast, by Application 2019 & 2032
Frequently Asked Questions
1. What is the projected Compound Annual Growth Rate (CAGR) of the Hafnium Bar?
The projected CAGR is approximately 5.3%.
2. Which companies are prominent players in the Hafnium Bar?
Key companies in the market include Advanced Engineering Materials Limited, Western Alloys Co., Limited, ALB Materials Inc, Baoji ChuangXin Metal Materials Co., Ltd, American Elements, TNTI, Smart-elements GmbH, Eagle Alloys Corporation, U.S. Titanium Industry Inc..
3. What are the main segments of the Hafnium Bar?
The market segments include Application, Types.
4. Can you provide details about the market size?
The market size is estimated to be USD 135 million as of 2022.
5. What are some drivers contributing to market growth?
N/A
6. What are the notable trends driving market growth?
N/A
7. Are there any restraints impacting market growth?
N/A
8. Can you provide examples of recent developments in the market?
N/A
9. What pricing options are available for accessing the report?
Pricing options include single-user, multi-user, and enterprise licenses priced at USD 4900.00, USD 7350.00, and USD 9800.00 respectively.
10. Is the market size provided in terms of value or volume?
The market size is provided in terms of value, measured in million.
11. Are there any specific market keywords associated with the report?
Yes, the market keyword associated with the report is "Hafnium Bar," which aids in identifying and referencing the specific market segment covered.
12. How do I determine which pricing option suits my needs best?
The pricing options vary based on user requirements and access needs. Individual users may opt for single-user licenses, while businesses requiring broader access may choose multi-user or enterprise licenses for cost-effective access to the report.
13. Are there any additional resources or data provided in the Hafnium Bar report?
While the report offers comprehensive insights, it's advisable to review the specific contents or supplementary materials provided to ascertain if additional resources or data are available.
14. How can I stay updated on further developments or reports in the Hafnium Bar?
To stay informed about further developments, trends, and reports in the Hafnium Bar, consider subscribing to industry newsletters, following relevant companies and organizations, or regularly checking reputable industry news sources and publications.
Methodology
Step 1 - Identification of Relevant Samples Size from Population Database


Step 2 - Approaches for Defining Global Market Size (Value, Volume* & Price*)

Note*: In applicable scenarios
Step 3 - Data Sources
Primary Research
- Web Analytics
- Survey Reports
- Research Institute
- Latest Research Reports
- Opinion Leaders
Secondary Research
- Annual Reports
- White Paper
- Latest Press Release
- Industry Association
- Paid Database
- Investor Presentations

Step 4 - Data Triangulation
Involves using different sources of information in order to increase the validity of a study
These sources are likely to be stakeholders in a program - participants, other researchers, program staff, other community members, and so on.
Then we put all data in single framework & apply various statistical tools to find out the dynamic on the market.
During the analysis stage, feedback from the stakeholder groups would be compared to determine areas of agreement as well as areas of divergence
