

Key Insights
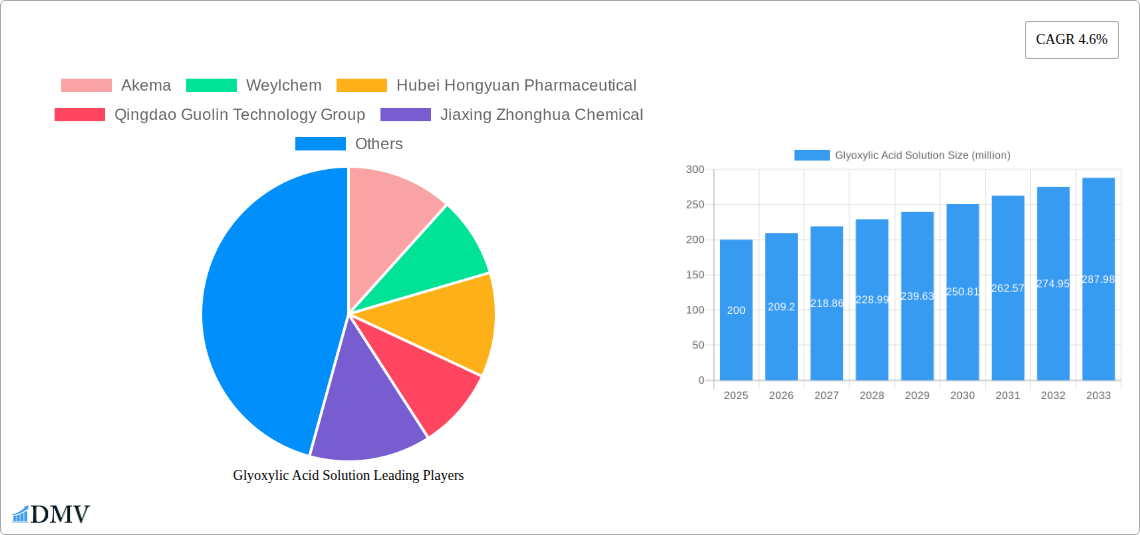
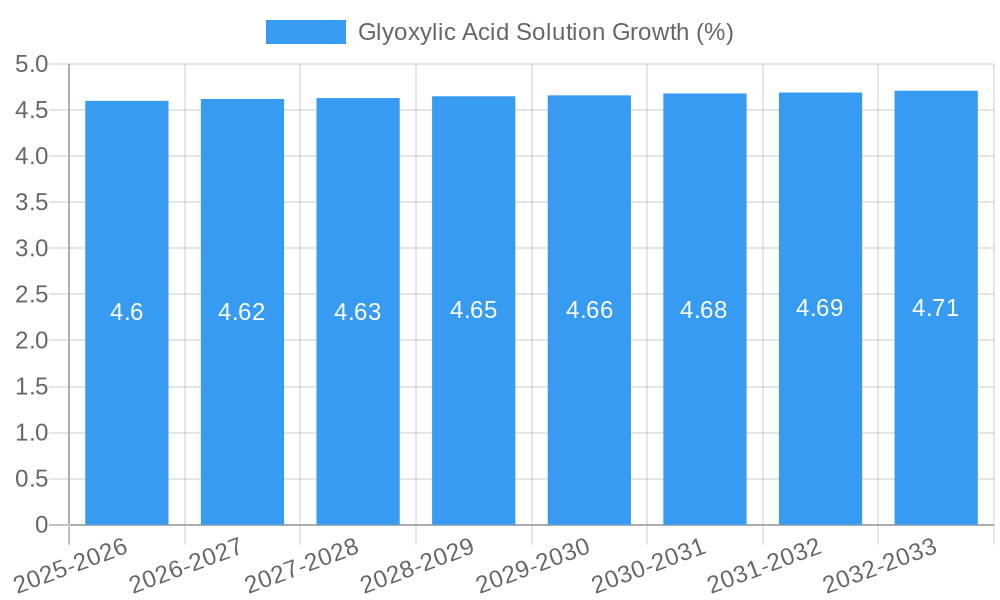
The global Glyoxylic Acid Solution market is poised for significant expansion, with a projected market size of USD 200 million in 2025, and is expected to grow at a Compound Annual Growth Rate (CAGR) of 4.6% through 2033. This robust growth is primarily fueled by the increasing demand from the pharmaceutical sector, where glyoxylic acid serves as a crucial intermediate in the synthesis of various active pharmaceutical ingredients (APIs). Its applications in agrochemicals, particularly for crop protection and yield enhancement, also contribute substantially to market expansion. The cosmetics industry is another key driver, leveraging glyoxylic acid for its hair straightening and conditioning properties. Emerging applications in flavors and fragrances are also creating new avenues for market penetration.
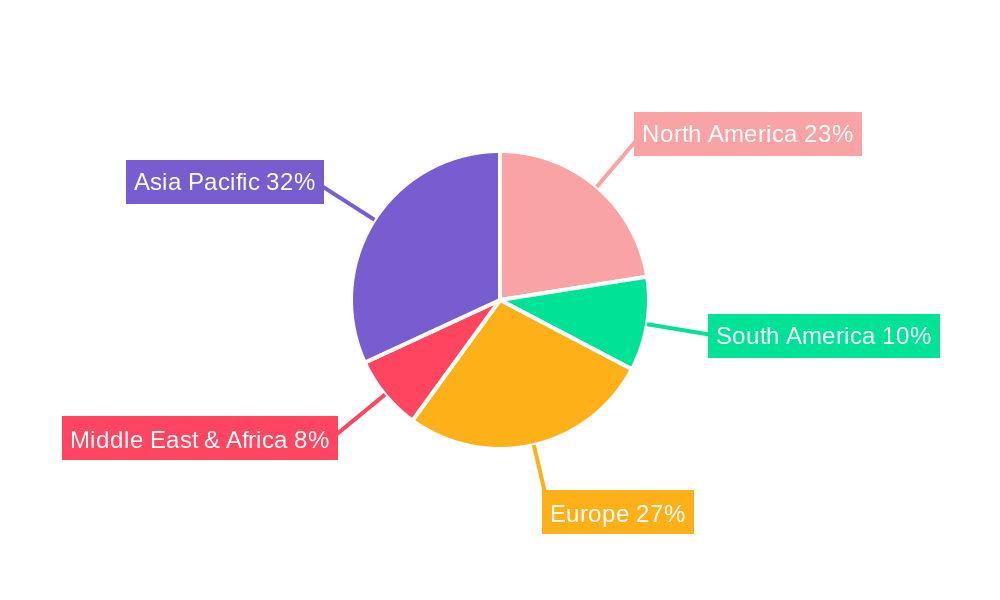
Geographically, the Asia Pacific region, led by China and India, is anticipated to dominate the market due to its strong manufacturing base and burgeoning demand from end-use industries. North America and Europe are also expected to witness steady growth, driven by stringent quality standards and advancements in research and development. The market is characterized by the presence of several key players, including Akema and Weylchem, who are actively involved in capacity expansions and product innovation. However, fluctuating raw material prices and the availability of substitute chemicals could present challenges to sustained growth. Despite these restraints, the overall outlook for the Glyoxylic Acid Solution market remains highly positive, driven by its versatile applications and continuous innovation across various industrial sectors.
Glyoxylic Acid Solution Market Composition & Trends
The global Glyoxylic Acid Solution market, valued at approximately $600 million in 2023, exhibits a moderately concentrated landscape with key players like Akema, Weylchem, Hubei Hongyuan Pharmaceutical, and Qingdao Guolin Technology Group dominating significant market share. Innovation catalysts are primarily driven by escalating demand for high-purity glyoxylic acid in specialized applications and ongoing research into novel synthesis routes, aiming to reduce production costs and environmental impact. The regulatory landscape, particularly concerning chemical safety and sustainability, is a critical influence, shaping manufacturing processes and product formulations. Substitute products, while present in some lower-tier applications, generally fall short in performance and versatility compared to glyoxylic acid. End-user profiles span diverse industries, with pharmaceutical and agrochemical sectors representing substantial consumption. Mergers and acquisitions (M&A) activity, estimated at $350 million in recent years, underscores the strategic consolidation aimed at expanding market reach and technological capabilities.
- Market Share Distribution: Leading companies hold an estimated 70% of the market.
- M&A Deal Values: Recent transactions have collectively amounted to $350 million.
- Innovation Focus: R&D efforts are concentrated on green chemistry and process optimization.
- Regulatory Impact: Compliance with REACH and similar global regulations is paramount.
Glyoxylic Acid Solution Industry Evolution
The Glyoxylic Acid Solution industry has undergone a significant evolution over the historical period of 2019–2024, characterized by consistent market growth and technological advancements. The study period, spanning from 2019 to 2033, with a base year of 2025, reveals a compound annual growth rate (CAGR) projected to reach approximately 6.5% for the forecast period of 2025–2033. This upward trajectory is fueled by burgeoning demand across its diverse applications, particularly in the pharmaceutical sector for the synthesis of vital drug intermediates and in the agrochemical industry for the production of herbicides and pesticides. Technological advancements have been instrumental in enhancing the efficiency and sustainability of glyoxylic acid production. Innovations in catalytic processes, such as the oxidation of glyoxal using heterogeneous catalysts, have led to higher yields, reduced energy consumption, and minimized waste generation. The adoption of continuous flow reactors, compared to traditional batch processes, has further improved scalability and cost-effectiveness. Furthermore, the development of high-purity glyoxylic acid solutions, catering to stringent pharmaceutical and cosmetic requirements, has opened new market avenues and commanded premium pricing. Shifting consumer demands, particularly a global inclination towards greener and more sustainable products, has also propelled the industry forward. Manufacturers are increasingly investing in eco-friendly production methods and exploring bio-based sourcing of raw materials, aligning with market preferences and regulatory pressures. This has fostered the development of advanced glyoxylic acid derivatives with enhanced performance characteristics and reduced environmental footprints. The market has witnessed a gradual shift from a more commoditized product to a specialized chemical, with manufacturers differentiating themselves through product quality, purity, and tailored solutions for specific industrial needs. The increasing complexity of chemical synthesis in various end-use industries, coupled with the unique reactivity of glyoxylic acid, ensures its continued relevance and growth potential.
Leading Regions, Countries, or Segments in Glyoxylic Acid Solution
The Glyoxylic Acid Solution market demonstrates strong regional dominance and segmentation, with Asia Pacific emerging as the leading region. This supremacy is underpinned by a confluence of factors including robust industrial growth, a large manufacturing base, and increasing investments in the chemical and pharmaceutical sectors across countries like China and India. The region benefits from a favorable regulatory environment for chemical production and a growing domestic demand for glyoxylic acid-based products.
Within the Application segment, the Pharmaceutical sector stands out as a primary driver of demand. The intricate synthesis pathways for numerous active pharmaceutical ingredients (APIs) rely heavily on glyoxylic acid as a crucial building block. Its role in producing antiviral drugs, antibiotics, and cardiovascular medications solidifies its indispensable nature. The Agrochemicals segment also contributes significantly, with glyoxylic acid serving as a key intermediate in the production of herbicides, insecticides, and plant growth regulators, supporting global food security initiatives. The Aromas and Cosmetics segments, while smaller, represent high-value niches where glyoxylic acid's unique properties are leveraged for specific product formulations, contributing to growth.
Concerning Types, Glyoxylic Acid 50% holds a dominant position due to its versatile applications and cost-effectiveness in a wide array of industrial processes. Its prevalence in synthesis reactions makes it the workhorse for many manufacturers. Glyoxylic Acid 40% also commands a significant market share, particularly in applications where a slightly lower concentration is preferred or where it serves as an intermediate in further processing.
- Asia Pacific Dominance:
- Key Drivers: Rapid industrialization, substantial chemical manufacturing infrastructure, and a vast consumer base.
- Investment Trends: Significant foreign and domestic investments in chemical production facilities and R&D.
- Regulatory Support: Favorable policies encouraging chemical manufacturing and exports.
- Pharmaceutical Application Dominance:
- Demand Factors: Growing global healthcare needs, increasing prevalence of chronic diseases, and the development of new drug molecules.
- Growth Catalysts: Continuous innovation in drug discovery and a robust pipeline of pharmaceutical products requiring glyoxylic acid.
- Glyoxylic Acid 50% Prevalence:
- Cost-Effectiveness: Offers an optimal balance of concentration and price for broad industrial use.
- Versatility: Adaptable to a wide range of chemical reactions and synthesis processes.
- Established Supply Chains: Widely available and well-integrated into existing manufacturing workflows.
Glyoxylic Acid Solution Product Innovations
Product innovations in the Glyoxylic Acid Solution market are increasingly focused on enhancing purity, developing novel derivatives, and promoting sustainable production. Manufacturers are achieving higher purity levels (e.g., >99%) through advanced purification techniques, catering to stringent pharmaceutical and cosmetic applications where trace impurities can have detrimental effects. Innovations also include the development of reactive glyoxylic acid derivatives for specialized organic synthesis, enabling more efficient and selective chemical transformations. Performance metrics being targeted include improved stability, reduced side reactions, and enhanced biodegradability for environmentally conscious applications. The unique reactive aldehyde and carboxylic acid functionalities of glyoxylic acid continue to inspire the creation of advanced materials and intermediates.
Propelling Factors for Glyoxylic Acid Solution Growth
The Glyoxylic Acid Solution market is propelled by several interconnected factors. Technologically, advancements in catalysis and process engineering are leading to more efficient, cost-effective, and environmentally friendly production methods, making glyoxylic acid more accessible. Economically, the burgeoning pharmaceutical and agrochemical industries, driven by global population growth and healthcare demands, represent a consistent and growing source of demand. Regulatory influences are also playing a crucial role, with increasing emphasis on sustainable and bio-based chemicals, pushing manufacturers to adopt greener production processes and develop products with reduced environmental impact. The versatility of glyoxylic acid as a key intermediate in synthesizing a wide array of high-value chemicals further underpins its growth trajectory.
Obstacles in the Glyoxylic Acid Solution Market
Despite its growth, the Glyoxylic Acid Solution market faces certain obstacles. Stringent regulatory requirements for chemical production and handling, particularly concerning environmental impact and worker safety, can increase operational costs and complexity for manufacturers. Fluctuations in raw material prices, such as those for glyoxal, can create supply chain volatility and impact profitability. Furthermore, the presence of established substitute products in niche applications, while not always superior, can limit market penetration in certain segments. Intense competition among a growing number of producers, especially in emerging economies, can also lead to price pressures, impacting margins for some players.
Future Opportunities in Glyoxylic Acid Solution
Emerging opportunities in the Glyoxylic Acid Solution market are diverse and promising. The growing demand for sustainable and bio-based chemicals presents a significant avenue for innovation, with potential for developing glyoxylic acid from renewable feedstocks. The expanding pharmaceutical sector, particularly in the development of novel therapeutics and personalized medicine, will continue to drive demand for high-purity glyoxylic acid. Furthermore, advancements in materials science and polymer chemistry may unlock new applications for glyoxylic acid derivatives in areas like biodegradable plastics and advanced coatings. The increasing focus on green chemistry initiatives globally also creates opportunities for manufacturers who can demonstrate environmentally superior production processes.
Major Players in the Glyoxylic Acid Solution Ecosystem
- Akema
- Weylchem
- Hubei Hongyuan Pharmaceutical
- Qingdao Guolin Technology Group
- Jiaxing Zhonghua Chemical
- Taixing Yuandong Chemical
- Hubei Shunhui Bio-Technology
- Shijiazhuang Haosheng Chemical
Key Developments in Glyoxylic Acid Solution Industry
- 2023/01: Launch of a new high-purity glyoxylic acid grade by Akema, targeting advanced pharmaceutical synthesis, boosting product portfolio diversity.
- 2022/07: Weylchem announces significant investment in expanding its glyoxylic acid production capacity in Europe to meet rising global demand.
- 2021/11: Hubei Hongyuan Pharmaceutical receives ISO certification for its sustainable glyoxylic acid production processes, enhancing its eco-friendly market positioning.
- 2020/05: Qingdao Guolin Technology Group acquires a smaller specialty chemical producer to expand its reach in the agrochemical applications of glyoxylic acid.
Strategic Glyoxylic Acid Solution Market Forecast
The strategic forecast for the Glyoxylic Acid Solution market hinges on capitalizing on the accelerating demand from the pharmaceutical and agrochemical sectors, driven by global healthcare needs and food security imperatives. Future opportunities lie in the development and adoption of sustainable, bio-based production methods, aligning with increasing environmental consciousness and regulatory mandates. Continued innovation in high-purity grades and novel derivatives will cater to evolving end-user requirements, while strategic partnerships and capacity expansions will solidify market positions, promising robust growth and sustained market potential in the coming years.
Glyoxylic Acid Solution Segmentation
-
1. Application
- 1.1. Aromas
- 1.2. Pharmaceutical
- 1.3. Cosmetics
- 1.4. Agrochemicals
- 1.5. Other
-
2. Types
- 2.1. Glyoxylic Acid 50%
- 2.2. Glyoxylic Acid 40%
Glyoxylic Acid Solution Segmentation By Geography
-
1. North America
- 1.1. United States
- 1.2. Canada
- 1.3. Mexico
-
2. South America
- 2.1. Brazil
- 2.2. Argentina
- 2.3. Rest of South America
-
3. Europe
- 3.1. United Kingdom
- 3.2. Germany
- 3.3. France
- 3.4. Italy
- 3.5. Spain
- 3.6. Russia
- 3.7. Benelux
- 3.8. Nordics
- 3.9. Rest of Europe
-
4. Middle East & Africa
- 4.1. Turkey
- 4.2. Israel
- 4.3. GCC
- 4.4. North Africa
- 4.5. South Africa
- 4.6. Rest of Middle East & Africa
-
5. Asia Pacific
- 5.1. China
- 5.2. India
- 5.3. Japan
- 5.4. South Korea
- 5.5. ASEAN
- 5.6. Oceania
- 5.7. Rest of Asia Pacific
Glyoxylic Acid Solution REPORT HIGHLIGHTS
| Aspects | Details |
|---|---|
| Study Period | 2019-2033 |
| Base Year | 2024 |
| Estimated Year | 2025 |
| Forecast Period | 2025-2033 |
| Historical Period | 2019-2024 |
| Growth Rate | CAGR of 4.6% from 2019-2033 |
| Segmentation |
|
Table of Contents
- 1. Introduction
- 1.1. Research Scope
- 1.2. Market Segmentation
- 1.3. Research Methodology
- 1.4. Definitions and Assumptions
- 2. Executive Summary
- 2.1. Introduction
- 3. Market Dynamics
- 3.1. Introduction
- 3.2. Market Drivers
- 3.3. Market Restrains
- 3.4. Market Trends
- 4. Market Factor Analysis
- 4.1. Porters Five Forces
- 4.2. Supply/Value Chain
- 4.3. PESTEL analysis
- 4.4. Market Entropy
- 4.5. Patent/Trademark Analysis
- 5. Global Glyoxylic Acid Solution Analysis, Insights and Forecast, 2019-2031
- 5.1. Market Analysis, Insights and Forecast - by Application
- 5.1.1. Aromas
- 5.1.2. Pharmaceutical
- 5.1.3. Cosmetics
- 5.1.4. Agrochemicals
- 5.1.5. Other
- 5.2. Market Analysis, Insights and Forecast - by Types
- 5.2.1. Glyoxylic Acid 50%
- 5.2.2. Glyoxylic Acid 40%
- 5.3. Market Analysis, Insights and Forecast - by Region
- 5.3.1. North America
- 5.3.2. South America
- 5.3.3. Europe
- 5.3.4. Middle East & Africa
- 5.3.5. Asia Pacific
- 5.1. Market Analysis, Insights and Forecast - by Application
- 6. North America Glyoxylic Acid Solution Analysis, Insights and Forecast, 2019-2031
- 6.1. Market Analysis, Insights and Forecast - by Application
- 6.1.1. Aromas
- 6.1.2. Pharmaceutical
- 6.1.3. Cosmetics
- 6.1.4. Agrochemicals
- 6.1.5. Other
- 6.2. Market Analysis, Insights and Forecast - by Types
- 6.2.1. Glyoxylic Acid 50%
- 6.2.2. Glyoxylic Acid 40%
- 6.1. Market Analysis, Insights and Forecast - by Application
- 7. South America Glyoxylic Acid Solution Analysis, Insights and Forecast, 2019-2031
- 7.1. Market Analysis, Insights and Forecast - by Application
- 7.1.1. Aromas
- 7.1.2. Pharmaceutical
- 7.1.3. Cosmetics
- 7.1.4. Agrochemicals
- 7.1.5. Other
- 7.2. Market Analysis, Insights and Forecast - by Types
- 7.2.1. Glyoxylic Acid 50%
- 7.2.2. Glyoxylic Acid 40%
- 7.1. Market Analysis, Insights and Forecast - by Application
- 8. Europe Glyoxylic Acid Solution Analysis, Insights and Forecast, 2019-2031
- 8.1. Market Analysis, Insights and Forecast - by Application
- 8.1.1. Aromas
- 8.1.2. Pharmaceutical
- 8.1.3. Cosmetics
- 8.1.4. Agrochemicals
- 8.1.5. Other
- 8.2. Market Analysis, Insights and Forecast - by Types
- 8.2.1. Glyoxylic Acid 50%
- 8.2.2. Glyoxylic Acid 40%
- 8.1. Market Analysis, Insights and Forecast - by Application
- 9. Middle East & Africa Glyoxylic Acid Solution Analysis, Insights and Forecast, 2019-2031
- 9.1. Market Analysis, Insights and Forecast - by Application
- 9.1.1. Aromas
- 9.1.2. Pharmaceutical
- 9.1.3. Cosmetics
- 9.1.4. Agrochemicals
- 9.1.5. Other
- 9.2. Market Analysis, Insights and Forecast - by Types
- 9.2.1. Glyoxylic Acid 50%
- 9.2.2. Glyoxylic Acid 40%
- 9.1. Market Analysis, Insights and Forecast - by Application
- 10. Asia Pacific Glyoxylic Acid Solution Analysis, Insights and Forecast, 2019-2031
- 10.1. Market Analysis, Insights and Forecast - by Application
- 10.1.1. Aromas
- 10.1.2. Pharmaceutical
- 10.1.3. Cosmetics
- 10.1.4. Agrochemicals
- 10.1.5. Other
- 10.2. Market Analysis, Insights and Forecast - by Types
- 10.2.1. Glyoxylic Acid 50%
- 10.2.2. Glyoxylic Acid 40%
- 10.1. Market Analysis, Insights and Forecast - by Application
- 11. Competitive Analysis
- 11.1. Global Market Share Analysis 2024
- 11.2. Company Profiles
- 11.2.1 Akema
- 11.2.1.1. Overview
- 11.2.1.2. Products
- 11.2.1.3. SWOT Analysis
- 11.2.1.4. Recent Developments
- 11.2.1.5. Financials (Based on Availability)
- 11.2.2 Weylchem
- 11.2.2.1. Overview
- 11.2.2.2. Products
- 11.2.2.3. SWOT Analysis
- 11.2.2.4. Recent Developments
- 11.2.2.5. Financials (Based on Availability)
- 11.2.3 Hubei Hongyuan Pharmaceutical
- 11.2.3.1. Overview
- 11.2.3.2. Products
- 11.2.3.3. SWOT Analysis
- 11.2.3.4. Recent Developments
- 11.2.3.5. Financials (Based on Availability)
- 11.2.4 Qingdao Guolin Technology Group
- 11.2.4.1. Overview
- 11.2.4.2. Products
- 11.2.4.3. SWOT Analysis
- 11.2.4.4. Recent Developments
- 11.2.4.5. Financials (Based on Availability)
- 11.2.5 Jiaxing Zhonghua Chemical
- 11.2.5.1. Overview
- 11.2.5.2. Products
- 11.2.5.3. SWOT Analysis
- 11.2.5.4. Recent Developments
- 11.2.5.5. Financials (Based on Availability)
- 11.2.6 Taixing Yuandong Chemical
- 11.2.6.1. Overview
- 11.2.6.2. Products
- 11.2.6.3. SWOT Analysis
- 11.2.6.4. Recent Developments
- 11.2.6.5. Financials (Based on Availability)
- 11.2.7 Hubei Shunhui Bio-Technology
- 11.2.7.1. Overview
- 11.2.7.2. Products
- 11.2.7.3. SWOT Analysis
- 11.2.7.4. Recent Developments
- 11.2.7.5. Financials (Based on Availability)
- 11.2.8 Shijiazhuang Haosheng Chemical
- 11.2.8.1. Overview
- 11.2.8.2. Products
- 11.2.8.3. SWOT Analysis
- 11.2.8.4. Recent Developments
- 11.2.8.5. Financials (Based on Availability)
- 11.2.1 Akema
List of Figures
- Figure 1: Global Glyoxylic Acid Solution Revenue Breakdown (million, %) by Region 2024 & 2032
- Figure 2: Global Glyoxylic Acid Solution Volume Breakdown (K, %) by Region 2024 & 2032
- Figure 3: North America Glyoxylic Acid Solution Revenue (million), by Application 2024 & 2032
- Figure 4: North America Glyoxylic Acid Solution Volume (K), by Application 2024 & 2032
- Figure 5: North America Glyoxylic Acid Solution Revenue Share (%), by Application 2024 & 2032
- Figure 6: North America Glyoxylic Acid Solution Volume Share (%), by Application 2024 & 2032
- Figure 7: North America Glyoxylic Acid Solution Revenue (million), by Types 2024 & 2032
- Figure 8: North America Glyoxylic Acid Solution Volume (K), by Types 2024 & 2032
- Figure 9: North America Glyoxylic Acid Solution Revenue Share (%), by Types 2024 & 2032
- Figure 10: North America Glyoxylic Acid Solution Volume Share (%), by Types 2024 & 2032
- Figure 11: North America Glyoxylic Acid Solution Revenue (million), by Country 2024 & 2032
- Figure 12: North America Glyoxylic Acid Solution Volume (K), by Country 2024 & 2032
- Figure 13: North America Glyoxylic Acid Solution Revenue Share (%), by Country 2024 & 2032
- Figure 14: North America Glyoxylic Acid Solution Volume Share (%), by Country 2024 & 2032
- Figure 15: South America Glyoxylic Acid Solution Revenue (million), by Application 2024 & 2032
- Figure 16: South America Glyoxylic Acid Solution Volume (K), by Application 2024 & 2032
- Figure 17: South America Glyoxylic Acid Solution Revenue Share (%), by Application 2024 & 2032
- Figure 18: South America Glyoxylic Acid Solution Volume Share (%), by Application 2024 & 2032
- Figure 19: South America Glyoxylic Acid Solution Revenue (million), by Types 2024 & 2032
- Figure 20: South America Glyoxylic Acid Solution Volume (K), by Types 2024 & 2032
- Figure 21: South America Glyoxylic Acid Solution Revenue Share (%), by Types 2024 & 2032
- Figure 22: South America Glyoxylic Acid Solution Volume Share (%), by Types 2024 & 2032
- Figure 23: South America Glyoxylic Acid Solution Revenue (million), by Country 2024 & 2032
- Figure 24: South America Glyoxylic Acid Solution Volume (K), by Country 2024 & 2032
- Figure 25: South America Glyoxylic Acid Solution Revenue Share (%), by Country 2024 & 2032
- Figure 26: South America Glyoxylic Acid Solution Volume Share (%), by Country 2024 & 2032
- Figure 27: Europe Glyoxylic Acid Solution Revenue (million), by Application 2024 & 2032
- Figure 28: Europe Glyoxylic Acid Solution Volume (K), by Application 2024 & 2032
- Figure 29: Europe Glyoxylic Acid Solution Revenue Share (%), by Application 2024 & 2032
- Figure 30: Europe Glyoxylic Acid Solution Volume Share (%), by Application 2024 & 2032
- Figure 31: Europe Glyoxylic Acid Solution Revenue (million), by Types 2024 & 2032
- Figure 32: Europe Glyoxylic Acid Solution Volume (K), by Types 2024 & 2032
- Figure 33: Europe Glyoxylic Acid Solution Revenue Share (%), by Types 2024 & 2032
- Figure 34: Europe Glyoxylic Acid Solution Volume Share (%), by Types 2024 & 2032
- Figure 35: Europe Glyoxylic Acid Solution Revenue (million), by Country 2024 & 2032
- Figure 36: Europe Glyoxylic Acid Solution Volume (K), by Country 2024 & 2032
- Figure 37: Europe Glyoxylic Acid Solution Revenue Share (%), by Country 2024 & 2032
- Figure 38: Europe Glyoxylic Acid Solution Volume Share (%), by Country 2024 & 2032
- Figure 39: Middle East & Africa Glyoxylic Acid Solution Revenue (million), by Application 2024 & 2032
- Figure 40: Middle East & Africa Glyoxylic Acid Solution Volume (K), by Application 2024 & 2032
- Figure 41: Middle East & Africa Glyoxylic Acid Solution Revenue Share (%), by Application 2024 & 2032
- Figure 42: Middle East & Africa Glyoxylic Acid Solution Volume Share (%), by Application 2024 & 2032
- Figure 43: Middle East & Africa Glyoxylic Acid Solution Revenue (million), by Types 2024 & 2032
- Figure 44: Middle East & Africa Glyoxylic Acid Solution Volume (K), by Types 2024 & 2032
- Figure 45: Middle East & Africa Glyoxylic Acid Solution Revenue Share (%), by Types 2024 & 2032
- Figure 46: Middle East & Africa Glyoxylic Acid Solution Volume Share (%), by Types 2024 & 2032
- Figure 47: Middle East & Africa Glyoxylic Acid Solution Revenue (million), by Country 2024 & 2032
- Figure 48: Middle East & Africa Glyoxylic Acid Solution Volume (K), by Country 2024 & 2032
- Figure 49: Middle East & Africa Glyoxylic Acid Solution Revenue Share (%), by Country 2024 & 2032
- Figure 50: Middle East & Africa Glyoxylic Acid Solution Volume Share (%), by Country 2024 & 2032
- Figure 51: Asia Pacific Glyoxylic Acid Solution Revenue (million), by Application 2024 & 2032
- Figure 52: Asia Pacific Glyoxylic Acid Solution Volume (K), by Application 2024 & 2032
- Figure 53: Asia Pacific Glyoxylic Acid Solution Revenue Share (%), by Application 2024 & 2032
- Figure 54: Asia Pacific Glyoxylic Acid Solution Volume Share (%), by Application 2024 & 2032
- Figure 55: Asia Pacific Glyoxylic Acid Solution Revenue (million), by Types 2024 & 2032
- Figure 56: Asia Pacific Glyoxylic Acid Solution Volume (K), by Types 2024 & 2032
- Figure 57: Asia Pacific Glyoxylic Acid Solution Revenue Share (%), by Types 2024 & 2032
- Figure 58: Asia Pacific Glyoxylic Acid Solution Volume Share (%), by Types 2024 & 2032
- Figure 59: Asia Pacific Glyoxylic Acid Solution Revenue (million), by Country 2024 & 2032
- Figure 60: Asia Pacific Glyoxylic Acid Solution Volume (K), by Country 2024 & 2032
- Figure 61: Asia Pacific Glyoxylic Acid Solution Revenue Share (%), by Country 2024 & 2032
- Figure 62: Asia Pacific Glyoxylic Acid Solution Volume Share (%), by Country 2024 & 2032
List of Tables
- Table 1: Global Glyoxylic Acid Solution Revenue million Forecast, by Region 2019 & 2032
- Table 2: Global Glyoxylic Acid Solution Volume K Forecast, by Region 2019 & 2032
- Table 3: Global Glyoxylic Acid Solution Revenue million Forecast, by Application 2019 & 2032
- Table 4: Global Glyoxylic Acid Solution Volume K Forecast, by Application 2019 & 2032
- Table 5: Global Glyoxylic Acid Solution Revenue million Forecast, by Types 2019 & 2032
- Table 6: Global Glyoxylic Acid Solution Volume K Forecast, by Types 2019 & 2032
- Table 7: Global Glyoxylic Acid Solution Revenue million Forecast, by Region 2019 & 2032
- Table 8: Global Glyoxylic Acid Solution Volume K Forecast, by Region 2019 & 2032
- Table 9: Global Glyoxylic Acid Solution Revenue million Forecast, by Application 2019 & 2032
- Table 10: Global Glyoxylic Acid Solution Volume K Forecast, by Application 2019 & 2032
- Table 11: Global Glyoxylic Acid Solution Revenue million Forecast, by Types 2019 & 2032
- Table 12: Global Glyoxylic Acid Solution Volume K Forecast, by Types 2019 & 2032
- Table 13: Global Glyoxylic Acid Solution Revenue million Forecast, by Country 2019 & 2032
- Table 14: Global Glyoxylic Acid Solution Volume K Forecast, by Country 2019 & 2032
- Table 15: United States Glyoxylic Acid Solution Revenue (million) Forecast, by Application 2019 & 2032
- Table 16: United States Glyoxylic Acid Solution Volume (K) Forecast, by Application 2019 & 2032
- Table 17: Canada Glyoxylic Acid Solution Revenue (million) Forecast, by Application 2019 & 2032
- Table 18: Canada Glyoxylic Acid Solution Volume (K) Forecast, by Application 2019 & 2032
- Table 19: Mexico Glyoxylic Acid Solution Revenue (million) Forecast, by Application 2019 & 2032
- Table 20: Mexico Glyoxylic Acid Solution Volume (K) Forecast, by Application 2019 & 2032
- Table 21: Global Glyoxylic Acid Solution Revenue million Forecast, by Application 2019 & 2032
- Table 22: Global Glyoxylic Acid Solution Volume K Forecast, by Application 2019 & 2032
- Table 23: Global Glyoxylic Acid Solution Revenue million Forecast, by Types 2019 & 2032
- Table 24: Global Glyoxylic Acid Solution Volume K Forecast, by Types 2019 & 2032
- Table 25: Global Glyoxylic Acid Solution Revenue million Forecast, by Country 2019 & 2032
- Table 26: Global Glyoxylic Acid Solution Volume K Forecast, by Country 2019 & 2032
- Table 27: Brazil Glyoxylic Acid Solution Revenue (million) Forecast, by Application 2019 & 2032
- Table 28: Brazil Glyoxylic Acid Solution Volume (K) Forecast, by Application 2019 & 2032
- Table 29: Argentina Glyoxylic Acid Solution Revenue (million) Forecast, by Application 2019 & 2032
- Table 30: Argentina Glyoxylic Acid Solution Volume (K) Forecast, by Application 2019 & 2032
- Table 31: Rest of South America Glyoxylic Acid Solution Revenue (million) Forecast, by Application 2019 & 2032
- Table 32: Rest of South America Glyoxylic Acid Solution Volume (K) Forecast, by Application 2019 & 2032
- Table 33: Global Glyoxylic Acid Solution Revenue million Forecast, by Application 2019 & 2032
- Table 34: Global Glyoxylic Acid Solution Volume K Forecast, by Application 2019 & 2032
- Table 35: Global Glyoxylic Acid Solution Revenue million Forecast, by Types 2019 & 2032
- Table 36: Global Glyoxylic Acid Solution Volume K Forecast, by Types 2019 & 2032
- Table 37: Global Glyoxylic Acid Solution Revenue million Forecast, by Country 2019 & 2032
- Table 38: Global Glyoxylic Acid Solution Volume K Forecast, by Country 2019 & 2032
- Table 39: United Kingdom Glyoxylic Acid Solution Revenue (million) Forecast, by Application 2019 & 2032
- Table 40: United Kingdom Glyoxylic Acid Solution Volume (K) Forecast, by Application 2019 & 2032
- Table 41: Germany Glyoxylic Acid Solution Revenue (million) Forecast, by Application 2019 & 2032
- Table 42: Germany Glyoxylic Acid Solution Volume (K) Forecast, by Application 2019 & 2032
- Table 43: France Glyoxylic Acid Solution Revenue (million) Forecast, by Application 2019 & 2032
- Table 44: France Glyoxylic Acid Solution Volume (K) Forecast, by Application 2019 & 2032
- Table 45: Italy Glyoxylic Acid Solution Revenue (million) Forecast, by Application 2019 & 2032
- Table 46: Italy Glyoxylic Acid Solution Volume (K) Forecast, by Application 2019 & 2032
- Table 47: Spain Glyoxylic Acid Solution Revenue (million) Forecast, by Application 2019 & 2032
- Table 48: Spain Glyoxylic Acid Solution Volume (K) Forecast, by Application 2019 & 2032
- Table 49: Russia Glyoxylic Acid Solution Revenue (million) Forecast, by Application 2019 & 2032
- Table 50: Russia Glyoxylic Acid Solution Volume (K) Forecast, by Application 2019 & 2032
- Table 51: Benelux Glyoxylic Acid Solution Revenue (million) Forecast, by Application 2019 & 2032
- Table 52: Benelux Glyoxylic Acid Solution Volume (K) Forecast, by Application 2019 & 2032
- Table 53: Nordics Glyoxylic Acid Solution Revenue (million) Forecast, by Application 2019 & 2032
- Table 54: Nordics Glyoxylic Acid Solution Volume (K) Forecast, by Application 2019 & 2032
- Table 55: Rest of Europe Glyoxylic Acid Solution Revenue (million) Forecast, by Application 2019 & 2032
- Table 56: Rest of Europe Glyoxylic Acid Solution Volume (K) Forecast, by Application 2019 & 2032
- Table 57: Global Glyoxylic Acid Solution Revenue million Forecast, by Application 2019 & 2032
- Table 58: Global Glyoxylic Acid Solution Volume K Forecast, by Application 2019 & 2032
- Table 59: Global Glyoxylic Acid Solution Revenue million Forecast, by Types 2019 & 2032
- Table 60: Global Glyoxylic Acid Solution Volume K Forecast, by Types 2019 & 2032
- Table 61: Global Glyoxylic Acid Solution Revenue million Forecast, by Country 2019 & 2032
- Table 62: Global Glyoxylic Acid Solution Volume K Forecast, by Country 2019 & 2032
- Table 63: Turkey Glyoxylic Acid Solution Revenue (million) Forecast, by Application 2019 & 2032
- Table 64: Turkey Glyoxylic Acid Solution Volume (K) Forecast, by Application 2019 & 2032
- Table 65: Israel Glyoxylic Acid Solution Revenue (million) Forecast, by Application 2019 & 2032
- Table 66: Israel Glyoxylic Acid Solution Volume (K) Forecast, by Application 2019 & 2032
- Table 67: GCC Glyoxylic Acid Solution Revenue (million) Forecast, by Application 2019 & 2032
- Table 68: GCC Glyoxylic Acid Solution Volume (K) Forecast, by Application 2019 & 2032
- Table 69: North Africa Glyoxylic Acid Solution Revenue (million) Forecast, by Application 2019 & 2032
- Table 70: North Africa Glyoxylic Acid Solution Volume (K) Forecast, by Application 2019 & 2032
- Table 71: South Africa Glyoxylic Acid Solution Revenue (million) Forecast, by Application 2019 & 2032
- Table 72: South Africa Glyoxylic Acid Solution Volume (K) Forecast, by Application 2019 & 2032
- Table 73: Rest of Middle East & Africa Glyoxylic Acid Solution Revenue (million) Forecast, by Application 2019 & 2032
- Table 74: Rest of Middle East & Africa Glyoxylic Acid Solution Volume (K) Forecast, by Application 2019 & 2032
- Table 75: Global Glyoxylic Acid Solution Revenue million Forecast, by Application 2019 & 2032
- Table 76: Global Glyoxylic Acid Solution Volume K Forecast, by Application 2019 & 2032
- Table 77: Global Glyoxylic Acid Solution Revenue million Forecast, by Types 2019 & 2032
- Table 78: Global Glyoxylic Acid Solution Volume K Forecast, by Types 2019 & 2032
- Table 79: Global Glyoxylic Acid Solution Revenue million Forecast, by Country 2019 & 2032
- Table 80: Global Glyoxylic Acid Solution Volume K Forecast, by Country 2019 & 2032
- Table 81: China Glyoxylic Acid Solution Revenue (million) Forecast, by Application 2019 & 2032
- Table 82: China Glyoxylic Acid Solution Volume (K) Forecast, by Application 2019 & 2032
- Table 83: India Glyoxylic Acid Solution Revenue (million) Forecast, by Application 2019 & 2032
- Table 84: India Glyoxylic Acid Solution Volume (K) Forecast, by Application 2019 & 2032
- Table 85: Japan Glyoxylic Acid Solution Revenue (million) Forecast, by Application 2019 & 2032
- Table 86: Japan Glyoxylic Acid Solution Volume (K) Forecast, by Application 2019 & 2032
- Table 87: South Korea Glyoxylic Acid Solution Revenue (million) Forecast, by Application 2019 & 2032
- Table 88: South Korea Glyoxylic Acid Solution Volume (K) Forecast, by Application 2019 & 2032
- Table 89: ASEAN Glyoxylic Acid Solution Revenue (million) Forecast, by Application 2019 & 2032
- Table 90: ASEAN Glyoxylic Acid Solution Volume (K) Forecast, by Application 2019 & 2032
- Table 91: Oceania Glyoxylic Acid Solution Revenue (million) Forecast, by Application 2019 & 2032
- Table 92: Oceania Glyoxylic Acid Solution Volume (K) Forecast, by Application 2019 & 2032
- Table 93: Rest of Asia Pacific Glyoxylic Acid Solution Revenue (million) Forecast, by Application 2019 & 2032
- Table 94: Rest of Asia Pacific Glyoxylic Acid Solution Volume (K) Forecast, by Application 2019 & 2032
Frequently Asked Questions
1. What is the projected Compound Annual Growth Rate (CAGR) of the Glyoxylic Acid Solution?
The projected CAGR is approximately 4.6%.
2. Which companies are prominent players in the Glyoxylic Acid Solution?
Key companies in the market include Akema, Weylchem, Hubei Hongyuan Pharmaceutical, Qingdao Guolin Technology Group, Jiaxing Zhonghua Chemical, Taixing Yuandong Chemical, Hubei Shunhui Bio-Technology, Shijiazhuang Haosheng Chemical.
3. What are the main segments of the Glyoxylic Acid Solution?
The market segments include Application, Types.
4. Can you provide details about the market size?
The market size is estimated to be USD 200 million as of 2022.
5. What are some drivers contributing to market growth?
N/A
6. What are the notable trends driving market growth?
N/A
7. Are there any restraints impacting market growth?
N/A
8. Can you provide examples of recent developments in the market?
N/A
9. What pricing options are available for accessing the report?
Pricing options include single-user, multi-user, and enterprise licenses priced at USD 3950.00, USD 5925.00, and USD 7900.00 respectively.
10. Is the market size provided in terms of value or volume?
The market size is provided in terms of value, measured in million and volume, measured in K.
11. Are there any specific market keywords associated with the report?
Yes, the market keyword associated with the report is "Glyoxylic Acid Solution," which aids in identifying and referencing the specific market segment covered.
12. How do I determine which pricing option suits my needs best?
The pricing options vary based on user requirements and access needs. Individual users may opt for single-user licenses, while businesses requiring broader access may choose multi-user or enterprise licenses for cost-effective access to the report.
13. Are there any additional resources or data provided in the Glyoxylic Acid Solution report?
While the report offers comprehensive insights, it's advisable to review the specific contents or supplementary materials provided to ascertain if additional resources or data are available.
14. How can I stay updated on further developments or reports in the Glyoxylic Acid Solution?
To stay informed about further developments, trends, and reports in the Glyoxylic Acid Solution, consider subscribing to industry newsletters, following relevant companies and organizations, or regularly checking reputable industry news sources and publications.
Methodology
Step 1 - Identification of Relevant Samples Size from Population Database


Step 2 - Approaches for Defining Global Market Size (Value, Volume* & Price*)

Note*: In applicable scenarios
Step 3 - Data Sources
Primary Research
- Web Analytics
- Survey Reports
- Research Institute
- Latest Research Reports
- Opinion Leaders
Secondary Research
- Annual Reports
- White Paper
- Latest Press Release
- Industry Association
- Paid Database
- Investor Presentations

Step 4 - Data Triangulation
Involves using different sources of information in order to increase the validity of a study
These sources are likely to be stakeholders in a program - participants, other researchers, program staff, other community members, and so on.
Then we put all data in single framework & apply various statistical tools to find out the dynamic on the market.
During the analysis stage, feedback from the stakeholder groups would be compared to determine areas of agreement as well as areas of divergence
