

Key Insights
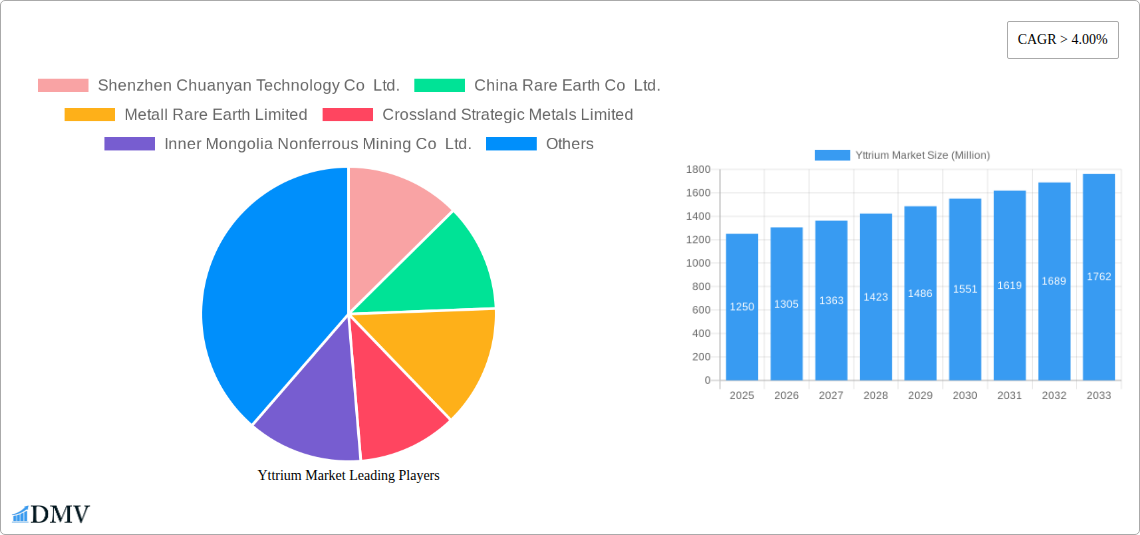
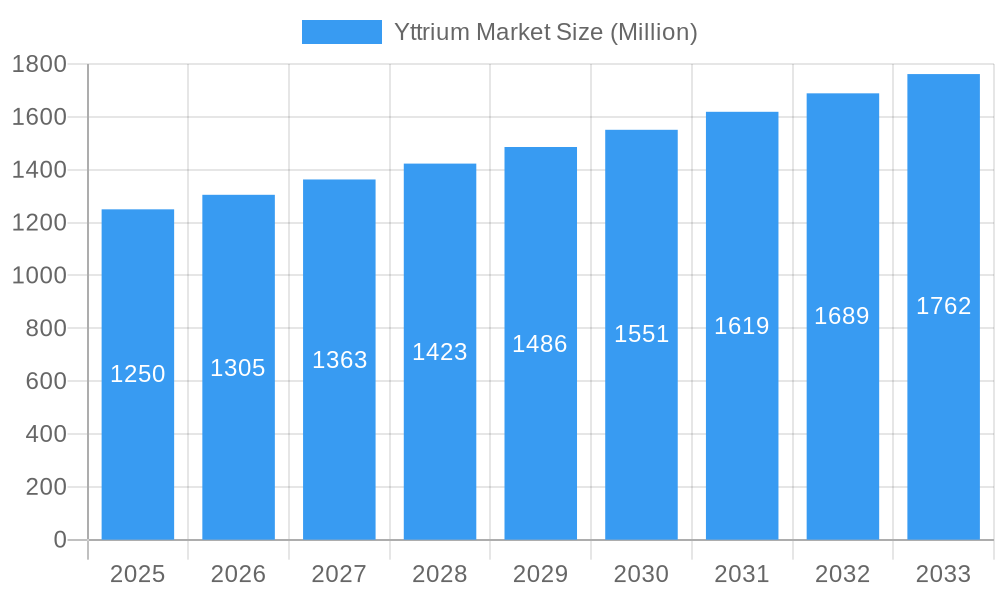
The Yttrium Market is poised for robust expansion, projected to reach an estimated market size of $1.25 billion in 2025, with a Compound Annual Growth Rate (CAGR) exceeding 4.00% throughout the forecast period of 2025-2033. This sustained growth is primarily driven by the increasing demand for yttrium in high-performance applications, including advanced phosphors for lighting and displays, specialized ceramics for electronics, and its critical role in the production of high-temperature refractories and advanced metallurgical alloys. The burgeoning electronics sector, coupled with the ongoing development of solid oxide fuel cells (SOFCs) and sophisticated laser technologies, are significant contributors to this upward trajectory. The market's value is denominated in millions of USD, reflecting the substantial economic activity within this niche but vital segment of the rare earth industry.
Yttrium Market Market Size (In Billion)
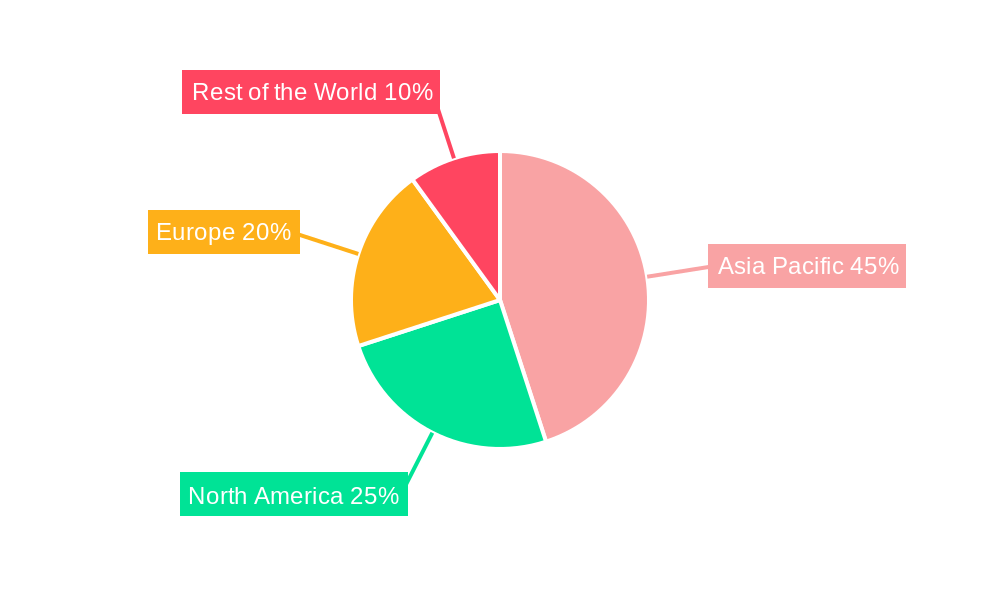
Geographically, the Asia Pacific region, particularly China, is anticipated to dominate the yttrium market, owing to its substantial rare earth reserves and established manufacturing capabilities. Emerging economies within this region, alongside growing technological adoption in India and South Korea, are expected to further fuel regional demand. While technological advancements and the development of new applications present significant growth opportunities, the market faces certain restraints, including the volatility of raw material prices, stringent environmental regulations associated with rare earth mining and processing, and geopolitical factors that can influence supply chains. Nevertheless, the increasing focus on energy efficiency, the development of next-generation electronics, and advancements in materials science are expected to outweigh these challenges, ensuring a dynamic and expanding yttrium market in the coming years.
Yttrium Market Company Market Share
This in-depth Yttrium Market report provides an indispensable analysis of the global yttrium market, meticulously dissecting its composition, evolutionary trajectory, and future potential. Covering the historical period from 2019 to 2024, the base year of 2025, and extending through an extensive forecast period up to 2033, this report offers unparalleled strategic insights for stakeholders navigating the complex landscape of rare earth elements. Gain a competitive edge with data-driven forecasts, an in-depth understanding of industry drivers, and a clear roadmap of emerging opportunities and challenges within the critical yttrium sector.
Yttrium Market Market Composition & Trends
The global Yttrium market is characterized by a moderate concentration of key players, with China Rare Earth Co Ltd., Metall Rare Earth Limited, and Inner Mongolia Nonferrous Mining Co Ltd. holding significant market share. Innovation in yttrium compounds and alloys, driven by advancements in phosphors and electronic devices, is a primary catalyst for market expansion. The regulatory landscape, particularly concerning rare earth mining and export policies in major producing nations, significantly influences market dynamics. Substitute products, while emerging, have yet to fully displace yttrium’s unique properties in critical applications. End-user profiles span diverse industries, from advanced ceramics and high-temperature refractories to cutting-edge lasers and Solid Oxide Fuel Cells (SOFCs). Merger and acquisition (M&A) activities, though not extensively documented publicly with precise deal values, indicate strategic consolidation aimed at securing supply chains and expanding technological capabilities. Anticipated M&A deal values are projected to be in the hundreds of millions of dollars, reflecting the strategic importance of this element.
- Market Share Distribution: Leading companies command a combined market share exceeding 60%.
- Innovation Focus: Advancements in yttrium-based phosphors for LED lighting and display technologies, alongside yttrium-stabilized zirconia (YSZ) for ceramics and SOFCs, are key areas of development.
- Regulatory Influence: Stringent environmental regulations in mining and processing are shaping production costs and supply chain stability.
- End-User Sectors: Electronics (superconductors), automotive (catalysts, batteries), aerospace (high-temperature alloys), and renewable energy (SOFCs) represent primary demand drivers.
Yttrium Market Industry Evolution
The Yttrium market has witnessed a dynamic evolution driven by technological innovation, shifting consumer demands, and the increasing strategic importance of rare earth elements. From 2019 to the present, the market has experienced a compound annual growth rate (CAGR) of approximately 5.5%, with projections indicating a sustained upward trajectory. This growth is intrinsically linked to the burgeoning demand for advanced materials across multiple high-tech sectors. In the historical period, the primary applications for yttrium included phosphors for lighting and display technologies, and metallurgical applications for superalloys. However, the forecast period is expected to see significant expansion in newer, high-growth segments. The development of yttrium-based superconductors for advanced magnetic levitation systems and high-efficiency energy transmission, alongside their critical role in the rapidly expanding Solid Oxide Fuel Cell (SOFC) market, are poised to redefine Yttrium’s industrial footprint. Furthermore, advancements in yttrium oxide for high-temperature refractories and advanced ceramics, crucial for industries like aerospace and defense, continue to fuel market expansion. The increasing adoption of electric vehicles (EVs) and renewable energy infrastructure, such as wind turbines, also necessitates higher purity yttrium for magnet production and electronic components, contributing to a robust growth rate. The increasing emphasis on circular economy principles is also driving innovation in yttrium recycling from scrap alloys and spent electronic devices, ensuring a more sustainable supply chain and further augmenting market growth. The global market size for yttrium is estimated to reach over USD 2,500 million by 2025, with significant growth anticipated through 2033. This evolution is underpinned by consistent investment in research and development, aimed at enhancing extraction efficiencies, improving purity levels, and exploring novel applications for yttrium and its compounds.
Leading Regions, Countries, or Segments in Yttrium Market
The Asia Pacific region stands as the undisputed leader in the global Yttrium market, primarily driven by China's dominant position in both production and consumption. This regional dominance is underpinned by several key factors. Firstly, China possesses the largest known reserves of rare earth elements, including yttrium, and has established a sophisticated mining, processing, and refining infrastructure over decades. This integrated supply chain allows for significant cost advantages and production scale. Secondly, the burgeoning manufacturing sector within China, spanning electronics, automotive, and advanced materials, creates substantial domestic demand for yttrium-based products. For instance, the widespread adoption of LED lighting, a major application for yttrium phosphors, is a significant consumption driver. The application segment of Phosphors consistently ranks as a leading consumer of yttrium, due to its crucial role in generating specific light wavelengths in displays and lighting solutions, contributing an estimated 25% of the total market demand.
- Key Drivers in Asia Pacific:
- Abundant Reserves: China's vast reserves provide a significant supply advantage.
- Manufacturing Hub: Proximity to and dominance in global manufacturing sectors fuels demand.
- Government Support: Strategic initiatives and policies promoting rare earth industry development.
- Technological Advancement: Continuous investment in R&D for new applications.
In terms of product type, Compounds are the leading segment, accounting for over 50% of yttrium consumption. This is due to the versatile applications of yttrium oxide, yttrium fluoride, and other compounds in ceramics, phosphors, and catalysts. The application segment of Ceramics is also a major contributor, with yttrium-stabilized zirconia (YSZ) being indispensable for its high strength, toughness, and thermal resistance in dental implants, cutting tools, and thermal barrier coatings in aerospace. The forecast period anticipates significant growth in Electronic Devices (Superconductors), driven by advancements in high-temperature superconductors for energy storage and transmission, and the application in Solid Oxide Fuel Cell (SOFC) technology, which is gaining traction for its efficiency in clean energy generation.
- Dominance Factors for Compounds:
- Versatile Applications: Essential in phosphors, ceramics, and catalysts.
- High Purity Requirements: Demanded by advanced technological applications.
- Ease of Processing: Compounds offer flexibility in manufacturing processes.
Yttrium Market Product Innovations
Recent product innovations in the Yttrium market center on enhancing purity and tailoring properties for niche, high-performance applications. Advancements in yttrium-based phosphors are yielding brighter, more energy-efficient lighting solutions and vivid display technologies. The development of yttrium-stabilized zirconia (YSZ) powders with improved sintering characteristics and fracture toughness is expanding its use in demanding ceramic applications, including advanced medical implants and aerospace components. Furthermore, research into yttrium-aluminum-garnet (YAG) lasers continues to yield more efficient and powerful laser systems for industrial cutting, welding, and medical procedures. The exploration of yttrium's potential in next-generation battery materials and superconductive components for energy grids represents significant future innovation potential, promising to unlock new market avenues and performance benchmarks.
Propelling Factors for Yttrium Market Growth
The Yttrium market's growth is propelled by a confluence of technological advancements, economic imperatives, and supportive regulatory frameworks. The insatiable demand for advanced electronic devices, including smartphones, televisions, and next-generation computing, drives the need for high-purity yttrium in phosphors and superconducting components. The global transition towards renewable energy sources, particularly wind turbines and electric vehicles, requires significant quantities of yttrium in their manufacturing processes, especially for high-performance magnets. Government initiatives worldwide, focused on securing critical mineral supply chains and promoting green technologies, further stimulate investment and production. For instance, the development of Solid Oxide Fuel Cells (SOFCs) as a clean energy solution is a significant growth catalyst.
Obstacles in the Yttrium Market Market
Despite its promising growth, the Yttrium market faces several critical obstacles. Geopolitical risks associated with the concentration of rare earth mining and processing in a few key countries, particularly China, create supply chain vulnerabilities and price volatility. Stringent environmental regulations surrounding mining and processing can lead to increased operational costs and production delays. Fluctuations in global economic conditions can impact demand from end-user industries, leading to unpredictable market fluctuations. Furthermore, the high cost of extraction and refining for yttrium, coupled with the development of alternative materials in certain applications, presents ongoing competitive pressures. The estimated impact of supply chain disruptions on market growth is projected to be around 5-8% annually.
Future Opportunities in Yttrium Market
The future opportunities in the Yttrium market are vast and diverse, driven by emerging technological frontiers and evolving global needs. The rapid expansion of the electric vehicle market presents a significant opportunity for yttrium in advanced battery technologies and lightweight alloys. The burgeoning demand for high-efficiency renewable energy solutions, such as advanced solar cells and more efficient wind turbine components, will further bolster yttrium consumption. Innovations in medical imaging and treatment, utilizing yttrium-based radioisotopes and lasers, offer promising avenues for growth. Furthermore, the development of quantum computing and advanced sensor technologies relies heavily on high-purity yttrium compounds, signaling a substantial long-term growth potential estimated at over 10% CAGR in these niche segments.
Major Players in the Yttrium Market Ecosystem
- Shenzhen Chuanyan Technology Co Ltd.
- China Rare Earth Co Ltd.
- Metall Rare Earth Limited
- Crossland Strategic Metals Limited
- Inner Mongolia Nonferrous Mining Co Ltd.
- Goring Rare Earth Corporation Limited
- Nippon Yttrium Co Ltd
- GBM Resources Ltd
- Sichuan Lanthanum Rare Materials Limited
- Ganzhou Hong De New Technology Development Ltd. Co.
- The Nilaco Corporation
- Double Park International Corporation
- Zhejiang Jinda Rare-earth Element Co Ltd.
- Chengdu Haoxuan Technology Co. Ltd.
- Alkane Resources
Key Developments in Yttrium Market Industry
- September 2022: China Rare Earth Group Co and Jiangxi Copper Co signed a strategic cooperation agreement to promote the integration of the rare-earth industry. Rare earth (such as yttrium) is an important strategic resource and a key element in the development of high and new technology and green applications.
- September 2022: JL Mag Rare-Earth invested USD100 million in the construction of a recycling factory in Mexico that will convert scrap alloy into permanent magnets (consisting of rare-earth elements such as yttrium), which are used in electric automobiles, wind turbines, and other machinery.
Strategic Yttrium Market Market Forecast
The strategic Yttrium market forecast indicates a robust and sustained growth trajectory driven by critical applications in advanced technologies and the global push for sustainability. The increasing demand for high-performance materials in sectors like renewable energy, electric vehicles, and advanced electronics will continue to be primary growth catalysts. Investments in research and development aimed at unlocking new applications for yttrium, particularly in areas such as energy storage, superconductors, and medical technologies, are expected to further fuel market expansion. While geopolitical and environmental factors pose challenges, strategic collaborations and technological innovations in extraction and recycling will mitigate these risks, ensuring a promising future market potential estimated at over USD 4,000 million by 2033.
Yttrium Market Segmentation
-
1. Product Type
- 1.1. Alloy
- 1.2. Metal
- 1.3. Compounds
-
2. Application
- 2.1. Phosphors
- 2.2. Ceramics
- 2.3. Electronic Devices (Superconductors)
- 2.4. High Temperature Refractories
- 2.5. Lasers
- 2.6. Metallurgical Applications
- 2.7. Solid Oxide Fuel Cell (SOFC)
- 2.8. Other Applications
Yttrium Market Segmentation By Geography
-
1. Asia Pacific
- 1.1. China
- 1.2. India
- 1.3. Japan
- 1.4. South Korea
- 1.5. Rest of Asia Pacific
-
2. North America
- 2.1. United States
- 2.2. Canada
- 2.3. Mexico
-
3. Europe
- 3.1. Germany
- 3.2. United Kingdom
- 3.3. Italy
- 3.4. France
- 3.5. Rest of Europe
-
4. South America
- 4.1. Brazil
- 4.2. Argentina
- 4.3. Rest of South America
-
5. Middle East and Africa
- 5.1. Saudi Arabia
- 5.2. South Africa
- 5.3. Rest of Middle East and Africa
Yttrium Market Regional Market Share
Geographic Coverage of Yttrium Market
Yttrium Market REPORT HIGHLIGHTS
| Aspects | Details |
|---|---|
| Study Period | 2020-2034 |
| Base Year | 2025 |
| Estimated Year | 2026 |
| Forecast Period | 2026-2034 |
| Historical Period | 2020-2025 |
| Growth Rate | CAGR of 5.9% from 2020-2034 |
| Segmentation |
|
Table of Contents
- 1. Introduction
- 1.1. Research Scope
- 1.2. Market Segmentation
- 1.3. Research Objective
- 1.4. Definitions and Assumptions
- 2. Executive Summary
- 2.1. Market Snapshot
- 3. Market Dynamics
- 3.1. Market Drivers
- 3.2. Market Restrains
- 3.3. Market Trends
- 3.4. Market Opportunities
- 4. Market Factor Analysis
- 4.1. Porters Five Forces
- 4.1.1. Bargaining Power of Suppliers
- 4.1.2. Bargaining Power of Buyers
- 4.1.3. Threat of New Entrants
- 4.1.4. Threat of Substitutes
- 4.1.5. Competitive Rivalry
- 4.2. PESTEL analysis
- 4.3. BCG Analysis
- 4.3.1. Stars (High Growth, High Market Share)
- 4.3.2. Cash Cows (Low Growth, High Market Share)
- 4.3.3. Question Mark (High Growth, Low Market Share)
- 4.3.4. Dogs (Low Growth, Low Market Share)
- 4.4. Ansoff Matrix Analysis
- 4.5. Supply Chain Analysis
- 4.6. Regulatory Landscape
- 4.7. Current Market Potential and Opportunity Assessment (TAM–SAM–SOM Framework)
- 4.8. DMV Analyst Note
- 4.1. Porters Five Forces
- 5. Market Analysis, Insights and Forecast 2021-2033
- 5.1. Market Analysis, Insights and Forecast - by Product Type
- 5.1.1. Alloy
- 5.1.2. Metal
- 5.1.3. Compounds
- 5.2. Market Analysis, Insights and Forecast - by Application
- 5.2.1. Phosphors
- 5.2.2. Ceramics
- 5.2.3. Electronic Devices (Superconductors)
- 5.2.4. High Temperature Refractories
- 5.2.5. Lasers
- 5.2.6. Metallurgical Applications
- 5.2.7. Solid Oxide Fuel Cell (SOFC)
- 5.2.8. Other Applications
- 5.3. Market Analysis, Insights and Forecast - by Region
- 5.3.1. Asia Pacific
- 5.3.2. North America
- 5.3.3. Europe
- 5.3.4. South America
- 5.3.5. Middle East and Africa
- 5.1. Market Analysis, Insights and Forecast - by Product Type
- 6. Global Yttrium Market Analysis, Insights and Forecast, 2021-2033
- 6.1. Market Analysis, Insights and Forecast - by Product Type
- 6.1.1. Alloy
- 6.1.2. Metal
- 6.1.3. Compounds
- 6.2. Market Analysis, Insights and Forecast - by Application
- 6.2.1. Phosphors
- 6.2.2. Ceramics
- 6.2.3. Electronic Devices (Superconductors)
- 6.2.4. High Temperature Refractories
- 6.2.5. Lasers
- 6.2.6. Metallurgical Applications
- 6.2.7. Solid Oxide Fuel Cell (SOFC)
- 6.2.8. Other Applications
- 6.1. Market Analysis, Insights and Forecast - by Product Type
- 7. Asia Pacific Yttrium Market Analysis, Insights and Forecast, 2020-2032
- 7.1. Market Analysis, Insights and Forecast - by Product Type
- 7.1.1. Alloy
- 7.1.2. Metal
- 7.1.3. Compounds
- 7.2. Market Analysis, Insights and Forecast - by Application
- 7.2.1. Phosphors
- 7.2.2. Ceramics
- 7.2.3. Electronic Devices (Superconductors)
- 7.2.4. High Temperature Refractories
- 7.2.5. Lasers
- 7.2.6. Metallurgical Applications
- 7.2.7. Solid Oxide Fuel Cell (SOFC)
- 7.2.8. Other Applications
- 7.1. Market Analysis, Insights and Forecast - by Product Type
- 8. North America Yttrium Market Analysis, Insights and Forecast, 2020-2032
- 8.1. Market Analysis, Insights and Forecast - by Product Type
- 8.1.1. Alloy
- 8.1.2. Metal
- 8.1.3. Compounds
- 8.2. Market Analysis, Insights and Forecast - by Application
- 8.2.1. Phosphors
- 8.2.2. Ceramics
- 8.2.3. Electronic Devices (Superconductors)
- 8.2.4. High Temperature Refractories
- 8.2.5. Lasers
- 8.2.6. Metallurgical Applications
- 8.2.7. Solid Oxide Fuel Cell (SOFC)
- 8.2.8. Other Applications
- 8.1. Market Analysis, Insights and Forecast - by Product Type
- 9. Europe Yttrium Market Analysis, Insights and Forecast, 2020-2032
- 9.1. Market Analysis, Insights and Forecast - by Product Type
- 9.1.1. Alloy
- 9.1.2. Metal
- 9.1.3. Compounds
- 9.2. Market Analysis, Insights and Forecast - by Application
- 9.2.1. Phosphors
- 9.2.2. Ceramics
- 9.2.3. Electronic Devices (Superconductors)
- 9.2.4. High Temperature Refractories
- 9.2.5. Lasers
- 9.2.6. Metallurgical Applications
- 9.2.7. Solid Oxide Fuel Cell (SOFC)
- 9.2.8. Other Applications
- 9.1. Market Analysis, Insights and Forecast - by Product Type
- 10. South America Yttrium Market Analysis, Insights and Forecast, 2020-2032
- 10.1. Market Analysis, Insights and Forecast - by Product Type
- 10.1.1. Alloy
- 10.1.2. Metal
- 10.1.3. Compounds
- 10.2. Market Analysis, Insights and Forecast - by Application
- 10.2.1. Phosphors
- 10.2.2. Ceramics
- 10.2.3. Electronic Devices (Superconductors)
- 10.2.4. High Temperature Refractories
- 10.2.5. Lasers
- 10.2.6. Metallurgical Applications
- 10.2.7. Solid Oxide Fuel Cell (SOFC)
- 10.2.8. Other Applications
- 10.1. Market Analysis, Insights and Forecast - by Product Type
- 11. Middle East and Africa Yttrium Market Analysis, Insights and Forecast, 2020-2032
- 11.1. Market Analysis, Insights and Forecast - by Product Type
- 11.1.1. Alloy
- 11.1.2. Metal
- 11.1.3. Compounds
- 11.2. Market Analysis, Insights and Forecast - by Application
- 11.2.1. Phosphors
- 11.2.2. Ceramics
- 11.2.3. Electronic Devices (Superconductors)
- 11.2.4. High Temperature Refractories
- 11.2.5. Lasers
- 11.2.6. Metallurgical Applications
- 11.2.7. Solid Oxide Fuel Cell (SOFC)
- 11.2.8. Other Applications
- 11.1. Market Analysis, Insights and Forecast - by Product Type
- 12. Competitive Analysis
- 12.1. Company Profiles
- 12.1.1 Shenzhen Chuanyan Technology Co Ltd.
- 12.1.1.1. Company Overview
- 12.1.1.2. Products
- 12.1.1.3. Company Financials
- 12.1.1.4. SWOT Analysis
- 12.1.2 China Rare Earth Co Ltd.
- 12.1.2.1. Company Overview
- 12.1.2.2. Products
- 12.1.2.3. Company Financials
- 12.1.2.4. SWOT Analysis
- 12.1.3 Metall Rare Earth Limited
- 12.1.3.1. Company Overview
- 12.1.3.2. Products
- 12.1.3.3. Company Financials
- 12.1.3.4. SWOT Analysis
- 12.1.4 Crossland Strategic Metals Limited
- 12.1.4.1. Company Overview
- 12.1.4.2. Products
- 12.1.4.3. Company Financials
- 12.1.4.4. SWOT Analysis
- 12.1.5 Inner Mongolia Nonferrous Mining Co Ltd.
- 12.1.5.1. Company Overview
- 12.1.5.2. Products
- 12.1.5.3. Company Financials
- 12.1.5.4. SWOT Analysis
- 12.1.6 Goring Rare Earth Corporation Limited
- 12.1.6.1. Company Overview
- 12.1.6.2. Products
- 12.1.6.3. Company Financials
- 12.1.6.4. SWOT Analysis
- 12.1.7 Nippon Yttrium Co Ltd
- 12.1.7.1. Company Overview
- 12.1.7.2. Products
- 12.1.7.3. Company Financials
- 12.1.7.4. SWOT Analysis
- 12.1.8 GBM Resources Ltd
- 12.1.8.1. Company Overview
- 12.1.8.2. Products
- 12.1.8.3. Company Financials
- 12.1.8.4. SWOT Analysis
- 12.1.9 Sichuan Lanthanum Rare Materials Limited
- 12.1.9.1. Company Overview
- 12.1.9.2. Products
- 12.1.9.3. Company Financials
- 12.1.9.4. SWOT Analysis
- 12.1.10 Ganzhou Hong De New Technology Development Ltd. Co.
- 12.1.10.1. Company Overview
- 12.1.10.2. Products
- 12.1.10.3. Company Financials
- 12.1.10.4. SWOT Analysis
- 12.1.11 The Nilaco Corporation
- 12.1.11.1. Company Overview
- 12.1.11.2. Products
- 12.1.11.3. Company Financials
- 12.1.11.4. SWOT Analysis
- 12.1.12 Double Park International Corporation
- 12.1.12.1. Company Overview
- 12.1.12.2. Products
- 12.1.12.3. Company Financials
- 12.1.12.4. SWOT Analysis
- 12.1.13 Zhejiang Jinda Rare-earth Element Co Ltd.
- 12.1.13.1. Company Overview
- 12.1.13.2. Products
- 12.1.13.3. Company Financials
- 12.1.13.4. SWOT Analysis
- 12.1.14 Chengdu Haoxuan Technology Co. Ltd.
- 12.1.14.1. Company Overview
- 12.1.14.2. Products
- 12.1.14.3. Company Financials
- 12.1.14.4. SWOT Analysis
- 12.1.15 Alkane Resources
- 12.1.15.1. Company Overview
- 12.1.15.2. Products
- 12.1.15.3. Company Financials
- 12.1.15.4. SWOT Analysis
- 12.1.1 Shenzhen Chuanyan Technology Co Ltd.
- 12.2. Market Entropy
- 12.2.1 Company's Key Areas Served
- 12.2.2 Recent Developments
- 12.3. Company Market Share Analysis 2025
- 12.3.1 Top 5 Companies Market Share Analysis
- 12.3.2 Top 3 Companies Market Share Analysis
- 12.4. List of Potential Customers
- 13. Research Methodology
List of Figures
- Figure 1: Global Yttrium Market Revenue Breakdown (billion, %) by Region 2025 & 2033
- Figure 2: Global Yttrium Market Volume Breakdown (K Tons, %) by Region 2025 & 2033
- Figure 3: Asia Pacific Yttrium Market Revenue (billion), by Product Type 2025 & 2033
- Figure 4: Asia Pacific Yttrium Market Volume (K Tons), by Product Type 2025 & 2033
- Figure 5: Asia Pacific Yttrium Market Revenue Share (%), by Product Type 2025 & 2033
- Figure 6: Asia Pacific Yttrium Market Volume Share (%), by Product Type 2025 & 2033
- Figure 7: Asia Pacific Yttrium Market Revenue (billion), by Application 2025 & 2033
- Figure 8: Asia Pacific Yttrium Market Volume (K Tons), by Application 2025 & 2033
- Figure 9: Asia Pacific Yttrium Market Revenue Share (%), by Application 2025 & 2033
- Figure 10: Asia Pacific Yttrium Market Volume Share (%), by Application 2025 & 2033
- Figure 11: Asia Pacific Yttrium Market Revenue (billion), by Country 2025 & 2033
- Figure 12: Asia Pacific Yttrium Market Volume (K Tons), by Country 2025 & 2033
- Figure 13: Asia Pacific Yttrium Market Revenue Share (%), by Country 2025 & 2033
- Figure 14: Asia Pacific Yttrium Market Volume Share (%), by Country 2025 & 2033
- Figure 15: North America Yttrium Market Revenue (billion), by Product Type 2025 & 2033
- Figure 16: North America Yttrium Market Volume (K Tons), by Product Type 2025 & 2033
- Figure 17: North America Yttrium Market Revenue Share (%), by Product Type 2025 & 2033
- Figure 18: North America Yttrium Market Volume Share (%), by Product Type 2025 & 2033
- Figure 19: North America Yttrium Market Revenue (billion), by Application 2025 & 2033
- Figure 20: North America Yttrium Market Volume (K Tons), by Application 2025 & 2033
- Figure 21: North America Yttrium Market Revenue Share (%), by Application 2025 & 2033
- Figure 22: North America Yttrium Market Volume Share (%), by Application 2025 & 2033
- Figure 23: North America Yttrium Market Revenue (billion), by Country 2025 & 2033
- Figure 24: North America Yttrium Market Volume (K Tons), by Country 2025 & 2033
- Figure 25: North America Yttrium Market Revenue Share (%), by Country 2025 & 2033
- Figure 26: North America Yttrium Market Volume Share (%), by Country 2025 & 2033
- Figure 27: Europe Yttrium Market Revenue (billion), by Product Type 2025 & 2033
- Figure 28: Europe Yttrium Market Volume (K Tons), by Product Type 2025 & 2033
- Figure 29: Europe Yttrium Market Revenue Share (%), by Product Type 2025 & 2033
- Figure 30: Europe Yttrium Market Volume Share (%), by Product Type 2025 & 2033
- Figure 31: Europe Yttrium Market Revenue (billion), by Application 2025 & 2033
- Figure 32: Europe Yttrium Market Volume (K Tons), by Application 2025 & 2033
- Figure 33: Europe Yttrium Market Revenue Share (%), by Application 2025 & 2033
- Figure 34: Europe Yttrium Market Volume Share (%), by Application 2025 & 2033
- Figure 35: Europe Yttrium Market Revenue (billion), by Country 2025 & 2033
- Figure 36: Europe Yttrium Market Volume (K Tons), by Country 2025 & 2033
- Figure 37: Europe Yttrium Market Revenue Share (%), by Country 2025 & 2033
- Figure 38: Europe Yttrium Market Volume Share (%), by Country 2025 & 2033
- Figure 39: South America Yttrium Market Revenue (billion), by Product Type 2025 & 2033
- Figure 40: South America Yttrium Market Volume (K Tons), by Product Type 2025 & 2033
- Figure 41: South America Yttrium Market Revenue Share (%), by Product Type 2025 & 2033
- Figure 42: South America Yttrium Market Volume Share (%), by Product Type 2025 & 2033
- Figure 43: South America Yttrium Market Revenue (billion), by Application 2025 & 2033
- Figure 44: South America Yttrium Market Volume (K Tons), by Application 2025 & 2033
- Figure 45: South America Yttrium Market Revenue Share (%), by Application 2025 & 2033
- Figure 46: South America Yttrium Market Volume Share (%), by Application 2025 & 2033
- Figure 47: South America Yttrium Market Revenue (billion), by Country 2025 & 2033
- Figure 48: South America Yttrium Market Volume (K Tons), by Country 2025 & 2033
- Figure 49: South America Yttrium Market Revenue Share (%), by Country 2025 & 2033
- Figure 50: South America Yttrium Market Volume Share (%), by Country 2025 & 2033
- Figure 51: Middle East and Africa Yttrium Market Revenue (billion), by Product Type 2025 & 2033
- Figure 52: Middle East and Africa Yttrium Market Volume (K Tons), by Product Type 2025 & 2033
- Figure 53: Middle East and Africa Yttrium Market Revenue Share (%), by Product Type 2025 & 2033
- Figure 54: Middle East and Africa Yttrium Market Volume Share (%), by Product Type 2025 & 2033
- Figure 55: Middle East and Africa Yttrium Market Revenue (billion), by Application 2025 & 2033
- Figure 56: Middle East and Africa Yttrium Market Volume (K Tons), by Application 2025 & 2033
- Figure 57: Middle East and Africa Yttrium Market Revenue Share (%), by Application 2025 & 2033
- Figure 58: Middle East and Africa Yttrium Market Volume Share (%), by Application 2025 & 2033
- Figure 59: Middle East and Africa Yttrium Market Revenue (billion), by Country 2025 & 2033
- Figure 60: Middle East and Africa Yttrium Market Volume (K Tons), by Country 2025 & 2033
- Figure 61: Middle East and Africa Yttrium Market Revenue Share (%), by Country 2025 & 2033
- Figure 62: Middle East and Africa Yttrium Market Volume Share (%), by Country 2025 & 2033
List of Tables
- Table 1: Global Yttrium Market Revenue billion Forecast, by Product Type 2020 & 2033
- Table 2: Global Yttrium Market Volume K Tons Forecast, by Product Type 2020 & 2033
- Table 3: Global Yttrium Market Revenue billion Forecast, by Application 2020 & 2033
- Table 4: Global Yttrium Market Volume K Tons Forecast, by Application 2020 & 2033
- Table 5: Global Yttrium Market Revenue billion Forecast, by Region 2020 & 2033
- Table 6: Global Yttrium Market Volume K Tons Forecast, by Region 2020 & 2033
- Table 7: Global Yttrium Market Revenue billion Forecast, by Product Type 2020 & 2033
- Table 8: Global Yttrium Market Volume K Tons Forecast, by Product Type 2020 & 2033
- Table 9: Global Yttrium Market Revenue billion Forecast, by Application 2020 & 2033
- Table 10: Global Yttrium Market Volume K Tons Forecast, by Application 2020 & 2033
- Table 11: Global Yttrium Market Revenue billion Forecast, by Country 2020 & 2033
- Table 12: Global Yttrium Market Volume K Tons Forecast, by Country 2020 & 2033
- Table 13: China Yttrium Market Revenue (billion) Forecast, by Application 2020 & 2033
- Table 14: China Yttrium Market Volume (K Tons) Forecast, by Application 2020 & 2033
- Table 15: India Yttrium Market Revenue (billion) Forecast, by Application 2020 & 2033
- Table 16: India Yttrium Market Volume (K Tons) Forecast, by Application 2020 & 2033
- Table 17: Japan Yttrium Market Revenue (billion) Forecast, by Application 2020 & 2033
- Table 18: Japan Yttrium Market Volume (K Tons) Forecast, by Application 2020 & 2033
- Table 19: South Korea Yttrium Market Revenue (billion) Forecast, by Application 2020 & 2033
- Table 20: South Korea Yttrium Market Volume (K Tons) Forecast, by Application 2020 & 2033
- Table 21: Rest of Asia Pacific Yttrium Market Revenue (billion) Forecast, by Application 2020 & 2033
- Table 22: Rest of Asia Pacific Yttrium Market Volume (K Tons) Forecast, by Application 2020 & 2033
- Table 23: Global Yttrium Market Revenue billion Forecast, by Product Type 2020 & 2033
- Table 24: Global Yttrium Market Volume K Tons Forecast, by Product Type 2020 & 2033
- Table 25: Global Yttrium Market Revenue billion Forecast, by Application 2020 & 2033
- Table 26: Global Yttrium Market Volume K Tons Forecast, by Application 2020 & 2033
- Table 27: Global Yttrium Market Revenue billion Forecast, by Country 2020 & 2033
- Table 28: Global Yttrium Market Volume K Tons Forecast, by Country 2020 & 2033
- Table 29: United States Yttrium Market Revenue (billion) Forecast, by Application 2020 & 2033
- Table 30: United States Yttrium Market Volume (K Tons) Forecast, by Application 2020 & 2033
- Table 31: Canada Yttrium Market Revenue (billion) Forecast, by Application 2020 & 2033
- Table 32: Canada Yttrium Market Volume (K Tons) Forecast, by Application 2020 & 2033
- Table 33: Mexico Yttrium Market Revenue (billion) Forecast, by Application 2020 & 2033
- Table 34: Mexico Yttrium Market Volume (K Tons) Forecast, by Application 2020 & 2033
- Table 35: Global Yttrium Market Revenue billion Forecast, by Product Type 2020 & 2033
- Table 36: Global Yttrium Market Volume K Tons Forecast, by Product Type 2020 & 2033
- Table 37: Global Yttrium Market Revenue billion Forecast, by Application 2020 & 2033
- Table 38: Global Yttrium Market Volume K Tons Forecast, by Application 2020 & 2033
- Table 39: Global Yttrium Market Revenue billion Forecast, by Country 2020 & 2033
- Table 40: Global Yttrium Market Volume K Tons Forecast, by Country 2020 & 2033
- Table 41: Germany Yttrium Market Revenue (billion) Forecast, by Application 2020 & 2033
- Table 42: Germany Yttrium Market Volume (K Tons) Forecast, by Application 2020 & 2033
- Table 43: United Kingdom Yttrium Market Revenue (billion) Forecast, by Application 2020 & 2033
- Table 44: United Kingdom Yttrium Market Volume (K Tons) Forecast, by Application 2020 & 2033
- Table 45: Italy Yttrium Market Revenue (billion) Forecast, by Application 2020 & 2033
- Table 46: Italy Yttrium Market Volume (K Tons) Forecast, by Application 2020 & 2033
- Table 47: France Yttrium Market Revenue (billion) Forecast, by Application 2020 & 2033
- Table 48: France Yttrium Market Volume (K Tons) Forecast, by Application 2020 & 2033
- Table 49: Rest of Europe Yttrium Market Revenue (billion) Forecast, by Application 2020 & 2033
- Table 50: Rest of Europe Yttrium Market Volume (K Tons) Forecast, by Application 2020 & 2033
- Table 51: Global Yttrium Market Revenue billion Forecast, by Product Type 2020 & 2033
- Table 52: Global Yttrium Market Volume K Tons Forecast, by Product Type 2020 & 2033
- Table 53: Global Yttrium Market Revenue billion Forecast, by Application 2020 & 2033
- Table 54: Global Yttrium Market Volume K Tons Forecast, by Application 2020 & 2033
- Table 55: Global Yttrium Market Revenue billion Forecast, by Country 2020 & 2033
- Table 56: Global Yttrium Market Volume K Tons Forecast, by Country 2020 & 2033
- Table 57: Brazil Yttrium Market Revenue (billion) Forecast, by Application 2020 & 2033
- Table 58: Brazil Yttrium Market Volume (K Tons) Forecast, by Application 2020 & 2033
- Table 59: Argentina Yttrium Market Revenue (billion) Forecast, by Application 2020 & 2033
- Table 60: Argentina Yttrium Market Volume (K Tons) Forecast, by Application 2020 & 2033
- Table 61: Rest of South America Yttrium Market Revenue (billion) Forecast, by Application 2020 & 2033
- Table 62: Rest of South America Yttrium Market Volume (K Tons) Forecast, by Application 2020 & 2033
- Table 63: Global Yttrium Market Revenue billion Forecast, by Product Type 2020 & 2033
- Table 64: Global Yttrium Market Volume K Tons Forecast, by Product Type 2020 & 2033
- Table 65: Global Yttrium Market Revenue billion Forecast, by Application 2020 & 2033
- Table 66: Global Yttrium Market Volume K Tons Forecast, by Application 2020 & 2033
- Table 67: Global Yttrium Market Revenue billion Forecast, by Country 2020 & 2033
- Table 68: Global Yttrium Market Volume K Tons Forecast, by Country 2020 & 2033
- Table 69: Saudi Arabia Yttrium Market Revenue (billion) Forecast, by Application 2020 & 2033
- Table 70: Saudi Arabia Yttrium Market Volume (K Tons) Forecast, by Application 2020 & 2033
- Table 71: South Africa Yttrium Market Revenue (billion) Forecast, by Application 2020 & 2033
- Table 72: South Africa Yttrium Market Volume (K Tons) Forecast, by Application 2020 & 2033
- Table 73: Rest of Middle East and Africa Yttrium Market Revenue (billion) Forecast, by Application 2020 & 2033
- Table 74: Rest of Middle East and Africa Yttrium Market Volume (K Tons) Forecast, by Application 2020 & 2033
Frequently Asked Questions
1. What is the projected Compound Annual Growth Rate (CAGR) of the Yttrium Market?
The projected CAGR is approximately 5.9%.
2. Which companies are prominent players in the Yttrium Market?
Key companies in the market include Shenzhen Chuanyan Technology Co Ltd., China Rare Earth Co Ltd., Metall Rare Earth Limited, Crossland Strategic Metals Limited, Inner Mongolia Nonferrous Mining Co Ltd., Goring Rare Earth Corporation Limited, Nippon Yttrium Co Ltd, GBM Resources Ltd, Sichuan Lanthanum Rare Materials Limited, Ganzhou Hong De New Technology Development Ltd. Co., The Nilaco Corporation, Double Park International Corporation, Zhejiang Jinda Rare-earth Element Co Ltd., Chengdu Haoxuan Technology Co. Ltd., Alkane Resources.
3. What are the main segments of the Yttrium Market?
The market segments include Product Type, Application.
4. Can you provide details about the market size?
The market size is estimated to be USD 0.09 billion as of 2022.
5. What are some drivers contributing to market growth?
Growing Demand in Electronics; Increase in Aerospace and Defense Applications.
6. What are the notable trends driving market growth?
Growing focus on recycling yttrium from end-of-life products to mitigate supply issues and environmental impact.
7. Are there any restraints impacting market growth?
Limited Supply Sources.
8. Can you provide examples of recent developments in the market?
September 2022: China Rare Earth Group Co and Jiangxi Copper Co signed a strategic cooperation agreement to promote the integration of the rare-earth industry. Rare earth (such as yttrium) is an important strategic resource and a key element in the development of high and new technology and green applications.
9. What pricing options are available for accessing the report?
Pricing options include single-user, multi-user, and enterprise licenses priced at USD 4750, USD 5250, and USD 8750 respectively.
10. Is the market size provided in terms of value or volume?
The market size is provided in terms of value, measured in billion and volume, measured in K Tons.
11. Are there any specific market keywords associated with the report?
Yes, the market keyword associated with the report is "Yttrium Market," which aids in identifying and referencing the specific market segment covered.
12. How do I determine which pricing option suits my needs best?
The pricing options vary based on user requirements and access needs. Individual users may opt for single-user licenses, while businesses requiring broader access may choose multi-user or enterprise licenses for cost-effective access to the report.
13. Are there any additional resources or data provided in the Yttrium Market report?
While the report offers comprehensive insights, it's advisable to review the specific contents or supplementary materials provided to ascertain if additional resources or data are available.
14. How can I stay updated on further developments or reports in the Yttrium Market?
To stay informed about further developments, trends, and reports in the Yttrium Market, consider subscribing to industry newsletters, following relevant companies and organizations, or regularly checking reputable industry news sources and publications.
Methodology
Step 1 - Identification of Relevant Samples Size from Population Database


Step 2 - Approaches for Defining Global Market Size (Value, Volume* & Price*)

Note*: In applicable scenarios
Step 3 - Data Sources
Primary Research
- Web Analytics
- Survey Reports
- Research Institute
- Latest Research Reports
- Opinion Leaders
Secondary Research
- Annual Reports
- White Paper
- Latest Press Release
- Industry Association
- Paid Database
- Investor Presentations

Step 4 - Data Triangulation
Involves using different sources of information in order to increase the validity of a study
These sources are likely to be stakeholders in a program - participants, other researchers, program staff, other community members, and so on.
Then we put all data in single framework & apply various statistical tools to find out the dynamic on the market.
During the analysis stage, feedback from the stakeholder groups would be compared to determine areas of agreement as well as areas of divergence