

Key Insights
The global waterproofing membrane market is poised for significant expansion, propelled by escalating infrastructure development, particularly in emerging economies, and the burgeoning construction of residential and commercial properties. Forecasted to achieve a Compound Annual Growth Rate (CAGR) of 6.7%, this market reflects substantial growth opportunities. Key drivers include the increasing adoption of sustainable and eco-friendly waterproofing solutions, advancements in membrane technology enhancing durability and longevity, and the implementation of stringent building codes mandating superior water resistance. The rising incidence of extreme weather events further amplifies the demand for effective waterproofing solutions across various sectors, with infrastructure and commercial construction emerging as primary growth catalysts. Technological innovations, encompassing cold liquid-applied, fully adhered sheet, hot liquid-applied, and loose-laid sheet membranes, are catering to diverse application needs and market segments. Despite challenges such as fluctuating raw material costs and skilled labor shortages, the market outlook remains robust, projecting sustained growth through 2033. Leading industry players are actively pursuing technological innovation and strategic collaborations to solidify their market presence and capitalize on emerging opportunities. Geographic contributions from North America, Europe, and the Asia-Pacific region underscore the widespread global demand for advanced waterproofing solutions.
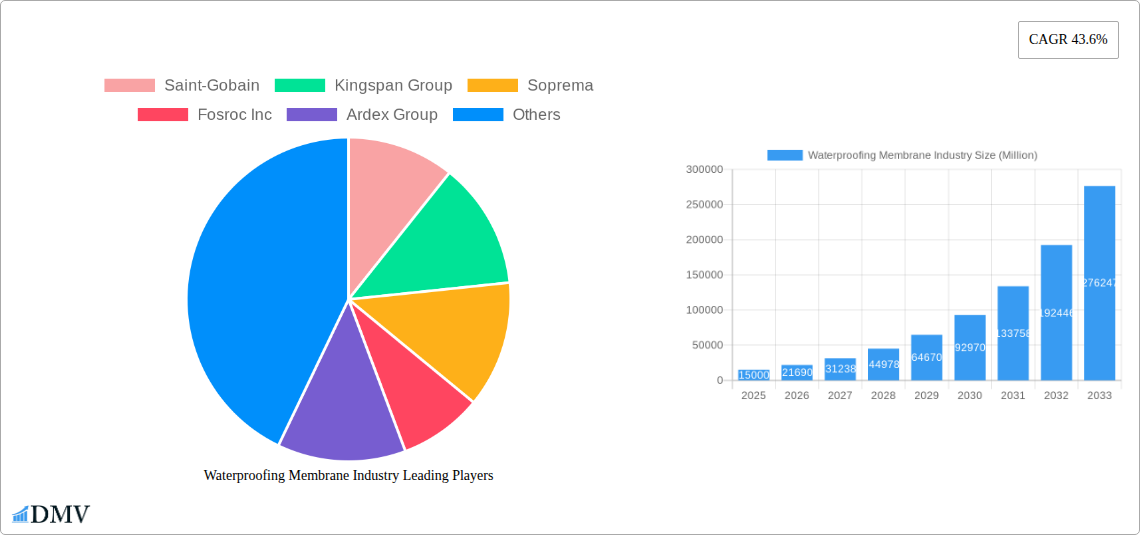
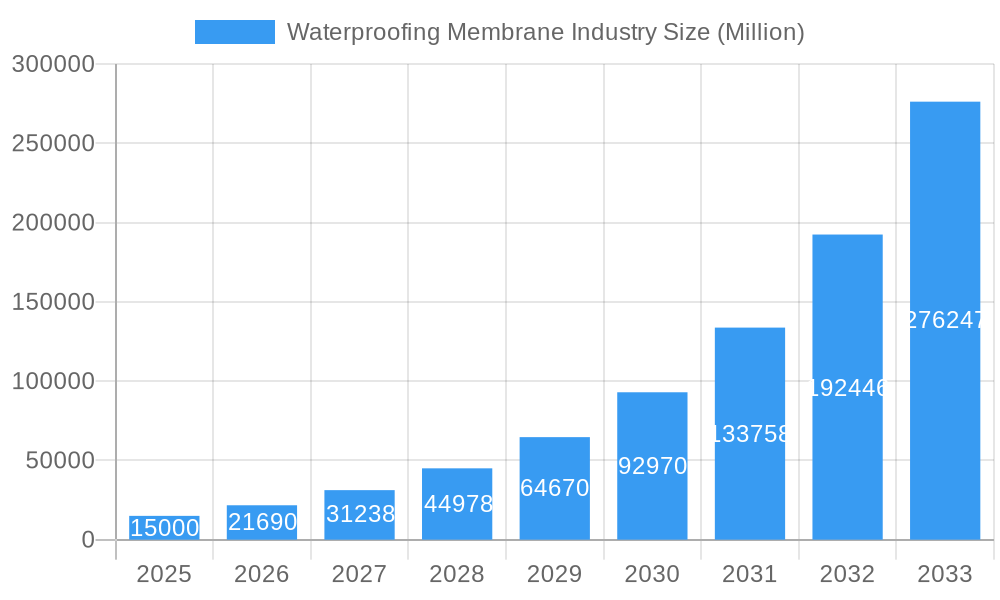
Waterproofing Membrane Industry Market Size (In Billion)
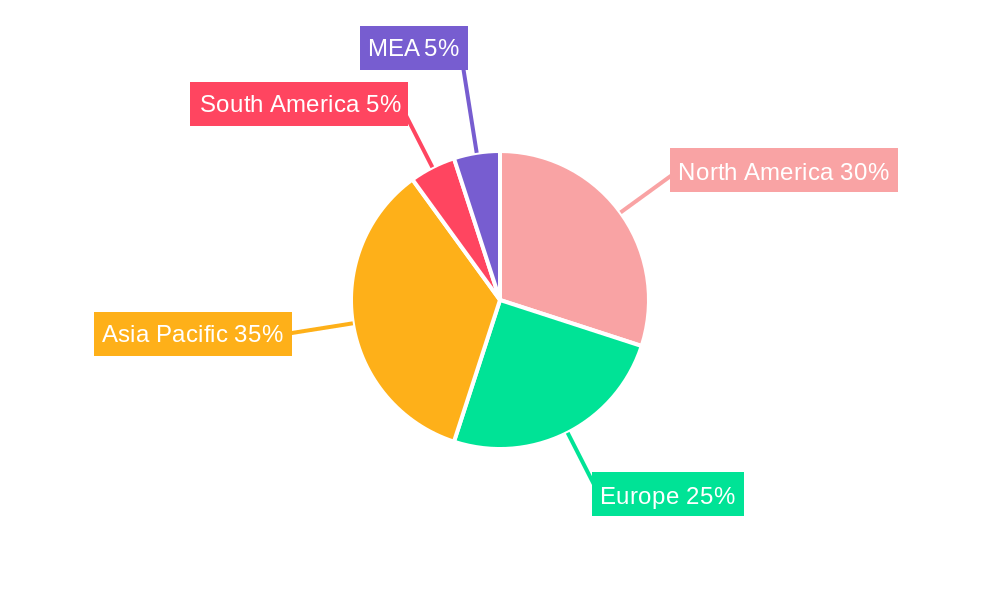
The waterproofing membrane market exhibits diverse segmentation across applications, with commercial, industrial, and institutional buildings requiring high-durability solutions, and residential projects emphasizing cost-effectiveness and ease of installation. Infrastructure projects, including bridges, tunnels, and dams, demand specialized membranes designed for unique environmental challenges. Technological segmentation highlights innovative solutions such as cold liquid-applied membranes for simplified application, fully adhered sheets for comprehensive sealing, hot liquid-applied membranes for superior adhesion, and loose-laid sheets for a balance of cost and performance. Regional market dynamics show rapid expansion in Asia-Pacific driven by urbanization and infrastructure growth, while North America and Europe maintain strong positions due to mature construction industries and high per capita construction expenditure. All regions are anticipated to experience consistent growth, fueled by both new construction and renovation initiatives, underscoring the universal need for reliable and enduring waterproofing systems.
Waterproofing Membrane Industry Company Market Share
Waterproofing Membrane Industry Market Analysis: 2025-2033
This in-depth report offers a comprehensive analysis of the global waterproofing membrane industry, providing critical insights for stakeholders. Covering the period from 2025 to 2033, with a base year of 2025, this study meticulously examines market trends, technological advancements, and competitive landscapes to support strategic decision-making. The global market size was valued at approximately $35.5 billion in 2025 and is projected to experience significant growth by 2033.
Waterproofing Membrane Industry Market Composition & Trends
The global waterproofing membrane market exhibits a moderately concentrated landscape, with key players like Saint-Gobain, Kingspan Group, Soprema, and Sika AG holding significant market shares. However, the presence of numerous regional and specialized players fosters healthy competition. Innovation is a key driver, with ongoing R&D efforts focused on enhancing durability, sustainability, and ease of application. Stringent environmental regulations, particularly concerning VOC emissions, are shaping product development and manufacturing processes. Substitute products, such as coatings and sealants, present a competitive challenge, necessitating continuous innovation and value-proposition enhancement. The market is segmented by end-use sector (commercial, industrial & institutional, infrastructure, residential) and technology (cold liquid applied, fully adhered sheet, hot liquid applied, loose-laid sheet). Mergers and acquisitions (M&A) are frequent, reflecting industry consolidation and expansion strategies. For example, Kingspan's acquisition of CaPlast in May 2023 significantly expanded its presence in the DACH region.
- Market Share Distribution (2025): Saint-Gobain (XX%), Kingspan Group (XX%), Soprema (XX%), Sika AG (XX%), Others (XX%).
- Recent M&A Activity:
- Kingspan Group's acquisition of CaPlast (May 2023) - Deal Value: $XX Million
- Sika's acquisition of MBCC Group's waterproofing solutions (May 2023) - Deal Value: $XX Million
- Oriental Yuhong's strategic cooperation with Hebei Aorun Shunda Group (May 2023) - Value: Strategic Partnership
Waterproofing Membrane Industry Industry Evolution
The waterproofing membrane market has witnessed robust growth throughout the historical period (2019-2024), driven by factors like increasing urbanization, infrastructural development, and rising construction activity globally. The market experienced a CAGR of XX% during 2019-2024. Technological advancements, such as the development of self-healing membranes and improved adhesion technologies, have significantly enhanced product performance and broadened applications. Consumer demand is shifting towards sustainable and eco-friendly options, leading manufacturers to focus on developing low-VOC and recycled-content products. The forecast period (2025-2033) anticipates continued growth, propelled by government initiatives promoting sustainable construction practices and robust economic growth in key regions. Adoption of advanced technologies like cold liquid applied membranes is increasing at a CAGR of XX% during the forecast period. The market is expected to experience growth propelled by strong government initiatives focused on sustainable construction and robust economic expansion across several key regions during the forecast period.
Leading Regions, Countries, or Segments in Waterproofing Membrane Industry
North America currently holds the leading position in the waterproofing membrane market, driven by robust construction activities and significant investments in infrastructure projects. Within the end-use sectors, the commercial and industrial segments demonstrate the highest growth, owing to the increasing demand for reliable waterproofing solutions in large-scale projects. The fully adhered sheet technology segment dominates due to its superior performance characteristics and ease of installation.
- Key Drivers for North America's Dominance:
- High construction spending.
- Extensive infrastructure development.
- Stringent building codes promoting waterproofing solutions.
- Key Drivers for Commercial & Industrial Segment Growth:
- Increased demand for durable and reliable waterproofing solutions.
- Growing focus on building longevity and reduced maintenance costs.
- Key Drivers for Fully Adhered Sheet Technology:
- Superior waterproofing performance.
- Ease of installation and reduced labor costs.
- High durability and longevity.
Waterproofing Membrane Industry Product Innovations
Recent innovations include self-healing membranes that automatically seal minor punctures, enhancing longevity and reducing maintenance needs. Advances in polymer chemistry have led to the development of more flexible and durable membranes, accommodating complex building designs. The incorporation of recycled materials is gaining traction, aligning with sustainable construction practices. These innovations are expanding the application range of waterproofing membranes to new sectors, such as green roofs and underground structures. Products are also being designed to better resist extreme weather conditions.
Propelling Factors for Waterproofing Membrane Industry Growth
Technological advancements, particularly in material science and application techniques, are driving market growth by enhancing product performance and expanding application possibilities. Strong economic growth in several key regions fuels construction activities, creating a significant demand for waterproofing solutions. Government regulations promoting energy efficiency and sustainable building practices are driving the adoption of advanced, eco-friendly waterproofing membranes. For example, incentives for green building projects are boosting demand.
Obstacles in the Waterproofing Membrane Industry Market
Fluctuations in raw material prices can significantly impact production costs and profitability. Supply chain disruptions, exacerbated by global events, can lead to delays in project completion and increased expenses. Intense competition among established players and new entrants puts pressure on pricing and profit margins. Stringent regulatory compliance requirements increase the cost of product development and manufacturing.
Future Opportunities in Waterproofing Membrane Industry
Emerging markets in developing countries offer significant growth potential due to rapid urbanization and infrastructural development. The increasing adoption of sustainable construction practices creates opportunities for eco-friendly waterproofing solutions. Advancements in nanotechnology and smart materials are likely to generate new membrane types with enhanced functionalities, such as self-cleaning and energy-harvesting capabilities.
Major Players in the Waterproofing Membrane Industry Ecosystem
- Saint-Gobain
- Kingspan Group
- Soprema
- Fosroc Inc
- Ardex Group
- MAPEI S p A
- Sika AG
- Keshun Waterproof Technology Co ltd
- Standard Industries Inc
- Oriental Yuhong
Key Developments in Waterproofing Membrane Industry Industry
- May 2023: Kingspan Group acquires CaPlast, expanding its waterproofing solutions business in the DACH region.
- May 2023: Oriental Yuhong signs a strategic cooperation agreement with Hebei Aorun Shunda Group for research collaboration in waterproofing and insulation.
- May 2023: Sika acquires MBCC Group's waterproofing solutions business, strengthening its market position.
Strategic Waterproofing Membrane Industry Market Forecast
The waterproofing membrane market is poised for significant growth in the coming years, driven by a confluence of factors including continued infrastructure development globally, rising urbanization, and the increasing adoption of sustainable building practices. The market's growth will be further fueled by technological innovations, leading to the development of more durable, efficient, and environmentally friendly waterproofing solutions. This translates into substantial market expansion and presents attractive opportunities for companies within the industry.
Waterproofing Membrane Industry Segmentation
-
1. End Use Sector
- 1.1. Commercial
- 1.2. Industrial and Institutional
- 1.3. Infrastructure
- 1.4. Residential
-
2. Technology
- 2.1. Cold Liquid Applied
- 2.2. Fully Adhered Sheet
- 2.3. Hot Liquid Applied
- 2.4. Loose Laid Sheet
Waterproofing Membrane Industry Segmentation By Geography
-
1. North America
- 1.1. United States
- 1.2. Canada
- 1.3. Mexico
-
2. South America
- 2.1. Brazil
- 2.2. Argentina
- 2.3. Rest of South America
-
3. Europe
- 3.1. United Kingdom
- 3.2. Germany
- 3.3. France
- 3.4. Italy
- 3.5. Spain
- 3.6. Russia
- 3.7. Benelux
- 3.8. Nordics
- 3.9. Rest of Europe
-
4. Middle East & Africa
- 4.1. Turkey
- 4.2. Israel
- 4.3. GCC
- 4.4. North Africa
- 4.5. South Africa
- 4.6. Rest of Middle East & Africa
-
5. Asia Pacific
- 5.1. China
- 5.2. India
- 5.3. Japan
- 5.4. South Korea
- 5.5. ASEAN
- 5.6. Oceania
- 5.7. Rest of Asia Pacific
Waterproofing Membrane Industry Regional Market Share
Geographic Coverage of Waterproofing Membrane Industry
Waterproofing Membrane Industry REPORT HIGHLIGHTS
| Aspects | Details |
|---|---|
| Study Period | 2020-2034 |
| Base Year | 2025 |
| Estimated Year | 2026 |
| Forecast Period | 2026-2034 |
| Historical Period | 2020-2025 |
| Growth Rate | CAGR of 6.7% from 2020-2034 |
| Segmentation |
|
Table of Contents
- 1. Introduction
- 1.1. Research Scope
- 1.2. Market Segmentation
- 1.3. Research Objective
- 1.4. Definitions and Assumptions
- 2. Executive Summary
- 2.1. Market Snapshot
- 3. Market Dynamics
- 3.1. Market Drivers
- 3.2. Market Restrains
- 3.3. Market Trends
- 3.4. Market Opportunities
- 4. Market Factor Analysis
- 4.1. Porters Five Forces
- 4.1.1. Bargaining Power of Suppliers
- 4.1.2. Bargaining Power of Buyers
- 4.1.3. Threat of New Entrants
- 4.1.4. Threat of Substitutes
- 4.1.5. Competitive Rivalry
- 4.2. PESTEL analysis
- 4.3. BCG Analysis
- 4.3.1. Stars (High Growth, High Market Share)
- 4.3.2. Cash Cows (Low Growth, High Market Share)
- 4.3.3. Question Mark (High Growth, Low Market Share)
- 4.3.4. Dogs (Low Growth, Low Market Share)
- 4.4. Ansoff Matrix Analysis
- 4.5. Supply Chain Analysis
- 4.6. Regulatory Landscape
- 4.7. Current Market Potential and Opportunity Assessment (TAM–SAM–SOM Framework)
- 4.8. DMV Analyst Note
- 4.1. Porters Five Forces
- 5. Market Analysis, Insights and Forecast 2021-2033
- 5.1. Market Analysis, Insights and Forecast - by End Use Sector
- 5.1.1. Commercial
- 5.1.2. Industrial and Institutional
- 5.1.3. Infrastructure
- 5.1.4. Residential
- 5.2. Market Analysis, Insights and Forecast - by Technology
- 5.2.1. Cold Liquid Applied
- 5.2.2. Fully Adhered Sheet
- 5.2.3. Hot Liquid Applied
- 5.2.4. Loose Laid Sheet
- 5.3. Market Analysis, Insights and Forecast - by Region
- 5.3.1. North America
- 5.3.2. South America
- 5.3.3. Europe
- 5.3.4. Middle East & Africa
- 5.3.5. Asia Pacific
- 5.1. Market Analysis, Insights and Forecast - by End Use Sector
- 6. Global Waterproofing Membrane Industry Analysis, Insights and Forecast, 2021-2033
- 6.1. Market Analysis, Insights and Forecast - by End Use Sector
- 6.1.1. Commercial
- 6.1.2. Industrial and Institutional
- 6.1.3. Infrastructure
- 6.1.4. Residential
- 6.2. Market Analysis, Insights and Forecast - by Technology
- 6.2.1. Cold Liquid Applied
- 6.2.2. Fully Adhered Sheet
- 6.2.3. Hot Liquid Applied
- 6.2.4. Loose Laid Sheet
- 6.1. Market Analysis, Insights and Forecast - by End Use Sector
- 7. North America Waterproofing Membrane Industry Analysis, Insights and Forecast, 2020-2032
- 7.1. Market Analysis, Insights and Forecast - by End Use Sector
- 7.1.1. Commercial
- 7.1.2. Industrial and Institutional
- 7.1.3. Infrastructure
- 7.1.4. Residential
- 7.2. Market Analysis, Insights and Forecast - by Technology
- 7.2.1. Cold Liquid Applied
- 7.2.2. Fully Adhered Sheet
- 7.2.3. Hot Liquid Applied
- 7.2.4. Loose Laid Sheet
- 7.1. Market Analysis, Insights and Forecast - by End Use Sector
- 8. South America Waterproofing Membrane Industry Analysis, Insights and Forecast, 2020-2032
- 8.1. Market Analysis, Insights and Forecast - by End Use Sector
- 8.1.1. Commercial
- 8.1.2. Industrial and Institutional
- 8.1.3. Infrastructure
- 8.1.4. Residential
- 8.2. Market Analysis, Insights and Forecast - by Technology
- 8.2.1. Cold Liquid Applied
- 8.2.2. Fully Adhered Sheet
- 8.2.3. Hot Liquid Applied
- 8.2.4. Loose Laid Sheet
- 8.1. Market Analysis, Insights and Forecast - by End Use Sector
- 9. Europe Waterproofing Membrane Industry Analysis, Insights and Forecast, 2020-2032
- 9.1. Market Analysis, Insights and Forecast - by End Use Sector
- 9.1.1. Commercial
- 9.1.2. Industrial and Institutional
- 9.1.3. Infrastructure
- 9.1.4. Residential
- 9.2. Market Analysis, Insights and Forecast - by Technology
- 9.2.1. Cold Liquid Applied
- 9.2.2. Fully Adhered Sheet
- 9.2.3. Hot Liquid Applied
- 9.2.4. Loose Laid Sheet
- 9.1. Market Analysis, Insights and Forecast - by End Use Sector
- 10. Middle East & Africa Waterproofing Membrane Industry Analysis, Insights and Forecast, 2020-2032
- 10.1. Market Analysis, Insights and Forecast - by End Use Sector
- 10.1.1. Commercial
- 10.1.2. Industrial and Institutional
- 10.1.3. Infrastructure
- 10.1.4. Residential
- 10.2. Market Analysis, Insights and Forecast - by Technology
- 10.2.1. Cold Liquid Applied
- 10.2.2. Fully Adhered Sheet
- 10.2.3. Hot Liquid Applied
- 10.2.4. Loose Laid Sheet
- 10.1. Market Analysis, Insights and Forecast - by End Use Sector
- 11. Asia Pacific Waterproofing Membrane Industry Analysis, Insights and Forecast, 2020-2032
- 11.1. Market Analysis, Insights and Forecast - by End Use Sector
- 11.1.1. Commercial
- 11.1.2. Industrial and Institutional
- 11.1.3. Infrastructure
- 11.1.4. Residential
- 11.2. Market Analysis, Insights and Forecast - by Technology
- 11.2.1. Cold Liquid Applied
- 11.2.2. Fully Adhered Sheet
- 11.2.3. Hot Liquid Applied
- 11.2.4. Loose Laid Sheet
- 11.1. Market Analysis, Insights and Forecast - by End Use Sector
- 12. Competitive Analysis
- 12.1. Company Profiles
- 12.1.1 Saint-Gobain
- 12.1.1.1. Company Overview
- 12.1.1.2. Products
- 12.1.1.3. Company Financials
- 12.1.1.4. SWOT Analysis
- 12.1.2 Kingspan Group
- 12.1.2.1. Company Overview
- 12.1.2.2. Products
- 12.1.2.3. Company Financials
- 12.1.2.4. SWOT Analysis
- 12.1.3 Soprema
- 12.1.3.1. Company Overview
- 12.1.3.2. Products
- 12.1.3.3. Company Financials
- 12.1.3.4. SWOT Analysis
- 12.1.4 Fosroc Inc
- 12.1.4.1. Company Overview
- 12.1.4.2. Products
- 12.1.4.3. Company Financials
- 12.1.4.4. SWOT Analysis
- 12.1.5 Ardex Group
- 12.1.5.1. Company Overview
- 12.1.5.2. Products
- 12.1.5.3. Company Financials
- 12.1.5.4. SWOT Analysis
- 12.1.6 MAPEI S p A
- 12.1.6.1. Company Overview
- 12.1.6.2. Products
- 12.1.6.3. Company Financials
- 12.1.6.4. SWOT Analysis
- 12.1.7 Sika AG
- 12.1.7.1. Company Overview
- 12.1.7.2. Products
- 12.1.7.3. Company Financials
- 12.1.7.4. SWOT Analysis
- 12.1.8 Keshun Waterproof Technology Co ltd
- 12.1.8.1. Company Overview
- 12.1.8.2. Products
- 12.1.8.3. Company Financials
- 12.1.8.4. SWOT Analysis
- 12.1.9 Standard Industries Inc
- 12.1.9.1. Company Overview
- 12.1.9.2. Products
- 12.1.9.3. Company Financials
- 12.1.9.4. SWOT Analysis
- 12.1.10 Oriental Yuhong
- 12.1.10.1. Company Overview
- 12.1.10.2. Products
- 12.1.10.3. Company Financials
- 12.1.10.4. SWOT Analysis
- 12.1.1 Saint-Gobain
- 12.2. Market Entropy
- 12.2.1 Company's Key Areas Served
- 12.2.2 Recent Developments
- 12.3. Company Market Share Analysis 2025
- 12.3.1 Top 5 Companies Market Share Analysis
- 12.3.2 Top 3 Companies Market Share Analysis
- 12.4. List of Potential Customers
- 13. Research Methodology
List of Figures
- Figure 1: Global Waterproofing Membrane Industry Revenue Breakdown (billion, %) by Region 2025 & 2033
- Figure 2: Global Waterproofing Membrane Industry Volume Breakdown (Square Meters, %) by Region 2025 & 2033
- Figure 3: North America Waterproofing Membrane Industry Revenue (billion), by End Use Sector 2025 & 2033
- Figure 4: North America Waterproofing Membrane Industry Volume (Square Meters), by End Use Sector 2025 & 2033
- Figure 5: North America Waterproofing Membrane Industry Revenue Share (%), by End Use Sector 2025 & 2033
- Figure 6: North America Waterproofing Membrane Industry Volume Share (%), by End Use Sector 2025 & 2033
- Figure 7: North America Waterproofing Membrane Industry Revenue (billion), by Technology 2025 & 2033
- Figure 8: North America Waterproofing Membrane Industry Volume (Square Meters), by Technology 2025 & 2033
- Figure 9: North America Waterproofing Membrane Industry Revenue Share (%), by Technology 2025 & 2033
- Figure 10: North America Waterproofing Membrane Industry Volume Share (%), by Technology 2025 & 2033
- Figure 11: North America Waterproofing Membrane Industry Revenue (billion), by Country 2025 & 2033
- Figure 12: North America Waterproofing Membrane Industry Volume (Square Meters), by Country 2025 & 2033
- Figure 13: North America Waterproofing Membrane Industry Revenue Share (%), by Country 2025 & 2033
- Figure 14: North America Waterproofing Membrane Industry Volume Share (%), by Country 2025 & 2033
- Figure 15: South America Waterproofing Membrane Industry Revenue (billion), by End Use Sector 2025 & 2033
- Figure 16: South America Waterproofing Membrane Industry Volume (Square Meters), by End Use Sector 2025 & 2033
- Figure 17: South America Waterproofing Membrane Industry Revenue Share (%), by End Use Sector 2025 & 2033
- Figure 18: South America Waterproofing Membrane Industry Volume Share (%), by End Use Sector 2025 & 2033
- Figure 19: South America Waterproofing Membrane Industry Revenue (billion), by Technology 2025 & 2033
- Figure 20: South America Waterproofing Membrane Industry Volume (Square Meters), by Technology 2025 & 2033
- Figure 21: South America Waterproofing Membrane Industry Revenue Share (%), by Technology 2025 & 2033
- Figure 22: South America Waterproofing Membrane Industry Volume Share (%), by Technology 2025 & 2033
- Figure 23: South America Waterproofing Membrane Industry Revenue (billion), by Country 2025 & 2033
- Figure 24: South America Waterproofing Membrane Industry Volume (Square Meters), by Country 2025 & 2033
- Figure 25: South America Waterproofing Membrane Industry Revenue Share (%), by Country 2025 & 2033
- Figure 26: South America Waterproofing Membrane Industry Volume Share (%), by Country 2025 & 2033
- Figure 27: Europe Waterproofing Membrane Industry Revenue (billion), by End Use Sector 2025 & 2033
- Figure 28: Europe Waterproofing Membrane Industry Volume (Square Meters), by End Use Sector 2025 & 2033
- Figure 29: Europe Waterproofing Membrane Industry Revenue Share (%), by End Use Sector 2025 & 2033
- Figure 30: Europe Waterproofing Membrane Industry Volume Share (%), by End Use Sector 2025 & 2033
- Figure 31: Europe Waterproofing Membrane Industry Revenue (billion), by Technology 2025 & 2033
- Figure 32: Europe Waterproofing Membrane Industry Volume (Square Meters), by Technology 2025 & 2033
- Figure 33: Europe Waterproofing Membrane Industry Revenue Share (%), by Technology 2025 & 2033
- Figure 34: Europe Waterproofing Membrane Industry Volume Share (%), by Technology 2025 & 2033
- Figure 35: Europe Waterproofing Membrane Industry Revenue (billion), by Country 2025 & 2033
- Figure 36: Europe Waterproofing Membrane Industry Volume (Square Meters), by Country 2025 & 2033
- Figure 37: Europe Waterproofing Membrane Industry Revenue Share (%), by Country 2025 & 2033
- Figure 38: Europe Waterproofing Membrane Industry Volume Share (%), by Country 2025 & 2033
- Figure 39: Middle East & Africa Waterproofing Membrane Industry Revenue (billion), by End Use Sector 2025 & 2033
- Figure 40: Middle East & Africa Waterproofing Membrane Industry Volume (Square Meters), by End Use Sector 2025 & 2033
- Figure 41: Middle East & Africa Waterproofing Membrane Industry Revenue Share (%), by End Use Sector 2025 & 2033
- Figure 42: Middle East & Africa Waterproofing Membrane Industry Volume Share (%), by End Use Sector 2025 & 2033
- Figure 43: Middle East & Africa Waterproofing Membrane Industry Revenue (billion), by Technology 2025 & 2033
- Figure 44: Middle East & Africa Waterproofing Membrane Industry Volume (Square Meters), by Technology 2025 & 2033
- Figure 45: Middle East & Africa Waterproofing Membrane Industry Revenue Share (%), by Technology 2025 & 2033
- Figure 46: Middle East & Africa Waterproofing Membrane Industry Volume Share (%), by Technology 2025 & 2033
- Figure 47: Middle East & Africa Waterproofing Membrane Industry Revenue (billion), by Country 2025 & 2033
- Figure 48: Middle East & Africa Waterproofing Membrane Industry Volume (Square Meters), by Country 2025 & 2033
- Figure 49: Middle East & Africa Waterproofing Membrane Industry Revenue Share (%), by Country 2025 & 2033
- Figure 50: Middle East & Africa Waterproofing Membrane Industry Volume Share (%), by Country 2025 & 2033
- Figure 51: Asia Pacific Waterproofing Membrane Industry Revenue (billion), by End Use Sector 2025 & 2033
- Figure 52: Asia Pacific Waterproofing Membrane Industry Volume (Square Meters), by End Use Sector 2025 & 2033
- Figure 53: Asia Pacific Waterproofing Membrane Industry Revenue Share (%), by End Use Sector 2025 & 2033
- Figure 54: Asia Pacific Waterproofing Membrane Industry Volume Share (%), by End Use Sector 2025 & 2033
- Figure 55: Asia Pacific Waterproofing Membrane Industry Revenue (billion), by Technology 2025 & 2033
- Figure 56: Asia Pacific Waterproofing Membrane Industry Volume (Square Meters), by Technology 2025 & 2033
- Figure 57: Asia Pacific Waterproofing Membrane Industry Revenue Share (%), by Technology 2025 & 2033
- Figure 58: Asia Pacific Waterproofing Membrane Industry Volume Share (%), by Technology 2025 & 2033
- Figure 59: Asia Pacific Waterproofing Membrane Industry Revenue (billion), by Country 2025 & 2033
- Figure 60: Asia Pacific Waterproofing Membrane Industry Volume (Square Meters), by Country 2025 & 2033
- Figure 61: Asia Pacific Waterproofing Membrane Industry Revenue Share (%), by Country 2025 & 2033
- Figure 62: Asia Pacific Waterproofing Membrane Industry Volume Share (%), by Country 2025 & 2033
List of Tables
- Table 1: Global Waterproofing Membrane Industry Revenue billion Forecast, by End Use Sector 2020 & 2033
- Table 2: Global Waterproofing Membrane Industry Volume Square Meters Forecast, by End Use Sector 2020 & 2033
- Table 3: Global Waterproofing Membrane Industry Revenue billion Forecast, by Technology 2020 & 2033
- Table 4: Global Waterproofing Membrane Industry Volume Square Meters Forecast, by Technology 2020 & 2033
- Table 5: Global Waterproofing Membrane Industry Revenue billion Forecast, by Region 2020 & 2033
- Table 6: Global Waterproofing Membrane Industry Volume Square Meters Forecast, by Region 2020 & 2033
- Table 7: Global Waterproofing Membrane Industry Revenue billion Forecast, by End Use Sector 2020 & 2033
- Table 8: Global Waterproofing Membrane Industry Volume Square Meters Forecast, by End Use Sector 2020 & 2033
- Table 9: Global Waterproofing Membrane Industry Revenue billion Forecast, by Technology 2020 & 2033
- Table 10: Global Waterproofing Membrane Industry Volume Square Meters Forecast, by Technology 2020 & 2033
- Table 11: Global Waterproofing Membrane Industry Revenue billion Forecast, by Country 2020 & 2033
- Table 12: Global Waterproofing Membrane Industry Volume Square Meters Forecast, by Country 2020 & 2033
- Table 13: United States Waterproofing Membrane Industry Revenue (billion) Forecast, by Application 2020 & 2033
- Table 14: United States Waterproofing Membrane Industry Volume (Square Meters) Forecast, by Application 2020 & 2033
- Table 15: Canada Waterproofing Membrane Industry Revenue (billion) Forecast, by Application 2020 & 2033
- Table 16: Canada Waterproofing Membrane Industry Volume (Square Meters) Forecast, by Application 2020 & 2033
- Table 17: Mexico Waterproofing Membrane Industry Revenue (billion) Forecast, by Application 2020 & 2033
- Table 18: Mexico Waterproofing Membrane Industry Volume (Square Meters) Forecast, by Application 2020 & 2033
- Table 19: Global Waterproofing Membrane Industry Revenue billion Forecast, by End Use Sector 2020 & 2033
- Table 20: Global Waterproofing Membrane Industry Volume Square Meters Forecast, by End Use Sector 2020 & 2033
- Table 21: Global Waterproofing Membrane Industry Revenue billion Forecast, by Technology 2020 & 2033
- Table 22: Global Waterproofing Membrane Industry Volume Square Meters Forecast, by Technology 2020 & 2033
- Table 23: Global Waterproofing Membrane Industry Revenue billion Forecast, by Country 2020 & 2033
- Table 24: Global Waterproofing Membrane Industry Volume Square Meters Forecast, by Country 2020 & 2033
- Table 25: Brazil Waterproofing Membrane Industry Revenue (billion) Forecast, by Application 2020 & 2033
- Table 26: Brazil Waterproofing Membrane Industry Volume (Square Meters) Forecast, by Application 2020 & 2033
- Table 27: Argentina Waterproofing Membrane Industry Revenue (billion) Forecast, by Application 2020 & 2033
- Table 28: Argentina Waterproofing Membrane Industry Volume (Square Meters) Forecast, by Application 2020 & 2033
- Table 29: Rest of South America Waterproofing Membrane Industry Revenue (billion) Forecast, by Application 2020 & 2033
- Table 30: Rest of South America Waterproofing Membrane Industry Volume (Square Meters) Forecast, by Application 2020 & 2033
- Table 31: Global Waterproofing Membrane Industry Revenue billion Forecast, by End Use Sector 2020 & 2033
- Table 32: Global Waterproofing Membrane Industry Volume Square Meters Forecast, by End Use Sector 2020 & 2033
- Table 33: Global Waterproofing Membrane Industry Revenue billion Forecast, by Technology 2020 & 2033
- Table 34: Global Waterproofing Membrane Industry Volume Square Meters Forecast, by Technology 2020 & 2033
- Table 35: Global Waterproofing Membrane Industry Revenue billion Forecast, by Country 2020 & 2033
- Table 36: Global Waterproofing Membrane Industry Volume Square Meters Forecast, by Country 2020 & 2033
- Table 37: United Kingdom Waterproofing Membrane Industry Revenue (billion) Forecast, by Application 2020 & 2033
- Table 38: United Kingdom Waterproofing Membrane Industry Volume (Square Meters) Forecast, by Application 2020 & 2033
- Table 39: Germany Waterproofing Membrane Industry Revenue (billion) Forecast, by Application 2020 & 2033
- Table 40: Germany Waterproofing Membrane Industry Volume (Square Meters) Forecast, by Application 2020 & 2033
- Table 41: France Waterproofing Membrane Industry Revenue (billion) Forecast, by Application 2020 & 2033
- Table 42: France Waterproofing Membrane Industry Volume (Square Meters) Forecast, by Application 2020 & 2033
- Table 43: Italy Waterproofing Membrane Industry Revenue (billion) Forecast, by Application 2020 & 2033
- Table 44: Italy Waterproofing Membrane Industry Volume (Square Meters) Forecast, by Application 2020 & 2033
- Table 45: Spain Waterproofing Membrane Industry Revenue (billion) Forecast, by Application 2020 & 2033
- Table 46: Spain Waterproofing Membrane Industry Volume (Square Meters) Forecast, by Application 2020 & 2033
- Table 47: Russia Waterproofing Membrane Industry Revenue (billion) Forecast, by Application 2020 & 2033
- Table 48: Russia Waterproofing Membrane Industry Volume (Square Meters) Forecast, by Application 2020 & 2033
- Table 49: Benelux Waterproofing Membrane Industry Revenue (billion) Forecast, by Application 2020 & 2033
- Table 50: Benelux Waterproofing Membrane Industry Volume (Square Meters) Forecast, by Application 2020 & 2033
- Table 51: Nordics Waterproofing Membrane Industry Revenue (billion) Forecast, by Application 2020 & 2033
- Table 52: Nordics Waterproofing Membrane Industry Volume (Square Meters) Forecast, by Application 2020 & 2033
- Table 53: Rest of Europe Waterproofing Membrane Industry Revenue (billion) Forecast, by Application 2020 & 2033
- Table 54: Rest of Europe Waterproofing Membrane Industry Volume (Square Meters) Forecast, by Application 2020 & 2033
- Table 55: Global Waterproofing Membrane Industry Revenue billion Forecast, by End Use Sector 2020 & 2033
- Table 56: Global Waterproofing Membrane Industry Volume Square Meters Forecast, by End Use Sector 2020 & 2033
- Table 57: Global Waterproofing Membrane Industry Revenue billion Forecast, by Technology 2020 & 2033
- Table 58: Global Waterproofing Membrane Industry Volume Square Meters Forecast, by Technology 2020 & 2033
- Table 59: Global Waterproofing Membrane Industry Revenue billion Forecast, by Country 2020 & 2033
- Table 60: Global Waterproofing Membrane Industry Volume Square Meters Forecast, by Country 2020 & 2033
- Table 61: Turkey Waterproofing Membrane Industry Revenue (billion) Forecast, by Application 2020 & 2033
- Table 62: Turkey Waterproofing Membrane Industry Volume (Square Meters) Forecast, by Application 2020 & 2033
- Table 63: Israel Waterproofing Membrane Industry Revenue (billion) Forecast, by Application 2020 & 2033
- Table 64: Israel Waterproofing Membrane Industry Volume (Square Meters) Forecast, by Application 2020 & 2033
- Table 65: GCC Waterproofing Membrane Industry Revenue (billion) Forecast, by Application 2020 & 2033
- Table 66: GCC Waterproofing Membrane Industry Volume (Square Meters) Forecast, by Application 2020 & 2033
- Table 67: North Africa Waterproofing Membrane Industry Revenue (billion) Forecast, by Application 2020 & 2033
- Table 68: North Africa Waterproofing Membrane Industry Volume (Square Meters) Forecast, by Application 2020 & 2033
- Table 69: South Africa Waterproofing Membrane Industry Revenue (billion) Forecast, by Application 2020 & 2033
- Table 70: South Africa Waterproofing Membrane Industry Volume (Square Meters) Forecast, by Application 2020 & 2033
- Table 71: Rest of Middle East & Africa Waterproofing Membrane Industry Revenue (billion) Forecast, by Application 2020 & 2033
- Table 72: Rest of Middle East & Africa Waterproofing Membrane Industry Volume (Square Meters) Forecast, by Application 2020 & 2033
- Table 73: Global Waterproofing Membrane Industry Revenue billion Forecast, by End Use Sector 2020 & 2033
- Table 74: Global Waterproofing Membrane Industry Volume Square Meters Forecast, by End Use Sector 2020 & 2033
- Table 75: Global Waterproofing Membrane Industry Revenue billion Forecast, by Technology 2020 & 2033
- Table 76: Global Waterproofing Membrane Industry Volume Square Meters Forecast, by Technology 2020 & 2033
- Table 77: Global Waterproofing Membrane Industry Revenue billion Forecast, by Country 2020 & 2033
- Table 78: Global Waterproofing Membrane Industry Volume Square Meters Forecast, by Country 2020 & 2033
- Table 79: China Waterproofing Membrane Industry Revenue (billion) Forecast, by Application 2020 & 2033
- Table 80: China Waterproofing Membrane Industry Volume (Square Meters) Forecast, by Application 2020 & 2033
- Table 81: India Waterproofing Membrane Industry Revenue (billion) Forecast, by Application 2020 & 2033
- Table 82: India Waterproofing Membrane Industry Volume (Square Meters) Forecast, by Application 2020 & 2033
- Table 83: Japan Waterproofing Membrane Industry Revenue (billion) Forecast, by Application 2020 & 2033
- Table 84: Japan Waterproofing Membrane Industry Volume (Square Meters) Forecast, by Application 2020 & 2033
- Table 85: South Korea Waterproofing Membrane Industry Revenue (billion) Forecast, by Application 2020 & 2033
- Table 86: South Korea Waterproofing Membrane Industry Volume (Square Meters) Forecast, by Application 2020 & 2033
- Table 87: ASEAN Waterproofing Membrane Industry Revenue (billion) Forecast, by Application 2020 & 2033
- Table 88: ASEAN Waterproofing Membrane Industry Volume (Square Meters) Forecast, by Application 2020 & 2033
- Table 89: Oceania Waterproofing Membrane Industry Revenue (billion) Forecast, by Application 2020 & 2033
- Table 90: Oceania Waterproofing Membrane Industry Volume (Square Meters) Forecast, by Application 2020 & 2033
- Table 91: Rest of Asia Pacific Waterproofing Membrane Industry Revenue (billion) Forecast, by Application 2020 & 2033
- Table 92: Rest of Asia Pacific Waterproofing Membrane Industry Volume (Square Meters) Forecast, by Application 2020 & 2033
Frequently Asked Questions
1. What is the projected Compound Annual Growth Rate (CAGR) of the Waterproofing Membrane Industry?
The projected CAGR is approximately 6.7%.
2. Which companies are prominent players in the Waterproofing Membrane Industry?
Key companies in the market include Saint-Gobain, Kingspan Group, Soprema, Fosroc Inc, Ardex Group, MAPEI S p A, Sika AG, Keshun Waterproof Technology Co ltd, Standard Industries Inc, Oriental Yuhong.
3. What are the main segments of the Waterproofing Membrane Industry?
The market segments include End Use Sector, Technology.
4. Can you provide details about the market size?
The market size is estimated to be USD 35.5 billion as of 2022.
5. What are some drivers contributing to market growth?
; Banning/ Limiting Use of Plastics used in packaging applications.
6. What are the notable trends driving market growth?
OTHER KEY INDUSTRY TRENDS COVERED IN THE REPORT.
7. Are there any restraints impacting market growth?
; Harmful Amines in Dyes; Paperless Green Initiatives.
8. Can you provide examples of recent developments in the market?
May 2023: Kingspan Group has expanded its waterproofing solutions business in the DACH region by acquiring CaPlast and its subsidiaries AerO Coated Fabrics and Now Contec from KAP AG.May 2023: Oriental Yuhong signed a strategic cooperation agreement with Hebei Aorun Shunda Group to collaborate on multi-dimensional research in the fields of waterproofing membranes, thermal insulation coatings, and other solutions.May 2023: Sika, a global leader in construction chemicals, acquired the MBCC Group, including its waterproofing solutions, anchors & grouts, flooring resins, repair & rehabilitation chemicals, and other businesses, with the exception of its concrete admixture operations in Europe, North America, Australia, and New Zealand.
9. What pricing options are available for accessing the report?
Pricing options include single-user, multi-user, and enterprise licenses priced at USD 3800, USD 4500, and USD 5800 respectively.
10. Is the market size provided in terms of value or volume?
The market size is provided in terms of value, measured in billion and volume, measured in Square Meters.
11. Are there any specific market keywords associated with the report?
Yes, the market keyword associated with the report is "Waterproofing Membrane Industry," which aids in identifying and referencing the specific market segment covered.
12. How do I determine which pricing option suits my needs best?
The pricing options vary based on user requirements and access needs. Individual users may opt for single-user licenses, while businesses requiring broader access may choose multi-user or enterprise licenses for cost-effective access to the report.
13. Are there any additional resources or data provided in the Waterproofing Membrane Industry report?
While the report offers comprehensive insights, it's advisable to review the specific contents or supplementary materials provided to ascertain if additional resources or data are available.
14. How can I stay updated on further developments or reports in the Waterproofing Membrane Industry?
To stay informed about further developments, trends, and reports in the Waterproofing Membrane Industry, consider subscribing to industry newsletters, following relevant companies and organizations, or regularly checking reputable industry news sources and publications.
Methodology
Step 1 - Identification of Relevant Samples Size from Population Database


Step 2 - Approaches for Defining Global Market Size (Value, Volume* & Price*)

Note*: In applicable scenarios
Step 3 - Data Sources
Primary Research
- Web Analytics
- Survey Reports
- Research Institute
- Latest Research Reports
- Opinion Leaders
Secondary Research
- Annual Reports
- White Paper
- Latest Press Release
- Industry Association
- Paid Database
- Investor Presentations

Step 4 - Data Triangulation
Involves using different sources of information in order to increase the validity of a study
These sources are likely to be stakeholders in a program - participants, other researchers, program staff, other community members, and so on.
Then we put all data in single framework & apply various statistical tools to find out the dynamic on the market.
During the analysis stage, feedback from the stakeholder groups would be compared to determine areas of agreement as well as areas of divergence