

Key Insights
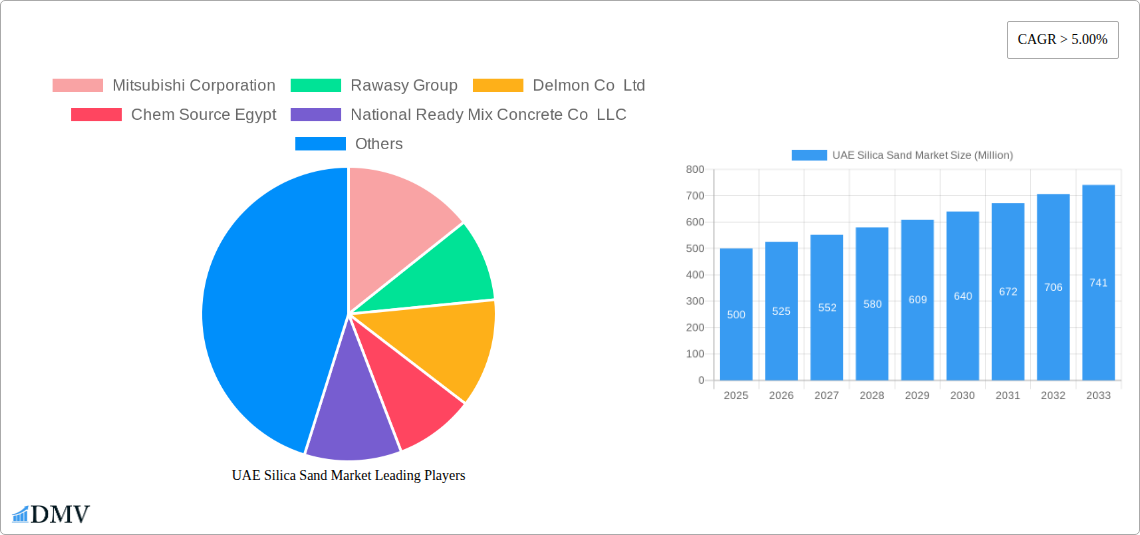
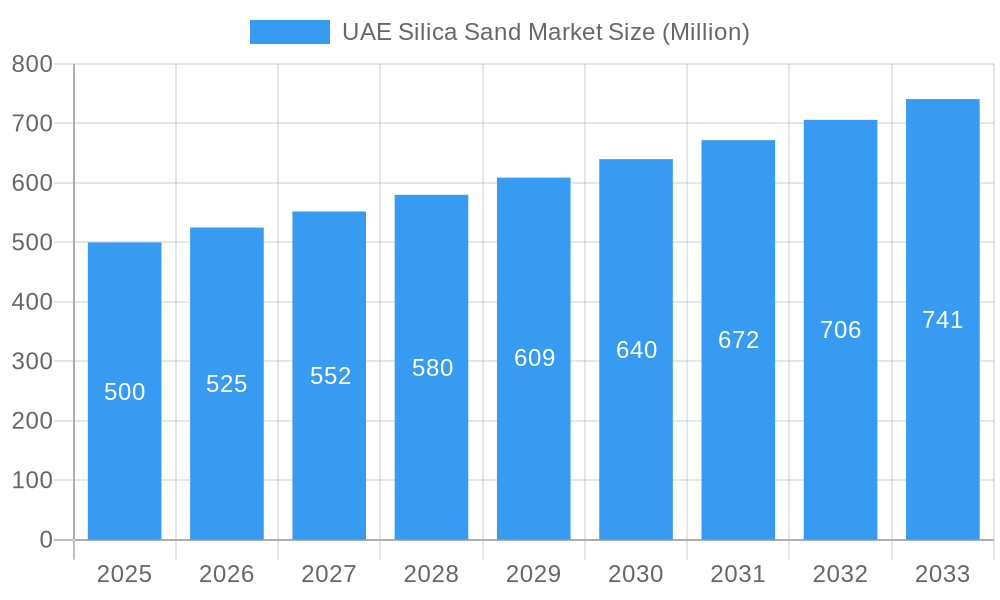
The UAE Silica Sand Market is poised for robust expansion, projected to witness a Compound Annual Growth Rate (CAGR) exceeding 5.00% over the forecast period of 2025-2033. This sustained growth is primarily fueled by the burgeoning construction sector within the UAE, driven by ambitious infrastructure development projects and a growing real estate market. The demand for high-quality silica sand, a crucial raw material in concrete, mortar, and various construction components, is therefore expected to remain exceptionally strong. Beyond construction, industries such as glass manufacturing and paints and coatings are also significant contributors to market expansion. The UAE's strategic location and its role as a regional hub for trade and industry further bolster the demand for silica sand across diverse applications.
UAE Silica Sand Market Market Size (In Million)
The market's trajectory is also shaped by critical drivers including increasing industrialization and a focus on diversifying the economy beyond oil. Furthermore, advancements in mining and processing technologies are enhancing the efficiency and quality of silica sand production, making it more accessible and competitive. However, potential restraints such as stringent environmental regulations concerning mining operations and the logistics of transportation across the vast Emirates could present challenges. Despite these hurdles, the UAE silica sand market is on a clear upward trend, with significant opportunities arising from the continuous demand for essential industrial materials and the nation's commitment to large-scale development initiatives.
UAE Silica Sand Market Company Market Share
This comprehensive report offers an in-depth analysis of the UAE Silica Sand Market, a critical component for numerous industrial applications. Spanning from 2019 to 2033, with a detailed forecast for 2025-2033 based on the 2025 estimated year, this study provides unparalleled insights into market dynamics, growth trajectories, and strategic opportunities. Investors, manufacturers, and industry stakeholders will find this report indispensable for navigating the evolving landscape of silica sand in the United Arab Emirates.
UAE Silica Sand Market Market Composition & Trends
The UAE Silica Sand Market is characterized by a dynamic competitive landscape, with key players like Mitsubishi Corporation, Rawasy Group, Delmon Co Ltd, Chem Source Egypt, National Ready Mix Concrete Co LLC, Adwan Chemical Industries Co Ltd, Cairo Minerals, Speciality Industries LLC, Gulf Minerals, and Majd Al Muayad, among others, shaping its trajectory. Market concentration is influenced by the strategic positioning of these entities and their respective market shares. Innovation catalysts are primarily driven by advancements in extraction, processing, and purification technologies aimed at meeting stringent quality standards for specialized applications. The regulatory landscape plays a crucial role, with government initiatives supporting sustainable extraction and export diversification. Substitute products, while present, generally fall short in meeting the specific performance requirements of core industries like glass manufacturing and foundry operations. End-user profiles are diverse, encompassing robust demand from the construction sector, significant consumption in chemical production, and specialized needs within filtration and oil and gas operations. Mergers and acquisitions (M&A) activities, with an estimated total deal value of XXX Million, are strategic moves aimed at consolidating market share and expanding geographical reach.
- Market Share Distribution: The market is moderately concentrated, with the top five players holding approximately XX% of the market share in the base year 2025.
- Innovation Focus: Key innovations are centered around enhancing silica purity levels and developing specialized grades for high-tech applications.
- Regulatory Impact: Environmental regulations and quality control mandates are increasingly influencing operational practices and market entry barriers.
- Substitute Material Considerations: While alternatives exist for some applications, the unique properties of high-purity silica sand limit their widespread adoption in demanding sectors.
- M&A Activity: Strategic acquisitions are anticipated to gain access to captive demand and expand processing capabilities, with a projected M&A deal value of XXX Million during the forecast period.
UAE Silica Sand Market Industry Evolution
The UAE Silica Sand Market has witnessed significant evolution driven by a confluence of factors, including sustained economic development, burgeoning construction activities, and the strategic diversification of the UAE's industrial base. Over the historical period (2019-2024), the market demonstrated a robust growth trajectory, with an average annual growth rate of XX% driven by increased demand from key end-user industries such as construction, glass manufacturing, and chemical production. The base year, 2025, serves as a crucial benchmark for understanding the current market standing, with an estimated market size of XXX Million. Looking ahead, the forecast period (2025-2033) is projected to experience a compounded annual growth rate (CAGR) of XX%, fueled by ongoing infrastructure projects, the expansion of manufacturing capabilities, and the increasing adoption of advanced silica-based materials. Technological advancements in mining and processing have been pivotal, enabling the extraction and refinement of higher purity silica sand, thus catering to more sophisticated industrial requirements. Shifting consumer demands, particularly the growing preference for sustainable construction materials and energy-efficient glass products, are also compelling manufacturers to innovate and adopt eco-friendlier practices. For instance, the adoption rate of advanced beneficiation techniques has seen a notable increase, with an estimated XX% rise in their utilization by major players during the historical period, directly impacting product quality and market competitiveness. The UAE silica sand market growth is intrinsically linked to the nation's vision for industrial self-sufficiency and its ambition to become a global hub for manufacturing and specialized industries. The market's evolution reflects a proactive approach to resource utilization and a keen understanding of global demand trends for essential industrial minerals.
Leading Regions, Countries, or Segments in UAE Silica Sand Market
Within the UAE Silica Sand Market, the dominance is clearly established by the Construction end-user industry, which consistently drives a significant portion of the market's demand. This segment's leadership is underpinned by the UAE's ambitious infrastructure development agenda, encompassing mega-projects, urban expansion, and a continuous need for high-quality construction materials like concrete, mortar, and specialized building products where silica sand is an indispensable aggregate. Investment trends within the construction sector are robust, with billions of dollars allocated annually to infrastructure and real estate development, directly translating into substantial silica sand consumption. Regulatory support for local material sourcing and the construction of resilient infrastructure further bolsters this segment.
- Construction Segment Dominance: The construction industry accounts for an estimated XX% of the total UAE silica sand market in 2025, showcasing its paramount importance.
- Key Drivers:
- Mega-Projects: Ongoing and planned mega-infrastructure projects, including new cities, transportation networks, and tourism developments.
- Urbanization: Continued population growth and urban expansion necessitating new residential and commercial buildings.
- Government Initiatives: Favorable policies promoting local content and sustainable construction practices.
- Investment Trends: Significant foreign and domestic investment in the real estate and construction sectors, projected to reach XXX Billion in the forecast period.
- Key Drivers:
Following closely, Glass Manufacturing represents another pivotal segment, consuming high-purity silica sand for the production of flat glass, container glass, and specialty glass products. The UAE's burgeoning tourism and hospitality sectors, coupled with its increasing role as a regional manufacturing hub, fuels the demand for glass. Investment in advanced glass manufacturing facilities, driven by the need for energy-efficient and aesthetically appealing products, further propels this segment's growth.
- Glass Manufacturing Segment Significance: This segment is estimated to contribute XX% to the UAE silica sand market in 2025.
- Key Drivers:
- Tourism and Hospitality: Growing demand for architectural glass in hotels, resorts, and commercial spaces.
- Consumer Goods: Increasing production of glass containers for food, beverages, and pharmaceuticals.
- Technological Advancements: Adoption of new technologies for producing specialized and high-performance glass.
- Export Potential: The UAE's strategic location facilitates the export of manufactured glass products, indirectly boosting silica sand demand.
- Key Drivers:
Chemical Production also plays a substantial role, utilizing silica sand as a key raw material in the manufacturing of sodium silicate, silicones, and other industrial chemicals. The UAE's push towards economic diversification and the development of its chemical industry create sustained demand.
- Chemical Production Segment Importance: Estimated to hold XX% of the market share in 2025.
- Key Drivers:
- Industrial Diversification: Government focus on expanding the petrochemical and downstream chemical industries.
- Product Development: Growth in the demand for silicates and silicon-based products in various applications.
- Strategic Partnerships: Collaborations with international chemical companies to establish and expand production facilities.
- Key Drivers:
The Foundry segment, while smaller in scale compared to construction and glass, remains critical for the casting of metal parts used in automotive, machinery, and industrial equipment manufacturing. Paints and Coatings and Ceramics and Refractories also represent significant, albeit niche, demand centers, relying on specific grades of silica sand for their unique properties. Filtration applications, particularly in water treatment and industrial processes, are growing, driven by environmental regulations and the need for cleaner processes. The Oil and Gas sector, though experiencing fluctuations, continues to require silica sand for certain operational needs, including fracking fluids and filtration.
UAE Silica Sand Market Product Innovations
Product innovations in the UAE Silica Sand Market are primarily focused on achieving higher purity levels and tailoring particle size distribution to meet the precise demands of specialized applications. Advancements in beneficiation and purification techniques, such as flotation and magnetic separation, are enabling the production of ultra-high purity silica sand (e.g., >99.5% SiO2) critical for electronics, solar panels, and advanced glass formulations. The development of micronized silica powders with controlled particle morphology offers enhanced performance in paints, coatings, and polymers, improving scratch resistance and UV protection. Furthermore, specialized silica grades are being engineered for use in high-performance foundry molds, enabling intricate casting with superior surface finish. The unique selling proposition lies in the ability to consistently deliver these precisely engineered silica products, thereby enhancing the efficiency and quality of downstream manufacturing processes. Technological advancements in processing are crucial for achieving these refined product specifications, ensuring the UAE remains competitive in supplying these high-value materials.
Propelling Factors for UAE Silica Sand Market Growth
The UAE Silica Sand Market is propelled by a robust combination of technological advancements, economic growth, and supportive regulatory frameworks. The nation's ambitious infrastructure development projects, requiring vast quantities of construction-grade silica sand, are a primary growth driver. Furthermore, the expansion of the UAE's manufacturing sector, particularly in glass, ceramics, and chemicals, fuels demand for high-purity silica. Technological innovations in extraction and processing are enhancing efficiency and enabling the production of specialized grades, catering to niche but high-value applications. Favorable government policies aimed at economic diversification and promoting local industries also play a crucial role. For instance, initiatives supporting the construction and manufacturing sectors directly translate into increased demand for silica sand, with an estimated XX% increase in domestic consumption driven by these policies.
Obstacles in the UAE Silica Sand Market Market
Despite its growth potential, the UAE Silica Sand Market faces several obstacles. Stringent environmental regulations, while necessary, can increase operational costs for mining and processing companies. Fluctuations in global commodity prices can impact export revenues and domestic demand. Supply chain disruptions, exacerbated by geopolitical factors or logistical challenges, can affect the timely delivery of raw materials and finished products. Intense competition from regional and international suppliers also poses a challenge, requiring continuous innovation and cost optimization to maintain market share. The need for substantial capital investment in advanced extraction and processing technologies can also be a barrier for smaller players, with an estimated capital expenditure of XXX Million required for new, state-of-the-art processing facilities.
Future Opportunities in UAE Silica Sand Market
Emerging opportunities in the UAE Silica Sand Market are abundant, driven by technological advancements and evolving industrial needs. The growing demand for high-purity silica in the electronics and semiconductor industries presents a significant avenue for growth. The expansion of renewable energy projects, particularly solar panel manufacturing, will further boost demand for specialized silica. Furthermore, the increasing focus on sustainable construction practices and the development of advanced building materials offer new markets. Investment in research and development for novel applications of silica-based materials, such as advanced composites and nanomaterials, holds immense potential. The UAE's strategic location and its ambition to become a global manufacturing hub also provide opportunities for increased exports of processed silica sand.
Major Players in the UAE Silica Sand Market Ecosystem
- Mitsubishi Corporation
- Rawasy Group
- Delmon Co Ltd
- Chem Source Egypt
- National Ready Mix Concrete Co LLC
- Adwan Chemical Industries Co Ltd
- Cairo Minerals
- Speciality Industries LLC
- Gulf Minerals
- Majd Al Muayad
Key Developments in UAE Silica Sand Market Industry
- 2023 (Q4): Rawasy Group announces expansion of its silica sand processing capacity to meet growing demand from the construction sector, investing XXX Million.
- 2024 (Q1): Mitsubishi Corporation explores strategic partnerships for high-purity silica sand extraction in the UAE, focusing on applications in electronics.
- 2024 (Q2): Delmon Co Ltd introduces a new range of processed silica sands with enhanced particle uniformity for the paint and coatings industry.
- 2024 (Q3): Chem Source Egypt establishes a new distribution hub in the UAE to streamline supply to regional glass manufacturers.
- 2024 (Q4): National Ready Mix Concrete Co LLC invests in advanced dust suppression technology for its silica sand quarrying operations, adhering to stricter environmental standards.
Strategic UAE Silica Sand Market Market Forecast
The UAE Silica Sand Market is poised for substantial growth, driven by ongoing infrastructural development and the expansion of key manufacturing sectors. The increasing demand for high-purity silica in glass manufacturing, chemical production, and emerging high-tech applications will be a significant catalyst. Strategic investments in advanced processing technologies and a focus on sustainable extraction practices will further bolster market competitiveness. The UAE's commitment to economic diversification and its strategic geographical location present considerable opportunities for increased domestic consumption and export expansion. The market forecast indicates a positive outlook, with projected growth supported by these compelling factors and the continuous evolution of end-user industry requirements.
UAE Silica Sand Market Segmentation
-
1. End-user Industry
- 1.1. Glass Manufacturing
- 1.2. Foundry
- 1.3. Chemical Production
- 1.4. Construction
- 1.5. Paints and Coatings
- 1.6. Ceramics and Refractories
- 1.7. Filtration
- 1.8. Oil and Gas
- 1.9. Other End-user Industries
UAE Silica Sand Market Segmentation By Geography
-
1. North America
- 1.1. United States
- 1.2. Canada
- 1.3. Mexico
-
2. South America
- 2.1. Brazil
- 2.2. Argentina
- 2.3. Rest of South America
-
3. Europe
- 3.1. United Kingdom
- 3.2. Germany
- 3.3. France
- 3.4. Italy
- 3.5. Spain
- 3.6. Russia
- 3.7. Benelux
- 3.8. Nordics
- 3.9. Rest of Europe
-
4. Middle East & Africa
- 4.1. Turkey
- 4.2. Israel
- 4.3. GCC
- 4.4. North Africa
- 4.5. South Africa
- 4.6. Rest of Middle East & Africa
-
5. Asia Pacific
- 5.1. China
- 5.2. India
- 5.3. Japan
- 5.4. South Korea
- 5.5. ASEAN
- 5.6. Oceania
- 5.7. Rest of Asia Pacific
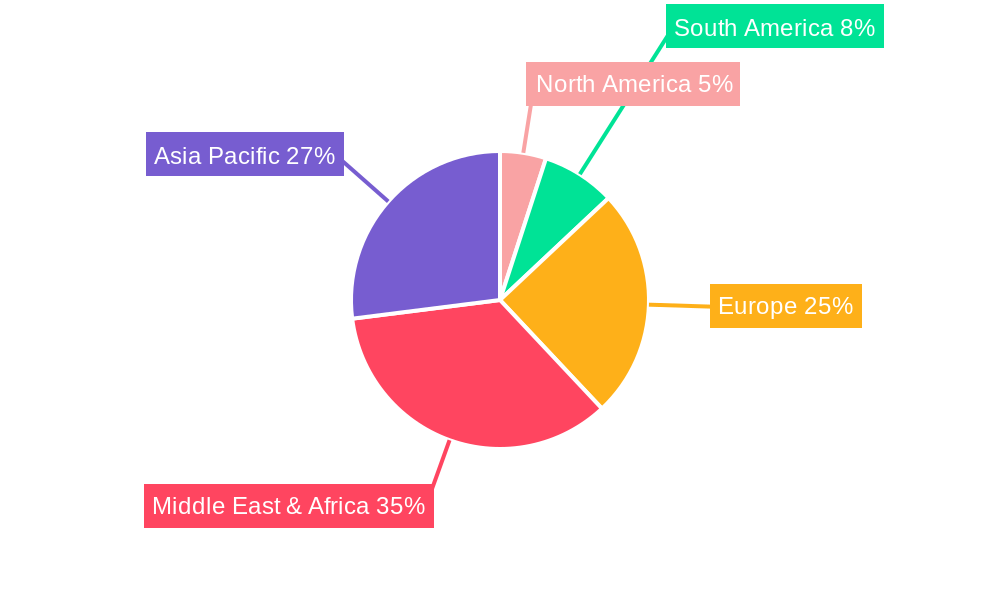
UAE Silica Sand Market Regional Market Share
Geographic Coverage of UAE Silica Sand Market
UAE Silica Sand Market REPORT HIGHLIGHTS
| Aspects | Details |
|---|---|
| Study Period | 2020-2034 |
| Base Year | 2025 |
| Estimated Year | 2026 |
| Forecast Period | 2026-2034 |
| Historical Period | 2020-2025 |
| Growth Rate | CAGR of 7.7% from 2020-2034 |
| Segmentation |
|
Table of Contents
- 1. Introduction
- 1.1. Research Scope
- 1.2. Market Segmentation
- 1.3. Research Objective
- 1.4. Definitions and Assumptions
- 2. Executive Summary
- 2.1. Market Snapshot
- 3. Market Dynamics
- 3.1. Market Drivers
- 3.2. Market Restrains
- 3.3. Market Trends
- 3.4. Market Opportunities
- 4. Market Factor Analysis
- 4.1. Porters Five Forces
- 4.1.1. Bargaining Power of Suppliers
- 4.1.2. Bargaining Power of Buyers
- 4.1.3. Threat of New Entrants
- 4.1.4. Threat of Substitutes
- 4.1.5. Competitive Rivalry
- 4.2. PESTEL analysis
- 4.3. BCG Analysis
- 4.3.1. Stars (High Growth, High Market Share)
- 4.3.2. Cash Cows (Low Growth, High Market Share)
- 4.3.3. Question Mark (High Growth, Low Market Share)
- 4.3.4. Dogs (Low Growth, Low Market Share)
- 4.4. Ansoff Matrix Analysis
- 4.5. Supply Chain Analysis
- 4.6. Regulatory Landscape
- 4.7. Current Market Potential and Opportunity Assessment (TAM–SAM–SOM Framework)
- 4.8. DMV Analyst Note
- 4.1. Porters Five Forces
- 5. Market Analysis, Insights and Forecast 2021-2033
- 5.1. Market Analysis, Insights and Forecast - by End-user Industry
- 5.1.1. Glass Manufacturing
- 5.1.2. Foundry
- 5.1.3. Chemical Production
- 5.1.4. Construction
- 5.1.5. Paints and Coatings
- 5.1.6. Ceramics and Refractories
- 5.1.7. Filtration
- 5.1.8. Oil and Gas
- 5.1.9. Other End-user Industries
- 5.2. Market Analysis, Insights and Forecast - by Region
- 5.2.1. North America
- 5.2.2. South America
- 5.2.3. Europe
- 5.2.4. Middle East & Africa
- 5.2.5. Asia Pacific
- 5.1. Market Analysis, Insights and Forecast - by End-user Industry
- 6. Global UAE Silica Sand Market Analysis, Insights and Forecast, 2021-2033
- 6.1. Market Analysis, Insights and Forecast - by End-user Industry
- 6.1.1. Glass Manufacturing
- 6.1.2. Foundry
- 6.1.3. Chemical Production
- 6.1.4. Construction
- 6.1.5. Paints and Coatings
- 6.1.6. Ceramics and Refractories
- 6.1.7. Filtration
- 6.1.8. Oil and Gas
- 6.1.9. Other End-user Industries
- 6.1. Market Analysis, Insights and Forecast - by End-user Industry
- 7. North America UAE Silica Sand Market Analysis, Insights and Forecast, 2020-2032
- 7.1. Market Analysis, Insights and Forecast - by End-user Industry
- 7.1.1. Glass Manufacturing
- 7.1.2. Foundry
- 7.1.3. Chemical Production
- 7.1.4. Construction
- 7.1.5. Paints and Coatings
- 7.1.6. Ceramics and Refractories
- 7.1.7. Filtration
- 7.1.8. Oil and Gas
- 7.1.9. Other End-user Industries
- 7.1. Market Analysis, Insights and Forecast - by End-user Industry
- 8. South America UAE Silica Sand Market Analysis, Insights and Forecast, 2020-2032
- 8.1. Market Analysis, Insights and Forecast - by End-user Industry
- 8.1.1. Glass Manufacturing
- 8.1.2. Foundry
- 8.1.3. Chemical Production
- 8.1.4. Construction
- 8.1.5. Paints and Coatings
- 8.1.6. Ceramics and Refractories
- 8.1.7. Filtration
- 8.1.8. Oil and Gas
- 8.1.9. Other End-user Industries
- 8.1. Market Analysis, Insights and Forecast - by End-user Industry
- 9. Europe UAE Silica Sand Market Analysis, Insights and Forecast, 2020-2032
- 9.1. Market Analysis, Insights and Forecast - by End-user Industry
- 9.1.1. Glass Manufacturing
- 9.1.2. Foundry
- 9.1.3. Chemical Production
- 9.1.4. Construction
- 9.1.5. Paints and Coatings
- 9.1.6. Ceramics and Refractories
- 9.1.7. Filtration
- 9.1.8. Oil and Gas
- 9.1.9. Other End-user Industries
- 9.1. Market Analysis, Insights and Forecast - by End-user Industry
- 10. Middle East & Africa UAE Silica Sand Market Analysis, Insights and Forecast, 2020-2032
- 10.1. Market Analysis, Insights and Forecast - by End-user Industry
- 10.1.1. Glass Manufacturing
- 10.1.2. Foundry
- 10.1.3. Chemical Production
- 10.1.4. Construction
- 10.1.5. Paints and Coatings
- 10.1.6. Ceramics and Refractories
- 10.1.7. Filtration
- 10.1.8. Oil and Gas
- 10.1.9. Other End-user Industries
- 10.1. Market Analysis, Insights and Forecast - by End-user Industry
- 11. Asia Pacific UAE Silica Sand Market Analysis, Insights and Forecast, 2020-2032
- 11.1. Market Analysis, Insights and Forecast - by End-user Industry
- 11.1.1. Glass Manufacturing
- 11.1.2. Foundry
- 11.1.3. Chemical Production
- 11.1.4. Construction
- 11.1.5. Paints and Coatings
- 11.1.6. Ceramics and Refractories
- 11.1.7. Filtration
- 11.1.8. Oil and Gas
- 11.1.9. Other End-user Industries
- 11.1. Market Analysis, Insights and Forecast - by End-user Industry
- 12. Competitive Analysis
- 12.1. Company Profiles
- 12.1.1 Mitsubishi Corporation
- 12.1.1.1. Company Overview
- 12.1.1.2. Products
- 12.1.1.3. Company Financials
- 12.1.1.4. SWOT Analysis
- 12.1.2 Rawasy Group
- 12.1.2.1. Company Overview
- 12.1.2.2. Products
- 12.1.2.3. Company Financials
- 12.1.2.4. SWOT Analysis
- 12.1.3 Delmon Co Ltd
- 12.1.3.1. Company Overview
- 12.1.3.2. Products
- 12.1.3.3. Company Financials
- 12.1.3.4. SWOT Analysis
- 12.1.4 Chem Source Egypt
- 12.1.4.1. Company Overview
- 12.1.4.2. Products
- 12.1.4.3. Company Financials
- 12.1.4.4. SWOT Analysis
- 12.1.5 National Ready Mix Concrete Co LLC
- 12.1.5.1. Company Overview
- 12.1.5.2. Products
- 12.1.5.3. Company Financials
- 12.1.5.4. SWOT Analysis
- 12.1.6 Adwan Chemical Industries Co Ltd
- 12.1.6.1. Company Overview
- 12.1.6.2. Products
- 12.1.6.3. Company Financials
- 12.1.6.4. SWOT Analysis
- 12.1.7 Cairo Minerals
- 12.1.7.1. Company Overview
- 12.1.7.2. Products
- 12.1.7.3. Company Financials
- 12.1.7.4. SWOT Analysis
- 12.1.8 Speciality Industries LLC*List Not Exhaustive
- 12.1.8.1. Company Overview
- 12.1.8.2. Products
- 12.1.8.3. Company Financials
- 12.1.8.4. SWOT Analysis
- 12.1.9 Gulf Minerals
- 12.1.9.1. Company Overview
- 12.1.9.2. Products
- 12.1.9.3. Company Financials
- 12.1.9.4. SWOT Analysis
- 12.1.10 Majd Al Muayad
- 12.1.10.1. Company Overview
- 12.1.10.2. Products
- 12.1.10.3. Company Financials
- 12.1.10.4. SWOT Analysis
- 12.1.1 Mitsubishi Corporation
- 12.2. Market Entropy
- 12.2.1 Company's Key Areas Served
- 12.2.2 Recent Developments
- 12.3. Company Market Share Analysis 2025
- 12.3.1 Top 5 Companies Market Share Analysis
- 12.3.2 Top 3 Companies Market Share Analysis
- 12.4. List of Potential Customers
- 13. Research Methodology
List of Figures
- Figure 1: Global UAE Silica Sand Market Revenue Breakdown (billion, %) by Region 2025 & 2033
- Figure 2: North America UAE Silica Sand Market Revenue (billion), by End-user Industry 2025 & 2033
- Figure 3: North America UAE Silica Sand Market Revenue Share (%), by End-user Industry 2025 & 2033
- Figure 4: North America UAE Silica Sand Market Revenue (billion), by Country 2025 & 2033
- Figure 5: North America UAE Silica Sand Market Revenue Share (%), by Country 2025 & 2033
- Figure 6: South America UAE Silica Sand Market Revenue (billion), by End-user Industry 2025 & 2033
- Figure 7: South America UAE Silica Sand Market Revenue Share (%), by End-user Industry 2025 & 2033
- Figure 8: South America UAE Silica Sand Market Revenue (billion), by Country 2025 & 2033
- Figure 9: South America UAE Silica Sand Market Revenue Share (%), by Country 2025 & 2033
- Figure 10: Europe UAE Silica Sand Market Revenue (billion), by End-user Industry 2025 & 2033
- Figure 11: Europe UAE Silica Sand Market Revenue Share (%), by End-user Industry 2025 & 2033
- Figure 12: Europe UAE Silica Sand Market Revenue (billion), by Country 2025 & 2033
- Figure 13: Europe UAE Silica Sand Market Revenue Share (%), by Country 2025 & 2033
- Figure 14: Middle East & Africa UAE Silica Sand Market Revenue (billion), by End-user Industry 2025 & 2033
- Figure 15: Middle East & Africa UAE Silica Sand Market Revenue Share (%), by End-user Industry 2025 & 2033
- Figure 16: Middle East & Africa UAE Silica Sand Market Revenue (billion), by Country 2025 & 2033
- Figure 17: Middle East & Africa UAE Silica Sand Market Revenue Share (%), by Country 2025 & 2033
- Figure 18: Asia Pacific UAE Silica Sand Market Revenue (billion), by End-user Industry 2025 & 2033
- Figure 19: Asia Pacific UAE Silica Sand Market Revenue Share (%), by End-user Industry 2025 & 2033
- Figure 20: Asia Pacific UAE Silica Sand Market Revenue (billion), by Country 2025 & 2033
- Figure 21: Asia Pacific UAE Silica Sand Market Revenue Share (%), by Country 2025 & 2033
List of Tables
- Table 1: Global UAE Silica Sand Market Revenue billion Forecast, by End-user Industry 2020 & 2033
- Table 2: Global UAE Silica Sand Market Revenue billion Forecast, by Region 2020 & 2033
- Table 3: Global UAE Silica Sand Market Revenue billion Forecast, by End-user Industry 2020 & 2033
- Table 4: Global UAE Silica Sand Market Revenue billion Forecast, by Country 2020 & 2033
- Table 5: United States UAE Silica Sand Market Revenue (billion) Forecast, by Application 2020 & 2033
- Table 6: Canada UAE Silica Sand Market Revenue (billion) Forecast, by Application 2020 & 2033
- Table 7: Mexico UAE Silica Sand Market Revenue (billion) Forecast, by Application 2020 & 2033
- Table 8: Global UAE Silica Sand Market Revenue billion Forecast, by End-user Industry 2020 & 2033
- Table 9: Global UAE Silica Sand Market Revenue billion Forecast, by Country 2020 & 2033
- Table 10: Brazil UAE Silica Sand Market Revenue (billion) Forecast, by Application 2020 & 2033
- Table 11: Argentina UAE Silica Sand Market Revenue (billion) Forecast, by Application 2020 & 2033
- Table 12: Rest of South America UAE Silica Sand Market Revenue (billion) Forecast, by Application 2020 & 2033
- Table 13: Global UAE Silica Sand Market Revenue billion Forecast, by End-user Industry 2020 & 2033
- Table 14: Global UAE Silica Sand Market Revenue billion Forecast, by Country 2020 & 2033
- Table 15: United Kingdom UAE Silica Sand Market Revenue (billion) Forecast, by Application 2020 & 2033
- Table 16: Germany UAE Silica Sand Market Revenue (billion) Forecast, by Application 2020 & 2033
- Table 17: France UAE Silica Sand Market Revenue (billion) Forecast, by Application 2020 & 2033
- Table 18: Italy UAE Silica Sand Market Revenue (billion) Forecast, by Application 2020 & 2033
- Table 19: Spain UAE Silica Sand Market Revenue (billion) Forecast, by Application 2020 & 2033
- Table 20: Russia UAE Silica Sand Market Revenue (billion) Forecast, by Application 2020 & 2033
- Table 21: Benelux UAE Silica Sand Market Revenue (billion) Forecast, by Application 2020 & 2033
- Table 22: Nordics UAE Silica Sand Market Revenue (billion) Forecast, by Application 2020 & 2033
- Table 23: Rest of Europe UAE Silica Sand Market Revenue (billion) Forecast, by Application 2020 & 2033
- Table 24: Global UAE Silica Sand Market Revenue billion Forecast, by End-user Industry 2020 & 2033
- Table 25: Global UAE Silica Sand Market Revenue billion Forecast, by Country 2020 & 2033
- Table 26: Turkey UAE Silica Sand Market Revenue (billion) Forecast, by Application 2020 & 2033
- Table 27: Israel UAE Silica Sand Market Revenue (billion) Forecast, by Application 2020 & 2033
- Table 28: GCC UAE Silica Sand Market Revenue (billion) Forecast, by Application 2020 & 2033
- Table 29: North Africa UAE Silica Sand Market Revenue (billion) Forecast, by Application 2020 & 2033
- Table 30: South Africa UAE Silica Sand Market Revenue (billion) Forecast, by Application 2020 & 2033
- Table 31: Rest of Middle East & Africa UAE Silica Sand Market Revenue (billion) Forecast, by Application 2020 & 2033
- Table 32: Global UAE Silica Sand Market Revenue billion Forecast, by End-user Industry 2020 & 2033
- Table 33: Global UAE Silica Sand Market Revenue billion Forecast, by Country 2020 & 2033
- Table 34: China UAE Silica Sand Market Revenue (billion) Forecast, by Application 2020 & 2033
- Table 35: India UAE Silica Sand Market Revenue (billion) Forecast, by Application 2020 & 2033
- Table 36: Japan UAE Silica Sand Market Revenue (billion) Forecast, by Application 2020 & 2033
- Table 37: South Korea UAE Silica Sand Market Revenue (billion) Forecast, by Application 2020 & 2033
- Table 38: ASEAN UAE Silica Sand Market Revenue (billion) Forecast, by Application 2020 & 2033
- Table 39: Oceania UAE Silica Sand Market Revenue (billion) Forecast, by Application 2020 & 2033
- Table 40: Rest of Asia Pacific UAE Silica Sand Market Revenue (billion) Forecast, by Application 2020 & 2033
Frequently Asked Questions
1. What is the projected Compound Annual Growth Rate (CAGR) of the UAE Silica Sand Market?
The projected CAGR is approximately 7.7%.
2. Which companies are prominent players in the UAE Silica Sand Market?
Key companies in the market include Mitsubishi Corporation, Rawasy Group, Delmon Co Ltd, Chem Source Egypt, National Ready Mix Concrete Co LLC, Adwan Chemical Industries Co Ltd, Cairo Minerals, Speciality Industries LLC*List Not Exhaustive, Gulf Minerals, Majd Al Muayad.
3. What are the main segments of the UAE Silica Sand Market?
The market segments include End-user Industry.
4. Can you provide details about the market size?
The market size is estimated to be USD 14.1 billion as of 2022.
5. What are some drivers contributing to market growth?
Growing Land Reclamation Projects Across the Region.
6. What are the notable trends driving market growth?
Growing Land Reclamation to Drive Demand for Silica Sand.
7. Are there any restraints impacting market growth?
Competition from Various Substitutes; Development of Sand-Free Construction Products.
8. Can you provide examples of recent developments in the market?
N/A
9. What pricing options are available for accessing the report?
Pricing options include single-user, multi-user, and enterprise licenses priced at USD 3800, USD 4500, and USD 5800 respectively.
10. Is the market size provided in terms of value or volume?
The market size is provided in terms of value, measured in billion.
11. Are there any specific market keywords associated with the report?
Yes, the market keyword associated with the report is "UAE Silica Sand Market," which aids in identifying and referencing the specific market segment covered.
12. How do I determine which pricing option suits my needs best?
The pricing options vary based on user requirements and access needs. Individual users may opt for single-user licenses, while businesses requiring broader access may choose multi-user or enterprise licenses for cost-effective access to the report.
13. Are there any additional resources or data provided in the UAE Silica Sand Market report?
While the report offers comprehensive insights, it's advisable to review the specific contents or supplementary materials provided to ascertain if additional resources or data are available.
14. How can I stay updated on further developments or reports in the UAE Silica Sand Market?
To stay informed about further developments, trends, and reports in the UAE Silica Sand Market, consider subscribing to industry newsletters, following relevant companies and organizations, or regularly checking reputable industry news sources and publications.
Methodology
Step 1 - Identification of Relevant Samples Size from Population Database


Step 2 - Approaches for Defining Global Market Size (Value, Volume* & Price*)

Note*: In applicable scenarios
Step 3 - Data Sources
Primary Research
- Web Analytics
- Survey Reports
- Research Institute
- Latest Research Reports
- Opinion Leaders
Secondary Research
- Annual Reports
- White Paper
- Latest Press Release
- Industry Association
- Paid Database
- Investor Presentations

Step 4 - Data Triangulation
Involves using different sources of information in order to increase the validity of a study
These sources are likely to be stakeholders in a program - participants, other researchers, program staff, other community members, and so on.
Then we put all data in single framework & apply various statistical tools to find out the dynamic on the market.
During the analysis stage, feedback from the stakeholder groups would be compared to determine areas of agreement as well as areas of divergence