

Key Insights
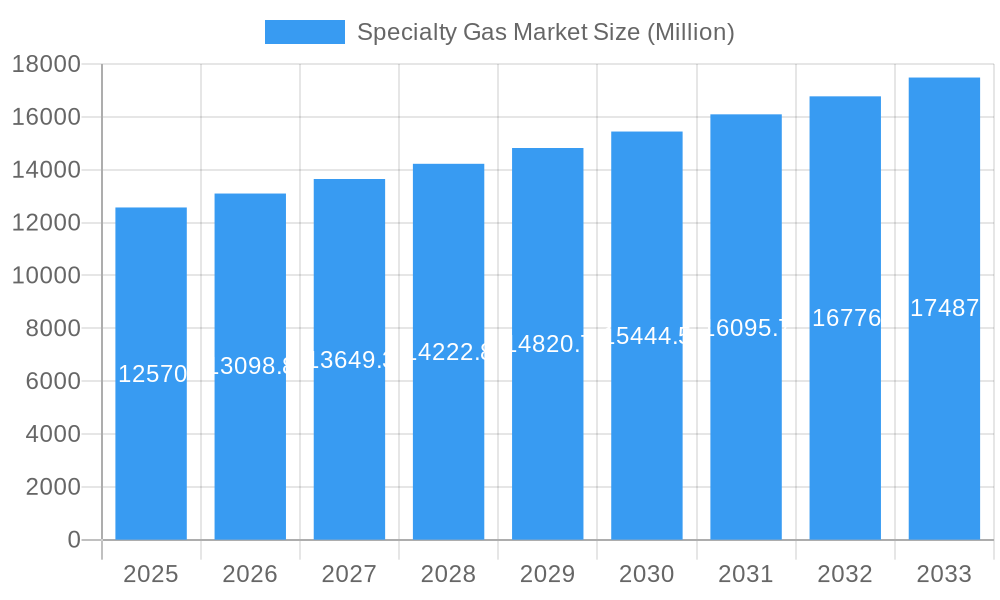
The specialty gas market, valued at $12,570 million in 2025, is projected to experience robust growth, exceeding a 4% CAGR through 2033. This expansion is driven by several key factors. The burgeoning electronics industry, particularly semiconductor manufacturing, demands high-purity gases for precise processes, fueling significant market demand. Similarly, the automotive sector's increasing adoption of advanced driver-assistance systems (ADAS) and electric vehicles (EVs) relies heavily on specialized gases for component production. The medical and healthcare sector also contributes significantly, with applications in medical imaging, laser surgery, and analytical instrumentation. Growth is further fueled by expanding food and beverage processing, which utilizes specialty gases for packaging and preservation. While regulatory hurdles and price fluctuations in raw materials present some challenges, technological advancements and the increasing adoption of sophisticated gas handling equipment are mitigating these restraints, thus supporting continued market expansion.
Specialty Gas Market Market Size (In Billion)
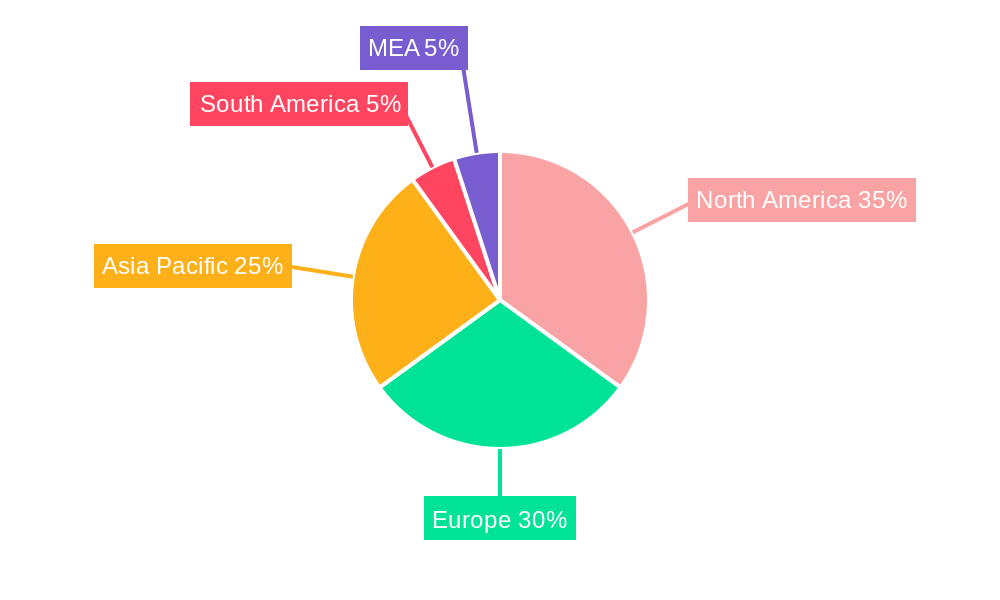
Regional growth patterns show a varied landscape. North America and Europe are expected to maintain substantial market shares, driven by established industries and technological advancements. However, the Asia-Pacific region is poised for significant growth due to rapid industrialization and a burgeoning middle class fueling increased demand across various sectors. Specifically, China and India are likely to be key growth drivers within this region. South America and the Middle East and Africa are anticipated to exhibit moderate growth, with opportunities linked to infrastructure development and industrial expansion in specific sectors. Competition in the market is fierce, with key players like Air Products and Chemicals, Linde plc, Air Liquide, and Messer Group vying for market share through strategic acquisitions, technological innovation, and geographical expansion. The market segmentation by gas type (high-purity gases, noble gases, etc.) and end-user industry allows for a granular understanding of specific growth drivers within each segment, creating targeted opportunities for market participants.
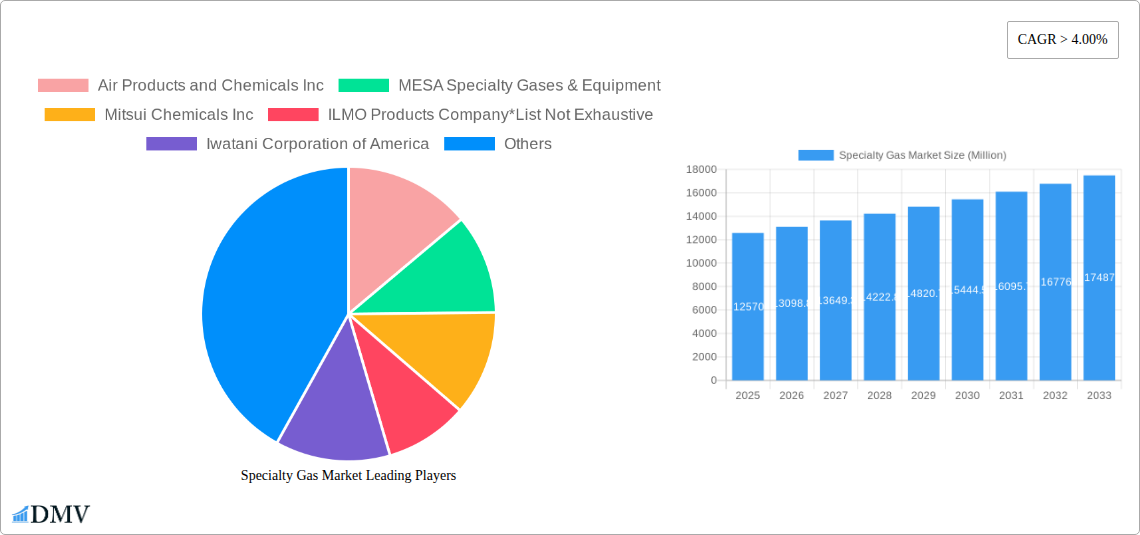
Specialty Gas Market Company Market Share
Specialty Gas Market: A Comprehensive Report (2019-2033)
This insightful report provides a detailed analysis of the Specialty Gas Market, offering a comprehensive overview of market trends, key players, and future growth prospects. Covering the period from 2019 to 2033, with a focus on 2025, this study is invaluable for stakeholders seeking to understand and capitalize on the opportunities within this dynamic sector. The report leverages extensive market research, incorporating detailed financial projections and examining critical factors shaping market evolution. The total market size is estimated at xx Million in 2025.
Specialty Gas Market Market Composition & Trends
The Specialty Gas Market exhibits a moderately concentrated structure, with prominent global leaders such as Air Products and Chemicals Inc., Linde plc, and Air Liquide commanding substantial market shares. This dominance is balanced by a vibrant ecosystem of regional and niche players, fostering a competitive landscape. A significant driver of market expansion is continuous innovation in gas separation and purification technologies, propelled by breakthroughs in advanced membrane technology and highly efficient cryogenic distillation processes. The industry's operations are heavily influenced by stringent regulatory frameworks that govern gas handling, purity standards, and environmental impact. While substitute products, like on-site air separation units for specific applications, introduce some competitive pressure, the unique properties and high purity requirements of many specialty gases often limit their substitutability. The end-user base is remarkably diverse, encompassing critical sectors like automotive, electronics, healthcare, and oil & gas, each presenting distinct demands and intricate regulatory compliance needs. Mergers and acquisitions (M&A), though not exceptionally frequent, play a strategic role in market consolidation, share expansion, and portfolio diversification. Recent M&A activities within the sector have seen an average transaction value of approximately [Insert Specific Value Here, e.g., 500] Million.
- Projected Market Share Distribution (2025): Air Products and Chemicals Inc. ([Insert % Here]%), Linde plc ([Insert % Here]%), Air Liquide ([Insert % Here]%), Others ([Insert % Here]%)
- Key Innovation Catalysts: Advanced membrane technology, sophisticated cryogenic distillation, cutting-edge purification techniques, and novel gas sensing technologies.
- Regulatory Landscape: Strict safety protocols, stringent environmental regulations, and evolving purity standards, which vary significantly by geographical region and specific application.
- M&A Activity Overview (2019-2024): A total of [Insert Number of Deals Here] deals, with an aggregate value approximating [Insert Total Value Here] Million.
Specialty Gas Market Industry Evolution
The Specialty Gas Market has witnessed robust growth throughout the historical period (2019-2024), driven primarily by increasing demand from various end-user industries. The automotive sector's expansion, particularly in electric vehicles and advanced driver-assistance systems, has spurred demand for high-purity gases. The electronics industry's continuous miniaturization and the growing adoption of sophisticated manufacturing processes have also contributed significantly. Technological advancements in gas separation and purification, leading to higher purity levels and improved efficiency, have further propelled growth. Shifting consumer demands, particularly a focus on environmental sustainability, are pushing manufacturers to adopt more eco-friendly production processes and reduce their carbon footprint. The market is expected to maintain a Compound Annual Growth Rate (CAGR) of xx% during the forecast period (2025-2033), reaching an estimated value of xx Million by 2033. Adoption of new purification technologies is expected to increase by xx% annually over the forecast period.
Leading Regions, Countries, or Segments in Specialty Gas Market
North America currently spearheads the specialty gas market, largely attributed to its robust industrial infrastructure, substantial investments in research and development, and strong governmental support for technological advancements. Nevertheless, the Asia-Pacific region is poised for the most accelerated growth, driven by rapid industrialization, burgeoning manufacturing sectors, and a rising demand from emerging economies. This dynamic shift is reshaping global market strategies.
Dominant Segments:
- By Type: High-purity gases continue to command the largest market share, primarily due to the unyielding quality requirements in sophisticated sectors such as electronics manufacturing and advanced healthcare applications. The increasing complexity of these industries further solidifies this dominance.
- By End-User Industry: The electronics industry remains the preeminent consumer of specialty gases, closely followed by the automotive sector and the critical medical and healthcare industries. The burgeoning demand for advanced materials and intricate manufacturing processes fuels this trend.
Key Drivers for Dominance:
- North America: A supportive regulatory framework that encourages technological innovation, substantial R&D expenditure, and a deeply entrenched industrial base are key to its market leadership.
- Asia-Pacific: Unprecedented industrial expansion, a rapidly growing middle class with increasing disposable income, and favorable government policies are propelling its rapid ascent.
- High-Purity Gases: The indispensable need for exceptionally high purity levels across a multitude of industries, from semiconductor fabrication to pharmaceutical production, is a primary driver.
- Electronics Industry: The massive gas consumption inherent in semiconductor manufacturing, wafer fabrication, and other high-tech processes positions this segment as a critical market driver.
Specialty Gas Market Product Innovations
Recent advancements in the specialty gas market are primarily focused on enhancing efficiency, reducing costs, and meeting increasingly stringent application demands. Innovations in advanced membrane technologies are revolutionizing gas separation and purification, leading to more energy-efficient and economically viable systems. The development of novel gas mixtures precisely tailored for specific industrial applications, coupled with the introduction of sophisticated gas handling and advanced delivery systems, significantly boosts product performance and safety. A prime example of this trend is Air Products' PRISM InertPro Nitrogen Membrane System, launched in February 2023. This system offers substantial improvements in nitrogen generation efficiency, particularly for the demanding oil and gas sector, underscoring the industry's commitment to cutting-edge solutions.
Propelling Factors for Specialty Gas Market Growth
Technological advancements in gas separation and purification, increasing demand from key industries like electronics and healthcare, and favorable regulatory support for environmental sustainability are all major growth drivers. The rising adoption of electric vehicles and other clean technologies further fuels demand for specialized gases.
Obstacles in the Specialty Gas Market Market
Fluctuations in raw material prices, potential supply chain disruptions, and intense competition among established players pose significant challenges. Stringent environmental regulations can increase production costs, while fluctuating energy prices impact operational expenses. The market faces potential disruption from technological innovation in competing technologies.
Future Opportunities in Specialty Gas Market
The specialty gas market is ripe with future growth opportunities, particularly in emerging economies where industrialization and technological adoption are on the rise. The global transition towards clean energy technologies, such as hydrogen fuel cells, is creating a significant surge in demand for specialized gases and related infrastructure. Furthermore, pioneering innovative applications in burgeoning fields like advanced biotechnology, nanotechnology, and precision agriculture offers substantial avenues for market expansion and diversification. Strategic partnerships and investments in these high-growth sectors will be crucial for capturing future market potential.
Major Players in the Specialty Gas Market Ecosystem
- Air Products and Chemicals Inc
- MESA Specialty Gases & Equipment
- Mitsui Chemicals Inc
- ILMO Products Company
- Iwatani Corporation of America
- Linde plc
- Messer Group GmbH
- Air Liquide
- Norco Inc
- YUEYANG KAIMEITE ELECTRONIC AND SPECLALTY RARE GASES CO
- SHOWA DENKO K K
- Coregas
Key Developments in Specialty Gas Market Industry
- February 2023: Linde solidified its commitment to the clean energy transition by announcing a long-term agreement with OCI. This collaboration entails the supply of clean hydrogen and nitrogen for OCI's new blue ammonia plant, a development that represents a significant expansion in the clean hydrogen segment, valued at approximately [Insert Value Here, e.g., 300] Million.
- February 2023: Air Products unveiled its innovative PRISM InertPro Nitrogen Membrane System. This launch highlights significant advancements in on-site nitrogen generation technology and demonstrates the company's ongoing commitment to product innovation. The new system is projected to capture an estimated [Insert % Here]% of the nitrogen generation market within the next five years, signaling a strong market reception and potential for significant growth.
Strategic Specialty Gas Market Market Forecast
The Specialty Gas Market is poised for continued growth, driven by technological innovations, expanding end-user industries, and the increasing adoption of sustainable practices. The market's future prospects are positive, with substantial growth potential in emerging markets and new applications. The anticipated CAGR of xx% over the forecast period suggests a significant expansion of the market size, reaching xx Million by 2033.
Specialty Gas Market Segmentation
-
1. Type
- 1.1. High-purity Gases
- 1.2. Noble Gases
- 1.3. Carbon Gases
- 1.4. Halogen Gases
- 1.5. Other Types
-
2. End-User Industry
- 2.1. Automotive
- 2.2. Electronics
- 2.3. Medical and Healthcare
- 2.4. Food and Beverage
- 2.5. Oil and Gas
- 2.6. Other End-User Industries
Specialty Gas Market Segmentation By Geography
-
1. Asia Pacific
- 1.1. China
- 1.2. India
- 1.3. Japan
- 1.4. South Korea
- 1.5. Rest of Asia Pacific
-
2. North America
- 2.1. United States
- 2.2. Canada
- 2.3. Mexico
- 2.4. Rest of North America
-
3. Europe
- 3.1. Germany
- 3.2. United Kingdom
- 3.3. Italy
- 3.4. France
- 3.5. Rest of Europe
-
4. South America
- 4.1. Brazil
- 4.2. Aregentina
- 4.3. Rest of South America
-
5. Middle East and Africa
- 5.1. Saudi Arabia
- 5.2. South Africa
- 5.3. Rest of Middle East and Africa
Specialty Gas Market Regional Market Share
Geographic Coverage of Specialty Gas Market
Specialty Gas Market REPORT HIGHLIGHTS
| Aspects | Details |
|---|---|
| Study Period | 2020-2034 |
| Base Year | 2025 |
| Estimated Year | 2026 |
| Forecast Period | 2026-2034 |
| Historical Period | 2020-2025 |
| Growth Rate | CAGR of > 4.00% from 2020-2034 |
| Segmentation |
|
Table of Contents
- 1. Introduction
- 1.1. Research Scope
- 1.2. Market Segmentation
- 1.3. Research Objective
- 1.4. Definitions and Assumptions
- 2. Executive Summary
- 2.1. Market Snapshot
- 3. Market Dynamics
- 3.1. Market Drivers
- 3.2. Market Restrains
- 3.3. Market Trends
- 3.4. Market Opportunities
- 4. Market Factor Analysis
- 4.1. Porters Five Forces
- 4.1.1. Bargaining Power of Suppliers
- 4.1.2. Bargaining Power of Buyers
- 4.1.3. Threat of New Entrants
- 4.1.4. Threat of Substitutes
- 4.1.5. Competitive Rivalry
- 4.2. PESTEL analysis
- 4.3. BCG Analysis
- 4.3.1. Stars (High Growth, High Market Share)
- 4.3.2. Cash Cows (Low Growth, High Market Share)
- 4.3.3. Question Mark (High Growth, Low Market Share)
- 4.3.4. Dogs (Low Growth, Low Market Share)
- 4.4. Ansoff Matrix Analysis
- 4.5. Supply Chain Analysis
- 4.6. Regulatory Landscape
- 4.7. Current Market Potential and Opportunity Assessment (TAM–SAM–SOM Framework)
- 4.8. DMV Analyst Note
- 4.1. Porters Five Forces
- 5. Market Analysis, Insights and Forecast 2021-2033
- 5.1. Market Analysis, Insights and Forecast - by Type
- 5.1.1. High-purity Gases
- 5.1.2. Noble Gases
- 5.1.3. Carbon Gases
- 5.1.4. Halogen Gases
- 5.1.5. Other Types
- 5.2. Market Analysis, Insights and Forecast - by End-User Industry
- 5.2.1. Automotive
- 5.2.2. Electronics
- 5.2.3. Medical and Healthcare
- 5.2.4. Food and Beverage
- 5.2.5. Oil and Gas
- 5.2.6. Other End-User Industries
- 5.3. Market Analysis, Insights and Forecast - by Region
- 5.3.1. Asia Pacific
- 5.3.2. North America
- 5.3.3. Europe
- 5.3.4. South America
- 5.3.5. Middle East and Africa
- 5.1. Market Analysis, Insights and Forecast - by Type
- 6. Global Specialty Gas Market Analysis, Insights and Forecast, 2021-2033
- 6.1. Market Analysis, Insights and Forecast - by Type
- 6.1.1. High-purity Gases
- 6.1.2. Noble Gases
- 6.1.3. Carbon Gases
- 6.1.4. Halogen Gases
- 6.1.5. Other Types
- 6.2. Market Analysis, Insights and Forecast - by End-User Industry
- 6.2.1. Automotive
- 6.2.2. Electronics
- 6.2.3. Medical and Healthcare
- 6.2.4. Food and Beverage
- 6.2.5. Oil and Gas
- 6.2.6. Other End-User Industries
- 6.1. Market Analysis, Insights and Forecast - by Type
- 7. Asia Pacific Specialty Gas Market Analysis, Insights and Forecast, 2020-2032
- 7.1. Market Analysis, Insights and Forecast - by Type
- 7.1.1. High-purity Gases
- 7.1.2. Noble Gases
- 7.1.3. Carbon Gases
- 7.1.4. Halogen Gases
- 7.1.5. Other Types
- 7.2. Market Analysis, Insights and Forecast - by End-User Industry
- 7.2.1. Automotive
- 7.2.2. Electronics
- 7.2.3. Medical and Healthcare
- 7.2.4. Food and Beverage
- 7.2.5. Oil and Gas
- 7.2.6. Other End-User Industries
- 7.1. Market Analysis, Insights and Forecast - by Type
- 8. North America Specialty Gas Market Analysis, Insights and Forecast, 2020-2032
- 8.1. Market Analysis, Insights and Forecast - by Type
- 8.1.1. High-purity Gases
- 8.1.2. Noble Gases
- 8.1.3. Carbon Gases
- 8.1.4. Halogen Gases
- 8.1.5. Other Types
- 8.2. Market Analysis, Insights and Forecast - by End-User Industry
- 8.2.1. Automotive
- 8.2.2. Electronics
- 8.2.3. Medical and Healthcare
- 8.2.4. Food and Beverage
- 8.2.5. Oil and Gas
- 8.2.6. Other End-User Industries
- 8.1. Market Analysis, Insights and Forecast - by Type
- 9. Europe Specialty Gas Market Analysis, Insights and Forecast, 2020-2032
- 9.1. Market Analysis, Insights and Forecast - by Type
- 9.1.1. High-purity Gases
- 9.1.2. Noble Gases
- 9.1.3. Carbon Gases
- 9.1.4. Halogen Gases
- 9.1.5. Other Types
- 9.2. Market Analysis, Insights and Forecast - by End-User Industry
- 9.2.1. Automotive
- 9.2.2. Electronics
- 9.2.3. Medical and Healthcare
- 9.2.4. Food and Beverage
- 9.2.5. Oil and Gas
- 9.2.6. Other End-User Industries
- 9.1. Market Analysis, Insights and Forecast - by Type
- 10. South America Specialty Gas Market Analysis, Insights and Forecast, 2020-2032
- 10.1. Market Analysis, Insights and Forecast - by Type
- 10.1.1. High-purity Gases
- 10.1.2. Noble Gases
- 10.1.3. Carbon Gases
- 10.1.4. Halogen Gases
- 10.1.5. Other Types
- 10.2. Market Analysis, Insights and Forecast - by End-User Industry
- 10.2.1. Automotive
- 10.2.2. Electronics
- 10.2.3. Medical and Healthcare
- 10.2.4. Food and Beverage
- 10.2.5. Oil and Gas
- 10.2.6. Other End-User Industries
- 10.1. Market Analysis, Insights and Forecast - by Type
- 11. Middle East and Africa Specialty Gas Market Analysis, Insights and Forecast, 2020-2032
- 11.1. Market Analysis, Insights and Forecast - by Type
- 11.1.1. High-purity Gases
- 11.1.2. Noble Gases
- 11.1.3. Carbon Gases
- 11.1.4. Halogen Gases
- 11.1.5. Other Types
- 11.2. Market Analysis, Insights and Forecast - by End-User Industry
- 11.2.1. Automotive
- 11.2.2. Electronics
- 11.2.3. Medical and Healthcare
- 11.2.4. Food and Beverage
- 11.2.5. Oil and Gas
- 11.2.6. Other End-User Industries
- 11.1. Market Analysis, Insights and Forecast - by Type
- 12. Competitive Analysis
- 12.1. Company Profiles
- 12.1.1 Air Products and Chemicals Inc
- 12.1.1.1. Company Overview
- 12.1.1.2. Products
- 12.1.1.3. Company Financials
- 12.1.1.4. SWOT Analysis
- 12.1.2 MESA Specialty Gases & Equipment
- 12.1.2.1. Company Overview
- 12.1.2.2. Products
- 12.1.2.3. Company Financials
- 12.1.2.4. SWOT Analysis
- 12.1.3 Mitsui Chemicals Inc
- 12.1.3.1. Company Overview
- 12.1.3.2. Products
- 12.1.3.3. Company Financials
- 12.1.3.4. SWOT Analysis
- 12.1.4 ILMO Products Company*List Not Exhaustive
- 12.1.4.1. Company Overview
- 12.1.4.2. Products
- 12.1.4.3. Company Financials
- 12.1.4.4. SWOT Analysis
- 12.1.5 Iwatani Corporation of America
- 12.1.5.1. Company Overview
- 12.1.5.2. Products
- 12.1.5.3. Company Financials
- 12.1.5.4. SWOT Analysis
- 12.1.6 Linde plc
- 12.1.6.1. Company Overview
- 12.1.6.2. Products
- 12.1.6.3. Company Financials
- 12.1.6.4. SWOT Analysis
- 12.1.7 Messer Group GmbH
- 12.1.7.1. Company Overview
- 12.1.7.2. Products
- 12.1.7.3. Company Financials
- 12.1.7.4. SWOT Analysis
- 12.1.8 Air Liquide
- 12.1.8.1. Company Overview
- 12.1.8.2. Products
- 12.1.8.3. Company Financials
- 12.1.8.4. SWOT Analysis
- 12.1.9 Norco Inc
- 12.1.9.1. Company Overview
- 12.1.9.2. Products
- 12.1.9.3. Company Financials
- 12.1.9.4. SWOT Analysis
- 12.1.10 YUEYANG KAIMEITE ELECTRONIC AND SPECLALTY RARE GASES CO
- 12.1.10.1. Company Overview
- 12.1.10.2. Products
- 12.1.10.3. Company Financials
- 12.1.10.4. SWOT Analysis
- 12.1.11 SHOWA DENKO K K
- 12.1.11.1. Company Overview
- 12.1.11.2. Products
- 12.1.11.3. Company Financials
- 12.1.11.4. SWOT Analysis
- 12.1.12 Coregas
- 12.1.12.1. Company Overview
- 12.1.12.2. Products
- 12.1.12.3. Company Financials
- 12.1.12.4. SWOT Analysis
- 12.1.1 Air Products and Chemicals Inc
- 12.2. Market Entropy
- 12.2.1 Company's Key Areas Served
- 12.2.2 Recent Developments
- 12.3. Company Market Share Analysis 2025
- 12.3.1 Top 5 Companies Market Share Analysis
- 12.3.2 Top 3 Companies Market Share Analysis
- 12.4. List of Potential Customers
- 13. Research Methodology
List of Figures
- Figure 1: Global Specialty Gas Market Revenue Breakdown (Million, %) by Region 2025 & 2033
- Figure 2: Global Specialty Gas Market Volume Breakdown (K Tons, %) by Region 2025 & 2033
- Figure 3: Asia Pacific Specialty Gas Market Revenue (Million), by Type 2025 & 2033
- Figure 4: Asia Pacific Specialty Gas Market Volume (K Tons), by Type 2025 & 2033
- Figure 5: Asia Pacific Specialty Gas Market Revenue Share (%), by Type 2025 & 2033
- Figure 6: Asia Pacific Specialty Gas Market Volume Share (%), by Type 2025 & 2033
- Figure 7: Asia Pacific Specialty Gas Market Revenue (Million), by End-User Industry 2025 & 2033
- Figure 8: Asia Pacific Specialty Gas Market Volume (K Tons), by End-User Industry 2025 & 2033
- Figure 9: Asia Pacific Specialty Gas Market Revenue Share (%), by End-User Industry 2025 & 2033
- Figure 10: Asia Pacific Specialty Gas Market Volume Share (%), by End-User Industry 2025 & 2033
- Figure 11: Asia Pacific Specialty Gas Market Revenue (Million), by Country 2025 & 2033
- Figure 12: Asia Pacific Specialty Gas Market Volume (K Tons), by Country 2025 & 2033
- Figure 13: Asia Pacific Specialty Gas Market Revenue Share (%), by Country 2025 & 2033
- Figure 14: Asia Pacific Specialty Gas Market Volume Share (%), by Country 2025 & 2033
- Figure 15: North America Specialty Gas Market Revenue (Million), by Type 2025 & 2033
- Figure 16: North America Specialty Gas Market Volume (K Tons), by Type 2025 & 2033
- Figure 17: North America Specialty Gas Market Revenue Share (%), by Type 2025 & 2033
- Figure 18: North America Specialty Gas Market Volume Share (%), by Type 2025 & 2033
- Figure 19: North America Specialty Gas Market Revenue (Million), by End-User Industry 2025 & 2033
- Figure 20: North America Specialty Gas Market Volume (K Tons), by End-User Industry 2025 & 2033
- Figure 21: North America Specialty Gas Market Revenue Share (%), by End-User Industry 2025 & 2033
- Figure 22: North America Specialty Gas Market Volume Share (%), by End-User Industry 2025 & 2033
- Figure 23: North America Specialty Gas Market Revenue (Million), by Country 2025 & 2033
- Figure 24: North America Specialty Gas Market Volume (K Tons), by Country 2025 & 2033
- Figure 25: North America Specialty Gas Market Revenue Share (%), by Country 2025 & 2033
- Figure 26: North America Specialty Gas Market Volume Share (%), by Country 2025 & 2033
- Figure 27: Europe Specialty Gas Market Revenue (Million), by Type 2025 & 2033
- Figure 28: Europe Specialty Gas Market Volume (K Tons), by Type 2025 & 2033
- Figure 29: Europe Specialty Gas Market Revenue Share (%), by Type 2025 & 2033
- Figure 30: Europe Specialty Gas Market Volume Share (%), by Type 2025 & 2033
- Figure 31: Europe Specialty Gas Market Revenue (Million), by End-User Industry 2025 & 2033
- Figure 32: Europe Specialty Gas Market Volume (K Tons), by End-User Industry 2025 & 2033
- Figure 33: Europe Specialty Gas Market Revenue Share (%), by End-User Industry 2025 & 2033
- Figure 34: Europe Specialty Gas Market Volume Share (%), by End-User Industry 2025 & 2033
- Figure 35: Europe Specialty Gas Market Revenue (Million), by Country 2025 & 2033
- Figure 36: Europe Specialty Gas Market Volume (K Tons), by Country 2025 & 2033
- Figure 37: Europe Specialty Gas Market Revenue Share (%), by Country 2025 & 2033
- Figure 38: Europe Specialty Gas Market Volume Share (%), by Country 2025 & 2033
- Figure 39: South America Specialty Gas Market Revenue (Million), by Type 2025 & 2033
- Figure 40: South America Specialty Gas Market Volume (K Tons), by Type 2025 & 2033
- Figure 41: South America Specialty Gas Market Revenue Share (%), by Type 2025 & 2033
- Figure 42: South America Specialty Gas Market Volume Share (%), by Type 2025 & 2033
- Figure 43: South America Specialty Gas Market Revenue (Million), by End-User Industry 2025 & 2033
- Figure 44: South America Specialty Gas Market Volume (K Tons), by End-User Industry 2025 & 2033
- Figure 45: South America Specialty Gas Market Revenue Share (%), by End-User Industry 2025 & 2033
- Figure 46: South America Specialty Gas Market Volume Share (%), by End-User Industry 2025 & 2033
- Figure 47: South America Specialty Gas Market Revenue (Million), by Country 2025 & 2033
- Figure 48: South America Specialty Gas Market Volume (K Tons), by Country 2025 & 2033
- Figure 49: South America Specialty Gas Market Revenue Share (%), by Country 2025 & 2033
- Figure 50: South America Specialty Gas Market Volume Share (%), by Country 2025 & 2033
- Figure 51: Middle East and Africa Specialty Gas Market Revenue (Million), by Type 2025 & 2033
- Figure 52: Middle East and Africa Specialty Gas Market Volume (K Tons), by Type 2025 & 2033
- Figure 53: Middle East and Africa Specialty Gas Market Revenue Share (%), by Type 2025 & 2033
- Figure 54: Middle East and Africa Specialty Gas Market Volume Share (%), by Type 2025 & 2033
- Figure 55: Middle East and Africa Specialty Gas Market Revenue (Million), by End-User Industry 2025 & 2033
- Figure 56: Middle East and Africa Specialty Gas Market Volume (K Tons), by End-User Industry 2025 & 2033
- Figure 57: Middle East and Africa Specialty Gas Market Revenue Share (%), by End-User Industry 2025 & 2033
- Figure 58: Middle East and Africa Specialty Gas Market Volume Share (%), by End-User Industry 2025 & 2033
- Figure 59: Middle East and Africa Specialty Gas Market Revenue (Million), by Country 2025 & 2033
- Figure 60: Middle East and Africa Specialty Gas Market Volume (K Tons), by Country 2025 & 2033
- Figure 61: Middle East and Africa Specialty Gas Market Revenue Share (%), by Country 2025 & 2033
- Figure 62: Middle East and Africa Specialty Gas Market Volume Share (%), by Country 2025 & 2033
List of Tables
- Table 1: Global Specialty Gas Market Revenue Million Forecast, by Type 2020 & 2033
- Table 2: Global Specialty Gas Market Volume K Tons Forecast, by Type 2020 & 2033
- Table 3: Global Specialty Gas Market Revenue Million Forecast, by End-User Industry 2020 & 2033
- Table 4: Global Specialty Gas Market Volume K Tons Forecast, by End-User Industry 2020 & 2033
- Table 5: Global Specialty Gas Market Revenue Million Forecast, by Region 2020 & 2033
- Table 6: Global Specialty Gas Market Volume K Tons Forecast, by Region 2020 & 2033
- Table 7: Global Specialty Gas Market Revenue Million Forecast, by Type 2020 & 2033
- Table 8: Global Specialty Gas Market Volume K Tons Forecast, by Type 2020 & 2033
- Table 9: Global Specialty Gas Market Revenue Million Forecast, by End-User Industry 2020 & 2033
- Table 10: Global Specialty Gas Market Volume K Tons Forecast, by End-User Industry 2020 & 2033
- Table 11: Global Specialty Gas Market Revenue Million Forecast, by Country 2020 & 2033
- Table 12: Global Specialty Gas Market Volume K Tons Forecast, by Country 2020 & 2033
- Table 13: China Specialty Gas Market Revenue (Million) Forecast, by Application 2020 & 2033
- Table 14: China Specialty Gas Market Volume (K Tons) Forecast, by Application 2020 & 2033
- Table 15: India Specialty Gas Market Revenue (Million) Forecast, by Application 2020 & 2033
- Table 16: India Specialty Gas Market Volume (K Tons) Forecast, by Application 2020 & 2033
- Table 17: Japan Specialty Gas Market Revenue (Million) Forecast, by Application 2020 & 2033
- Table 18: Japan Specialty Gas Market Volume (K Tons) Forecast, by Application 2020 & 2033
- Table 19: South Korea Specialty Gas Market Revenue (Million) Forecast, by Application 2020 & 2033
- Table 20: South Korea Specialty Gas Market Volume (K Tons) Forecast, by Application 2020 & 2033
- Table 21: Rest of Asia Pacific Specialty Gas Market Revenue (Million) Forecast, by Application 2020 & 2033
- Table 22: Rest of Asia Pacific Specialty Gas Market Volume (K Tons) Forecast, by Application 2020 & 2033
- Table 23: Global Specialty Gas Market Revenue Million Forecast, by Type 2020 & 2033
- Table 24: Global Specialty Gas Market Volume K Tons Forecast, by Type 2020 & 2033
- Table 25: Global Specialty Gas Market Revenue Million Forecast, by End-User Industry 2020 & 2033
- Table 26: Global Specialty Gas Market Volume K Tons Forecast, by End-User Industry 2020 & 2033
- Table 27: Global Specialty Gas Market Revenue Million Forecast, by Country 2020 & 2033
- Table 28: Global Specialty Gas Market Volume K Tons Forecast, by Country 2020 & 2033
- Table 29: United States Specialty Gas Market Revenue (Million) Forecast, by Application 2020 & 2033
- Table 30: United States Specialty Gas Market Volume (K Tons) Forecast, by Application 2020 & 2033
- Table 31: Canada Specialty Gas Market Revenue (Million) Forecast, by Application 2020 & 2033
- Table 32: Canada Specialty Gas Market Volume (K Tons) Forecast, by Application 2020 & 2033
- Table 33: Mexico Specialty Gas Market Revenue (Million) Forecast, by Application 2020 & 2033
- Table 34: Mexico Specialty Gas Market Volume (K Tons) Forecast, by Application 2020 & 2033
- Table 35: Rest of North America Specialty Gas Market Revenue (Million) Forecast, by Application 2020 & 2033
- Table 36: Rest of North America Specialty Gas Market Volume (K Tons) Forecast, by Application 2020 & 2033
- Table 37: Global Specialty Gas Market Revenue Million Forecast, by Type 2020 & 2033
- Table 38: Global Specialty Gas Market Volume K Tons Forecast, by Type 2020 & 2033
- Table 39: Global Specialty Gas Market Revenue Million Forecast, by End-User Industry 2020 & 2033
- Table 40: Global Specialty Gas Market Volume K Tons Forecast, by End-User Industry 2020 & 2033
- Table 41: Global Specialty Gas Market Revenue Million Forecast, by Country 2020 & 2033
- Table 42: Global Specialty Gas Market Volume K Tons Forecast, by Country 2020 & 2033
- Table 43: Germany Specialty Gas Market Revenue (Million) Forecast, by Application 2020 & 2033
- Table 44: Germany Specialty Gas Market Volume (K Tons) Forecast, by Application 2020 & 2033
- Table 45: United Kingdom Specialty Gas Market Revenue (Million) Forecast, by Application 2020 & 2033
- Table 46: United Kingdom Specialty Gas Market Volume (K Tons) Forecast, by Application 2020 & 2033
- Table 47: Italy Specialty Gas Market Revenue (Million) Forecast, by Application 2020 & 2033
- Table 48: Italy Specialty Gas Market Volume (K Tons) Forecast, by Application 2020 & 2033
- Table 49: France Specialty Gas Market Revenue (Million) Forecast, by Application 2020 & 2033
- Table 50: France Specialty Gas Market Volume (K Tons) Forecast, by Application 2020 & 2033
- Table 51: Rest of Europe Specialty Gas Market Revenue (Million) Forecast, by Application 2020 & 2033
- Table 52: Rest of Europe Specialty Gas Market Volume (K Tons) Forecast, by Application 2020 & 2033
- Table 53: Global Specialty Gas Market Revenue Million Forecast, by Type 2020 & 2033
- Table 54: Global Specialty Gas Market Volume K Tons Forecast, by Type 2020 & 2033
- Table 55: Global Specialty Gas Market Revenue Million Forecast, by End-User Industry 2020 & 2033
- Table 56: Global Specialty Gas Market Volume K Tons Forecast, by End-User Industry 2020 & 2033
- Table 57: Global Specialty Gas Market Revenue Million Forecast, by Country 2020 & 2033
- Table 58: Global Specialty Gas Market Volume K Tons Forecast, by Country 2020 & 2033
- Table 59: Brazil Specialty Gas Market Revenue (Million) Forecast, by Application 2020 & 2033
- Table 60: Brazil Specialty Gas Market Volume (K Tons) Forecast, by Application 2020 & 2033
- Table 61: Aregentina Specialty Gas Market Revenue (Million) Forecast, by Application 2020 & 2033
- Table 62: Aregentina Specialty Gas Market Volume (K Tons) Forecast, by Application 2020 & 2033
- Table 63: Rest of South America Specialty Gas Market Revenue (Million) Forecast, by Application 2020 & 2033
- Table 64: Rest of South America Specialty Gas Market Volume (K Tons) Forecast, by Application 2020 & 2033
- Table 65: Global Specialty Gas Market Revenue Million Forecast, by Type 2020 & 2033
- Table 66: Global Specialty Gas Market Volume K Tons Forecast, by Type 2020 & 2033
- Table 67: Global Specialty Gas Market Revenue Million Forecast, by End-User Industry 2020 & 2033
- Table 68: Global Specialty Gas Market Volume K Tons Forecast, by End-User Industry 2020 & 2033
- Table 69: Global Specialty Gas Market Revenue Million Forecast, by Country 2020 & 2033
- Table 70: Global Specialty Gas Market Volume K Tons Forecast, by Country 2020 & 2033
- Table 71: Saudi Arabia Specialty Gas Market Revenue (Million) Forecast, by Application 2020 & 2033
- Table 72: Saudi Arabia Specialty Gas Market Volume (K Tons) Forecast, by Application 2020 & 2033
- Table 73: South Africa Specialty Gas Market Revenue (Million) Forecast, by Application 2020 & 2033
- Table 74: South Africa Specialty Gas Market Volume (K Tons) Forecast, by Application 2020 & 2033
- Table 75: Rest of Middle East and Africa Specialty Gas Market Revenue (Million) Forecast, by Application 2020 & 2033
- Table 76: Rest of Middle East and Africa Specialty Gas Market Volume (K Tons) Forecast, by Application 2020 & 2033
Frequently Asked Questions
1. What is the projected Compound Annual Growth Rate (CAGR) of the Specialty Gas Market?
The projected CAGR is approximately > 4.00%.
2. Which companies are prominent players in the Specialty Gas Market?
Key companies in the market include Air Products and Chemicals Inc, MESA Specialty Gases & Equipment, Mitsui Chemicals Inc, ILMO Products Company*List Not Exhaustive, Iwatani Corporation of America, Linde plc, Messer Group GmbH, Air Liquide, Norco Inc, YUEYANG KAIMEITE ELECTRONIC AND SPECLALTY RARE GASES CO, SHOWA DENKO K K, Coregas.
3. What are the main segments of the Specialty Gas Market?
The market segments include Type, End-User Industry.
4. Can you provide details about the market size?
The market size is estimated to be USD 12570 Million as of 2022.
5. What are some drivers contributing to market growth?
Wide Applications in the Electronics Industry; Increasing Demand from the Healthcare Sector.
6. What are the notable trends driving market growth?
Electronics Sector to Drive the Specialty Gas Market.
7. Are there any restraints impacting market growth?
Stringent Environmental Regulations and Restrictions on Specialty Gas Production and Quality Control; Other Restraints.
8. Can you provide examples of recent developments in the market?
February 2023: Linde announced a long-term arrangement with OCI to supply clean hydrogen and other industrial gases to the company's new world-scale blue ammonia factory in Beaumont, Texas. Linde will construct, own, and manage an on-site complex that will supply OCI's 1.1 million tons of blue ammonia production with clean hydrogen and nitrogen per year. Linde will provide clean hydrogen to OCI by sequestering more than 1.7 million tons of CO2 emissions yearly.
9. What pricing options are available for accessing the report?
Pricing options include single-user, multi-user, and enterprise licenses priced at USD 4750, USD 5250, and USD 8750 respectively.
10. Is the market size provided in terms of value or volume?
The market size is provided in terms of value, measured in Million and volume, measured in K Tons.
11. Are there any specific market keywords associated with the report?
Yes, the market keyword associated with the report is "Specialty Gas Market," which aids in identifying and referencing the specific market segment covered.
12. How do I determine which pricing option suits my needs best?
The pricing options vary based on user requirements and access needs. Individual users may opt for single-user licenses, while businesses requiring broader access may choose multi-user or enterprise licenses for cost-effective access to the report.
13. Are there any additional resources or data provided in the Specialty Gas Market report?
While the report offers comprehensive insights, it's advisable to review the specific contents or supplementary materials provided to ascertain if additional resources or data are available.
14. How can I stay updated on further developments or reports in the Specialty Gas Market?
To stay informed about further developments, trends, and reports in the Specialty Gas Market, consider subscribing to industry newsletters, following relevant companies and organizations, or regularly checking reputable industry news sources and publications.
Methodology
Step 1 - Identification of Relevant Samples Size from Population Database


Step 2 - Approaches for Defining Global Market Size (Value, Volume* & Price*)

Note*: In applicable scenarios
Step 3 - Data Sources
Primary Research
- Web Analytics
- Survey Reports
- Research Institute
- Latest Research Reports
- Opinion Leaders
Secondary Research
- Annual Reports
- White Paper
- Latest Press Release
- Industry Association
- Paid Database
- Investor Presentations

Step 4 - Data Triangulation
Involves using different sources of information in order to increase the validity of a study
These sources are likely to be stakeholders in a program - participants, other researchers, program staff, other community members, and so on.
Then we put all data in single framework & apply various statistical tools to find out the dynamic on the market.
During the analysis stage, feedback from the stakeholder groups would be compared to determine areas of agreement as well as areas of divergence