

Key Insights
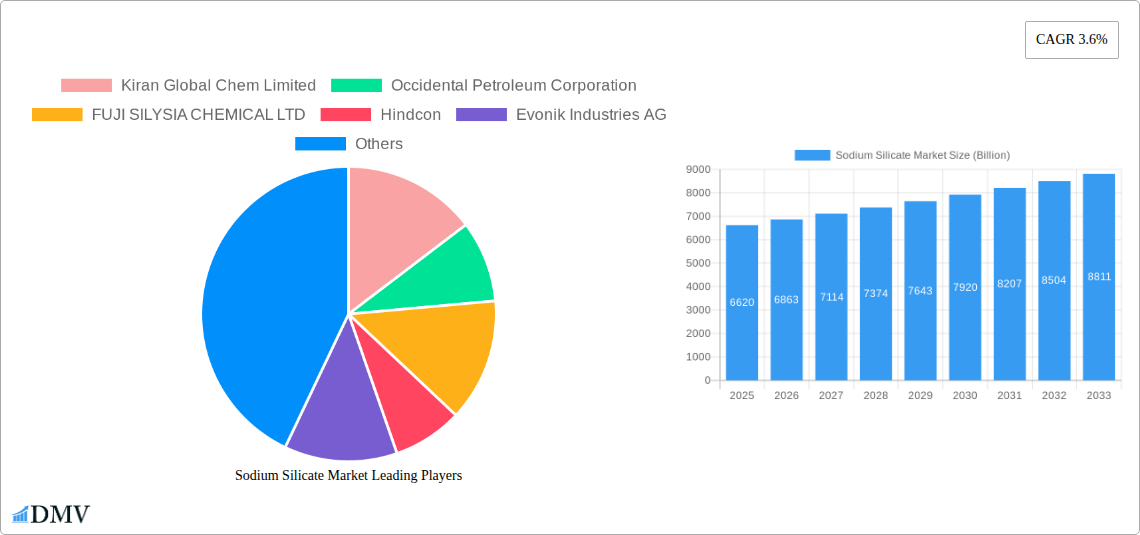
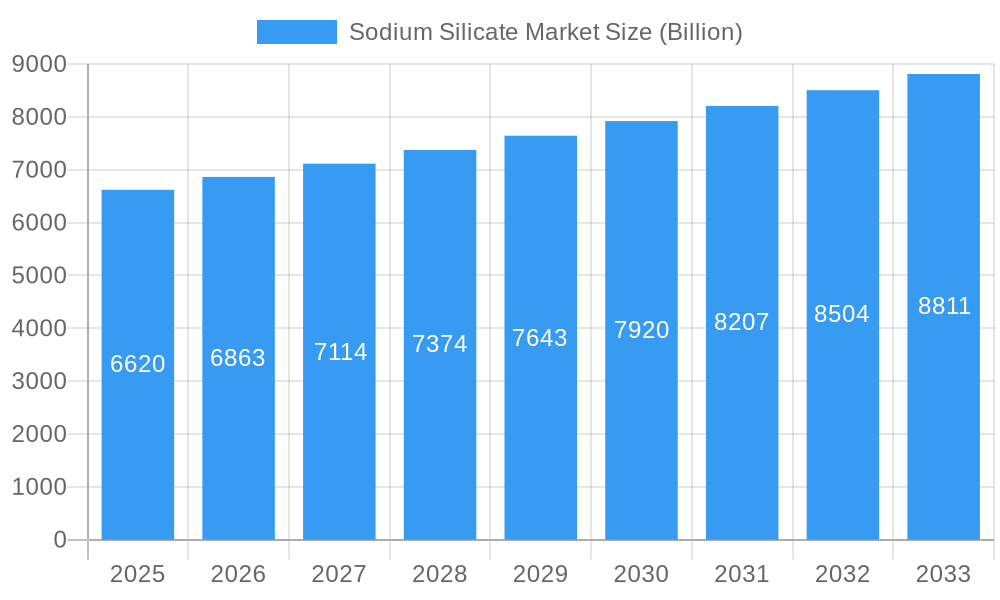
The global sodium silicate market, valued at $6.62 billion in 2025, is projected to experience steady growth, driven by its diverse applications across various industries. A Compound Annual Growth Rate (CAGR) of 3.6% from 2025 to 2033 indicates a promising future, fueled by increasing demand in construction, particularly in developing economies experiencing rapid infrastructure development. The solid form of sodium silicate is currently dominating the market due to its cost-effectiveness and ease of handling in numerous applications. However, the liquid form is expected to witness significant growth owing to its versatility and suitability for specialized applications in detergents and adhesives. The adhesives and paints segment holds a substantial market share, while the food preservation and water treatment segments are anticipated to demonstrate strong growth potential due to rising concerns about food safety and water purification needs globally. Competitive pressures among key players like BASF SE, Evonik Industries AG, and PQ Corporation are driving innovation and efficiency improvements, resulting in price competition and product diversification. While regulatory hurdles related to environmental concerns and potential health impacts pose some restraints, advancements in sustainable production methods are mitigating these risks and fostering market expansion. Geographically, the Asia-Pacific region, particularly China and India, is expected to be a major growth driver due to robust industrialization and urbanization. North America and Europe, while mature markets, will continue to contribute significantly to market revenue.
Sodium Silicate Market Market Size (In Billion)
The market segmentation reveals crucial insights into growth drivers. The strong performance of the adhesives and paints segment stems from its extensive use as a binder and performance enhancer. The rising demand for detergents and cleaning products, coupled with the effectiveness of sodium silicate as a builder and deflocculant, is driving growth in this segment. Food preservation leverages sodium silicate's ability to act as a stabilizing agent, protecting food quality and extending shelf life. The precipitated silica segment is experiencing growth owing to its use as a reinforcing agent and additive across various industries. Growth in the paper production segment is fuelled by the use of sodium silicate as a binder and sizing agent. Finally, the water treatment segment is growing due to its use as a coagulant and flocculant in water purification processes. Ongoing research and development efforts focused on improved formulations and applications will continue to shape market dynamics in the coming years.
Sodium Silicate Market Company Market Share
Sodium Silicate Market: A Comprehensive Report (2019-2033)
This insightful report provides a comprehensive analysis of the global Sodium Silicate Market, projecting a market value exceeding $XX Billion by 2033. It delves into market dynamics, competitive landscapes, and future growth trajectories, offering crucial insights for stakeholders across the value chain. The study period spans 2019-2033, with 2025 serving as the base and estimated year. This report is indispensable for businesses seeking to navigate the complexities of this dynamic market and capitalize on emerging opportunities.
Sodium Silicate Market Market Composition & Trends
The Sodium Silicate market, valued at $XX Billion in 2025, exhibits a moderately consolidated structure. Key players, including Evonik Industries AG, BASF SE, PQ Corporation, and others, hold significant market share, although the precise distribution varies across segments. Innovation in the sector is primarily driven by the demand for sustainable and high-performance products, particularly in applications like water treatment and adhesives. Regulatory landscapes, notably concerning environmental concerns and safety standards, significantly influence market dynamics. Substitute products, such as other binding agents and water treatment chemicals, exert competitive pressure, necessitating continuous innovation and cost optimization. End-user profiles are diverse, encompassing manufacturers in construction, detergents, and food processing industries, each with unique needs and preferences. M&A activity has been relatively modest in recent years, with deal values averaging $XX Billion annually (2019-2024).
- Market Concentration: Moderately Consolidated
- Innovation Catalysts: Sustainability, Performance Enhancement
- Regulatory Landscape: Stringent Environmental & Safety Norms
- Substitute Products: Alternative Binding Agents, Water Treatment Chemicals
- End-User Profiles: Diverse, including Construction, Detergents, Food Processing
- M&A Activity: Moderate, with average annual deal values of $XX Billion (2019-2024)
Sodium Silicate Market Industry Evolution
The Sodium Silicate market has witnessed consistent growth throughout the historical period (2019-2024), with a Compound Annual Growth Rate (CAGR) of XX%. This growth is attributable to several factors including rising demand from key application segments like water treatment and construction materials, coupled with technological advancements leading to improved product efficiency and sustainability. Consumer demands are shifting toward environmentally friendly and cost-effective solutions, pushing manufacturers to adopt greener production processes and develop innovative formulations. The adoption of advanced technologies, such as nanotechnology in improving product performance, is gaining traction. Furthermore, increasing urbanization and industrialization in emerging economies are driving the demand for sodium silicate-based products. We project the market to maintain a steady growth trajectory throughout the forecast period (2025-2033), reaching an estimated value exceeding $XX Billion by 2033, driven by factors described above.
Leading Regions, Countries, or Segments in Sodium Silicate Market
The Sodium Silicate market shows regional variations in dominance. While precise market share data by region and application is proprietary, initial findings suggest strong growth in Asia-Pacific and North America. The liquid form dominates the type segment due to its ease of handling and versatility across applications. The adhesives and paints application segment also commands a significant share, driven by robust growth in the construction sector.
- Key Drivers (Asia-Pacific): Rapid Industrialization, Expanding Construction Sector, Increasing Investments in Infrastructure Development.
- Key Drivers (North America): Stringent environmental regulations driving the adoption of sustainable water treatment solutions.
- Dominant Type Segment: Liquid (due to its versatility and ease of use)
- Dominant Application Segment: Adhesives and Paints (driven by construction growth)
Sodium Silicate Market Product Innovations
Recent innovations in sodium silicate technology focus on enhanced performance characteristics, including improved viscosity control, greater binding strength, and increased water solubility. This is particularly evident in the development of specialized grades tailored for specific applications, such as high-performance adhesives for construction and advanced water treatment solutions. These advancements meet growing demand for sustainable and high-efficiency materials, ultimately enhancing product value and market competitiveness.
Propelling Factors for Sodium Silicate Market Growth
Several factors contribute to the sustained growth of the sodium silicate market. Firstly, the expanding construction and infrastructure development globally fuels demand for high-performance binders and adhesives. Secondly, the increasing focus on water treatment and environmental sustainability drives adoption in water purification and wastewater management. Thirdly, technological advancements in formulations lead to improved product efficiency and reduced environmental impact.
Obstacles in the Sodium Silicate Market Market
The Sodium Silicate market faces several challenges. Fluctuations in raw material prices, particularly silica and caustic soda, impact production costs and profitability. Supply chain disruptions, as witnessed in recent years, can constrain production and lead to price volatility. Intense competition among established players necessitates continuous innovation and cost optimization to maintain market share. Stringent environmental regulations can increase compliance costs.
Future Opportunities in Sodium Silicate Market
Emerging opportunities lie in the development of specialized sodium silicate formulations for niche applications, such as advanced ceramics and bio-based composites. The increasing adoption of sustainable building materials presents a significant growth avenue. Furthermore, expansion into emerging markets, particularly in developing economies with growing construction sectors, holds substantial potential.
Major Players in the Sodium Silicate Market Ecosystem
- Kiran Global Chem Limited
- Occidental Petroleum Corporation
- FUJI SILYSIA CHEMICAL LTD
- Hindcon
- Evonik Industries AG
- Silmaco
- BASF SE
- PQ Corporation
- Z Ch Rudniki S A
- C THAI GROUP
- Alumina doo Zvornik
- W R Grace & Co -Conn
- CIECH Group
Key Developments in Sodium Silicate Market Industry
- September 2022: Evonik's strategic cooperation with Porner Group (Austria) and Phichit Bio Power Co., Ltd. (Thailand) to supply sustainable ULTRASIL precipitated silica to tire manufacturers signifies a shift towards sustainable materials and expansion into new partnerships.
Strategic Sodium Silicate Market Market Forecast
The Sodium Silicate market is poised for sustained growth, fueled by expanding applications in construction, water treatment, and other key sectors. Ongoing technological advancements, coupled with a focus on sustainability, will shape future market dynamics. The market is projected to witness significant expansion, driven by increasing demand in emerging economies and the adoption of innovative product formulations.
Sodium Silicate Market Segmentation
-
1. Type
- 1.1. Solid
- 1.2. Liquid
-
2. Application
- 2.1. Adhesives and Paints
- 2.2. Detergents
- 2.3. Food Preservation
- 2.4. Precipitated Silica
- 2.5. Paper Production
- 2.6. Water Treatment
- 2.7. Other Applications (Construction, Metal Casting)
Sodium Silicate Market Segmentation By Geography
-
1. Asia Pacific
- 1.1. China
- 1.2. India
- 1.3. Japan
- 1.4. South Korea
- 1.5. Rest of Asia Pacific
-
2. North America
- 2.1. United States
- 2.2. Canada
- 2.3. Mexico
-
3. Europe
- 3.1. Germany
- 3.2. United Kingdom
- 3.3. Italy
- 3.4. France
- 3.5. Rest of Europe
-
4. South America
- 4.1. Brazil
- 4.2. Argentina
- 4.3. Rest of South America
-
5. Middle East and Africa
- 5.1. Saudi Arabia
- 5.2. South Africa
- 5.3. Rest of Middle East and Africa
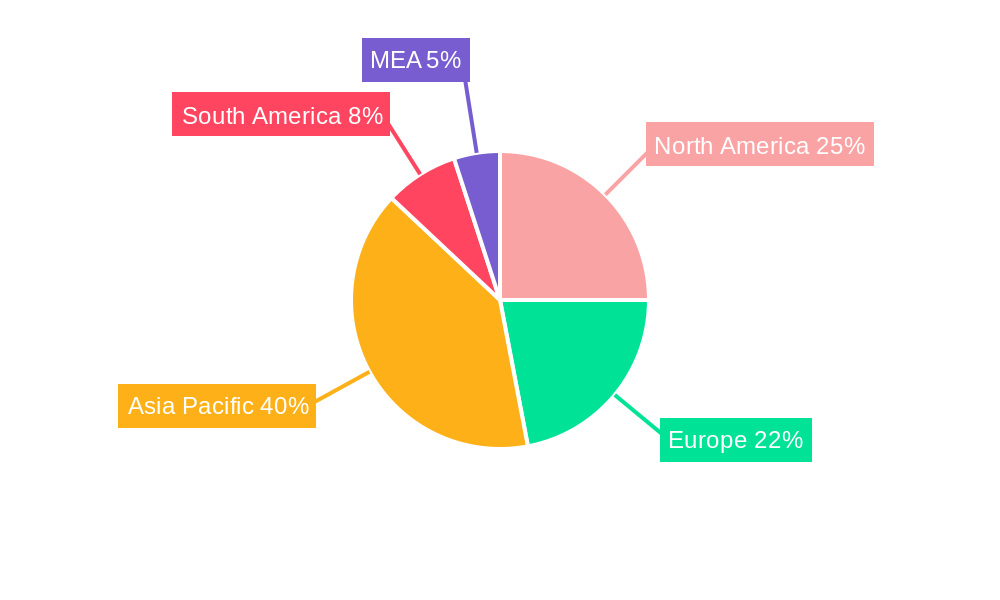
Sodium Silicate Market Regional Market Share
Geographic Coverage of Sodium Silicate Market
Sodium Silicate Market REPORT HIGHLIGHTS
| Aspects | Details |
|---|---|
| Study Period | 2020-2034 |
| Base Year | 2025 |
| Estimated Year | 2026 |
| Forecast Period | 2026-2034 |
| Historical Period | 2020-2025 |
| Growth Rate | CAGR of 3.6% from 2020-2034 |
| Segmentation |
|
Table of Contents
- 1. Introduction
- 1.1. Research Scope
- 1.2. Market Segmentation
- 1.3. Research Objective
- 1.4. Definitions and Assumptions
- 2. Executive Summary
- 2.1. Market Snapshot
- 3. Market Dynamics
- 3.1. Market Drivers
- 3.2. Market Restrains
- 3.3. Market Trends
- 3.4. Market Opportunities
- 4. Market Factor Analysis
- 4.1. Porters Five Forces
- 4.1.1. Bargaining Power of Suppliers
- 4.1.2. Bargaining Power of Buyers
- 4.1.3. Threat of New Entrants
- 4.1.4. Threat of Substitutes
- 4.1.5. Competitive Rivalry
- 4.2. PESTEL analysis
- 4.3. BCG Analysis
- 4.3.1. Stars (High Growth, High Market Share)
- 4.3.2. Cash Cows (Low Growth, High Market Share)
- 4.3.3. Question Mark (High Growth, Low Market Share)
- 4.3.4. Dogs (Low Growth, Low Market Share)
- 4.4. Ansoff Matrix Analysis
- 4.5. Supply Chain Analysis
- 4.6. Regulatory Landscape
- 4.7. Current Market Potential and Opportunity Assessment (TAM–SAM–SOM Framework)
- 4.8. DMV Analyst Note
- 4.1. Porters Five Forces
- 5. Market Analysis, Insights and Forecast 2021-2033
- 5.1. Market Analysis, Insights and Forecast - by Type
- 5.1.1. Solid
- 5.1.2. Liquid
- 5.2. Market Analysis, Insights and Forecast - by Application
- 5.2.1. Adhesives and Paints
- 5.2.2. Detergents
- 5.2.3. Food Preservation
- 5.2.4. Precipitated Silica
- 5.2.5. Paper Production
- 5.2.6. Water Treatment
- 5.2.7. Other Applications (Construction, Metal Casting)
- 5.3. Market Analysis, Insights and Forecast - by Region
- 5.3.1. Asia Pacific
- 5.3.2. North America
- 5.3.3. Europe
- 5.3.4. South America
- 5.3.5. Middle East and Africa
- 5.1. Market Analysis, Insights and Forecast - by Type
- 6. Global Sodium Silicate Market Analysis, Insights and Forecast, 2021-2033
- 6.1. Market Analysis, Insights and Forecast - by Type
- 6.1.1. Solid
- 6.1.2. Liquid
- 6.2. Market Analysis, Insights and Forecast - by Application
- 6.2.1. Adhesives and Paints
- 6.2.2. Detergents
- 6.2.3. Food Preservation
- 6.2.4. Precipitated Silica
- 6.2.5. Paper Production
- 6.2.6. Water Treatment
- 6.2.7. Other Applications (Construction, Metal Casting)
- 6.1. Market Analysis, Insights and Forecast - by Type
- 7. Asia Pacific Sodium Silicate Market Analysis, Insights and Forecast, 2020-2032
- 7.1. Market Analysis, Insights and Forecast - by Type
- 7.1.1. Solid
- 7.1.2. Liquid
- 7.2. Market Analysis, Insights and Forecast - by Application
- 7.2.1. Adhesives and Paints
- 7.2.2. Detergents
- 7.2.3. Food Preservation
- 7.2.4. Precipitated Silica
- 7.2.5. Paper Production
- 7.2.6. Water Treatment
- 7.2.7. Other Applications (Construction, Metal Casting)
- 7.1. Market Analysis, Insights and Forecast - by Type
- 8. North America Sodium Silicate Market Analysis, Insights and Forecast, 2020-2032
- 8.1. Market Analysis, Insights and Forecast - by Type
- 8.1.1. Solid
- 8.1.2. Liquid
- 8.2. Market Analysis, Insights and Forecast - by Application
- 8.2.1. Adhesives and Paints
- 8.2.2. Detergents
- 8.2.3. Food Preservation
- 8.2.4. Precipitated Silica
- 8.2.5. Paper Production
- 8.2.6. Water Treatment
- 8.2.7. Other Applications (Construction, Metal Casting)
- 8.1. Market Analysis, Insights and Forecast - by Type
- 9. Europe Sodium Silicate Market Analysis, Insights and Forecast, 2020-2032
- 9.1. Market Analysis, Insights and Forecast - by Type
- 9.1.1. Solid
- 9.1.2. Liquid
- 9.2. Market Analysis, Insights and Forecast - by Application
- 9.2.1. Adhesives and Paints
- 9.2.2. Detergents
- 9.2.3. Food Preservation
- 9.2.4. Precipitated Silica
- 9.2.5. Paper Production
- 9.2.6. Water Treatment
- 9.2.7. Other Applications (Construction, Metal Casting)
- 9.1. Market Analysis, Insights and Forecast - by Type
- 10. South America Sodium Silicate Market Analysis, Insights and Forecast, 2020-2032
- 10.1. Market Analysis, Insights and Forecast - by Type
- 10.1.1. Solid
- 10.1.2. Liquid
- 10.2. Market Analysis, Insights and Forecast - by Application
- 10.2.1. Adhesives and Paints
- 10.2.2. Detergents
- 10.2.3. Food Preservation
- 10.2.4. Precipitated Silica
- 10.2.5. Paper Production
- 10.2.6. Water Treatment
- 10.2.7. Other Applications (Construction, Metal Casting)
- 10.1. Market Analysis, Insights and Forecast - by Type
- 11. Middle East and Africa Sodium Silicate Market Analysis, Insights and Forecast, 2020-2032
- 11.1. Market Analysis, Insights and Forecast - by Type
- 11.1.1. Solid
- 11.1.2. Liquid
- 11.2. Market Analysis, Insights and Forecast - by Application
- 11.2.1. Adhesives and Paints
- 11.2.2. Detergents
- 11.2.3. Food Preservation
- 11.2.4. Precipitated Silica
- 11.2.5. Paper Production
- 11.2.6. Water Treatment
- 11.2.7. Other Applications (Construction, Metal Casting)
- 11.1. Market Analysis, Insights and Forecast - by Type
- 12. Competitive Analysis
- 12.1. Company Profiles
- 12.1.1 Kiran Global Chem Limited
- 12.1.1.1. Company Overview
- 12.1.1.2. Products
- 12.1.1.3. Company Financials
- 12.1.1.4. SWOT Analysis
- 12.1.2 Occidental Petroleum Corporation
- 12.1.2.1. Company Overview
- 12.1.2.2. Products
- 12.1.2.3. Company Financials
- 12.1.2.4. SWOT Analysis
- 12.1.3 FUJI SILYSIA CHEMICAL LTD
- 12.1.3.1. Company Overview
- 12.1.3.2. Products
- 12.1.3.3. Company Financials
- 12.1.3.4. SWOT Analysis
- 12.1.4 Hindcon
- 12.1.4.1. Company Overview
- 12.1.4.2. Products
- 12.1.4.3. Company Financials
- 12.1.4.4. SWOT Analysis
- 12.1.5 Evonik Industries AG
- 12.1.5.1. Company Overview
- 12.1.5.2. Products
- 12.1.5.3. Company Financials
- 12.1.5.4. SWOT Analysis
- 12.1.6 Silmaco
- 12.1.6.1. Company Overview
- 12.1.6.2. Products
- 12.1.6.3. Company Financials
- 12.1.6.4. SWOT Analysis
- 12.1.7 BASF SE
- 12.1.7.1. Company Overview
- 12.1.7.2. Products
- 12.1.7.3. Company Financials
- 12.1.7.4. SWOT Analysis
- 12.1.8 PQ Corporation
- 12.1.8.1. Company Overview
- 12.1.8.2. Products
- 12.1.8.3. Company Financials
- 12.1.8.4. SWOT Analysis
- 12.1.9 Z Ch Rudniki S A
- 12.1.9.1. Company Overview
- 12.1.9.2. Products
- 12.1.9.3. Company Financials
- 12.1.9.4. SWOT Analysis
- 12.1.10 C THAI GROUP
- 12.1.10.1. Company Overview
- 12.1.10.2. Products
- 12.1.10.3. Company Financials
- 12.1.10.4. SWOT Analysis
- 12.1.11 Alumina doo Zvornik
- 12.1.11.1. Company Overview
- 12.1.11.2. Products
- 12.1.11.3. Company Financials
- 12.1.11.4. SWOT Analysis
- 12.1.12 W R Grace & Co -Conn
- 12.1.12.1. Company Overview
- 12.1.12.2. Products
- 12.1.12.3. Company Financials
- 12.1.12.4. SWOT Analysis
- 12.1.13 CIECH Group
- 12.1.13.1. Company Overview
- 12.1.13.2. Products
- 12.1.13.3. Company Financials
- 12.1.13.4. SWOT Analysis
- 12.1.1 Kiran Global Chem Limited
- 12.2. Market Entropy
- 12.2.1 Company's Key Areas Served
- 12.2.2 Recent Developments
- 12.3. Company Market Share Analysis 2025
- 12.3.1 Top 5 Companies Market Share Analysis
- 12.3.2 Top 3 Companies Market Share Analysis
- 12.4. List of Potential Customers
- 13. Research Methodology
List of Figures
- Figure 1: Global Sodium Silicate Market Revenue Breakdown (Billion, %) by Region 2025 & 2033
- Figure 2: Global Sodium Silicate Market Volume Breakdown (K Tons, %) by Region 2025 & 2033
- Figure 3: Asia Pacific Sodium Silicate Market Revenue (Billion), by Type 2025 & 2033
- Figure 4: Asia Pacific Sodium Silicate Market Volume (K Tons), by Type 2025 & 2033
- Figure 5: Asia Pacific Sodium Silicate Market Revenue Share (%), by Type 2025 & 2033
- Figure 6: Asia Pacific Sodium Silicate Market Volume Share (%), by Type 2025 & 2033
- Figure 7: Asia Pacific Sodium Silicate Market Revenue (Billion), by Application 2025 & 2033
- Figure 8: Asia Pacific Sodium Silicate Market Volume (K Tons), by Application 2025 & 2033
- Figure 9: Asia Pacific Sodium Silicate Market Revenue Share (%), by Application 2025 & 2033
- Figure 10: Asia Pacific Sodium Silicate Market Volume Share (%), by Application 2025 & 2033
- Figure 11: Asia Pacific Sodium Silicate Market Revenue (Billion), by Country 2025 & 2033
- Figure 12: Asia Pacific Sodium Silicate Market Volume (K Tons), by Country 2025 & 2033
- Figure 13: Asia Pacific Sodium Silicate Market Revenue Share (%), by Country 2025 & 2033
- Figure 14: Asia Pacific Sodium Silicate Market Volume Share (%), by Country 2025 & 2033
- Figure 15: North America Sodium Silicate Market Revenue (Billion), by Type 2025 & 2033
- Figure 16: North America Sodium Silicate Market Volume (K Tons), by Type 2025 & 2033
- Figure 17: North America Sodium Silicate Market Revenue Share (%), by Type 2025 & 2033
- Figure 18: North America Sodium Silicate Market Volume Share (%), by Type 2025 & 2033
- Figure 19: North America Sodium Silicate Market Revenue (Billion), by Application 2025 & 2033
- Figure 20: North America Sodium Silicate Market Volume (K Tons), by Application 2025 & 2033
- Figure 21: North America Sodium Silicate Market Revenue Share (%), by Application 2025 & 2033
- Figure 22: North America Sodium Silicate Market Volume Share (%), by Application 2025 & 2033
- Figure 23: North America Sodium Silicate Market Revenue (Billion), by Country 2025 & 2033
- Figure 24: North America Sodium Silicate Market Volume (K Tons), by Country 2025 & 2033
- Figure 25: North America Sodium Silicate Market Revenue Share (%), by Country 2025 & 2033
- Figure 26: North America Sodium Silicate Market Volume Share (%), by Country 2025 & 2033
- Figure 27: Europe Sodium Silicate Market Revenue (Billion), by Type 2025 & 2033
- Figure 28: Europe Sodium Silicate Market Volume (K Tons), by Type 2025 & 2033
- Figure 29: Europe Sodium Silicate Market Revenue Share (%), by Type 2025 & 2033
- Figure 30: Europe Sodium Silicate Market Volume Share (%), by Type 2025 & 2033
- Figure 31: Europe Sodium Silicate Market Revenue (Billion), by Application 2025 & 2033
- Figure 32: Europe Sodium Silicate Market Volume (K Tons), by Application 2025 & 2033
- Figure 33: Europe Sodium Silicate Market Revenue Share (%), by Application 2025 & 2033
- Figure 34: Europe Sodium Silicate Market Volume Share (%), by Application 2025 & 2033
- Figure 35: Europe Sodium Silicate Market Revenue (Billion), by Country 2025 & 2033
- Figure 36: Europe Sodium Silicate Market Volume (K Tons), by Country 2025 & 2033
- Figure 37: Europe Sodium Silicate Market Revenue Share (%), by Country 2025 & 2033
- Figure 38: Europe Sodium Silicate Market Volume Share (%), by Country 2025 & 2033
- Figure 39: South America Sodium Silicate Market Revenue (Billion), by Type 2025 & 2033
- Figure 40: South America Sodium Silicate Market Volume (K Tons), by Type 2025 & 2033
- Figure 41: South America Sodium Silicate Market Revenue Share (%), by Type 2025 & 2033
- Figure 42: South America Sodium Silicate Market Volume Share (%), by Type 2025 & 2033
- Figure 43: South America Sodium Silicate Market Revenue (Billion), by Application 2025 & 2033
- Figure 44: South America Sodium Silicate Market Volume (K Tons), by Application 2025 & 2033
- Figure 45: South America Sodium Silicate Market Revenue Share (%), by Application 2025 & 2033
- Figure 46: South America Sodium Silicate Market Volume Share (%), by Application 2025 & 2033
- Figure 47: South America Sodium Silicate Market Revenue (Billion), by Country 2025 & 2033
- Figure 48: South America Sodium Silicate Market Volume (K Tons), by Country 2025 & 2033
- Figure 49: South America Sodium Silicate Market Revenue Share (%), by Country 2025 & 2033
- Figure 50: South America Sodium Silicate Market Volume Share (%), by Country 2025 & 2033
- Figure 51: Middle East and Africa Sodium Silicate Market Revenue (Billion), by Type 2025 & 2033
- Figure 52: Middle East and Africa Sodium Silicate Market Volume (K Tons), by Type 2025 & 2033
- Figure 53: Middle East and Africa Sodium Silicate Market Revenue Share (%), by Type 2025 & 2033
- Figure 54: Middle East and Africa Sodium Silicate Market Volume Share (%), by Type 2025 & 2033
- Figure 55: Middle East and Africa Sodium Silicate Market Revenue (Billion), by Application 2025 & 2033
- Figure 56: Middle East and Africa Sodium Silicate Market Volume (K Tons), by Application 2025 & 2033
- Figure 57: Middle East and Africa Sodium Silicate Market Revenue Share (%), by Application 2025 & 2033
- Figure 58: Middle East and Africa Sodium Silicate Market Volume Share (%), by Application 2025 & 2033
- Figure 59: Middle East and Africa Sodium Silicate Market Revenue (Billion), by Country 2025 & 2033
- Figure 60: Middle East and Africa Sodium Silicate Market Volume (K Tons), by Country 2025 & 2033
- Figure 61: Middle East and Africa Sodium Silicate Market Revenue Share (%), by Country 2025 & 2033
- Figure 62: Middle East and Africa Sodium Silicate Market Volume Share (%), by Country 2025 & 2033
List of Tables
- Table 1: Global Sodium Silicate Market Revenue Billion Forecast, by Type 2020 & 2033
- Table 2: Global Sodium Silicate Market Volume K Tons Forecast, by Type 2020 & 2033
- Table 3: Global Sodium Silicate Market Revenue Billion Forecast, by Application 2020 & 2033
- Table 4: Global Sodium Silicate Market Volume K Tons Forecast, by Application 2020 & 2033
- Table 5: Global Sodium Silicate Market Revenue Billion Forecast, by Region 2020 & 2033
- Table 6: Global Sodium Silicate Market Volume K Tons Forecast, by Region 2020 & 2033
- Table 7: Global Sodium Silicate Market Revenue Billion Forecast, by Type 2020 & 2033
- Table 8: Global Sodium Silicate Market Volume K Tons Forecast, by Type 2020 & 2033
- Table 9: Global Sodium Silicate Market Revenue Billion Forecast, by Application 2020 & 2033
- Table 10: Global Sodium Silicate Market Volume K Tons Forecast, by Application 2020 & 2033
- Table 11: Global Sodium Silicate Market Revenue Billion Forecast, by Country 2020 & 2033
- Table 12: Global Sodium Silicate Market Volume K Tons Forecast, by Country 2020 & 2033
- Table 13: China Sodium Silicate Market Revenue (Billion) Forecast, by Application 2020 & 2033
- Table 14: China Sodium Silicate Market Volume (K Tons) Forecast, by Application 2020 & 2033
- Table 15: India Sodium Silicate Market Revenue (Billion) Forecast, by Application 2020 & 2033
- Table 16: India Sodium Silicate Market Volume (K Tons) Forecast, by Application 2020 & 2033
- Table 17: Japan Sodium Silicate Market Revenue (Billion) Forecast, by Application 2020 & 2033
- Table 18: Japan Sodium Silicate Market Volume (K Tons) Forecast, by Application 2020 & 2033
- Table 19: South Korea Sodium Silicate Market Revenue (Billion) Forecast, by Application 2020 & 2033
- Table 20: South Korea Sodium Silicate Market Volume (K Tons) Forecast, by Application 2020 & 2033
- Table 21: Rest of Asia Pacific Sodium Silicate Market Revenue (Billion) Forecast, by Application 2020 & 2033
- Table 22: Rest of Asia Pacific Sodium Silicate Market Volume (K Tons) Forecast, by Application 2020 & 2033
- Table 23: Global Sodium Silicate Market Revenue Billion Forecast, by Type 2020 & 2033
- Table 24: Global Sodium Silicate Market Volume K Tons Forecast, by Type 2020 & 2033
- Table 25: Global Sodium Silicate Market Revenue Billion Forecast, by Application 2020 & 2033
- Table 26: Global Sodium Silicate Market Volume K Tons Forecast, by Application 2020 & 2033
- Table 27: Global Sodium Silicate Market Revenue Billion Forecast, by Country 2020 & 2033
- Table 28: Global Sodium Silicate Market Volume K Tons Forecast, by Country 2020 & 2033
- Table 29: United States Sodium Silicate Market Revenue (Billion) Forecast, by Application 2020 & 2033
- Table 30: United States Sodium Silicate Market Volume (K Tons) Forecast, by Application 2020 & 2033
- Table 31: Canada Sodium Silicate Market Revenue (Billion) Forecast, by Application 2020 & 2033
- Table 32: Canada Sodium Silicate Market Volume (K Tons) Forecast, by Application 2020 & 2033
- Table 33: Mexico Sodium Silicate Market Revenue (Billion) Forecast, by Application 2020 & 2033
- Table 34: Mexico Sodium Silicate Market Volume (K Tons) Forecast, by Application 2020 & 2033
- Table 35: Global Sodium Silicate Market Revenue Billion Forecast, by Type 2020 & 2033
- Table 36: Global Sodium Silicate Market Volume K Tons Forecast, by Type 2020 & 2033
- Table 37: Global Sodium Silicate Market Revenue Billion Forecast, by Application 2020 & 2033
- Table 38: Global Sodium Silicate Market Volume K Tons Forecast, by Application 2020 & 2033
- Table 39: Global Sodium Silicate Market Revenue Billion Forecast, by Country 2020 & 2033
- Table 40: Global Sodium Silicate Market Volume K Tons Forecast, by Country 2020 & 2033
- Table 41: Germany Sodium Silicate Market Revenue (Billion) Forecast, by Application 2020 & 2033
- Table 42: Germany Sodium Silicate Market Volume (K Tons) Forecast, by Application 2020 & 2033
- Table 43: United Kingdom Sodium Silicate Market Revenue (Billion) Forecast, by Application 2020 & 2033
- Table 44: United Kingdom Sodium Silicate Market Volume (K Tons) Forecast, by Application 2020 & 2033
- Table 45: Italy Sodium Silicate Market Revenue (Billion) Forecast, by Application 2020 & 2033
- Table 46: Italy Sodium Silicate Market Volume (K Tons) Forecast, by Application 2020 & 2033
- Table 47: France Sodium Silicate Market Revenue (Billion) Forecast, by Application 2020 & 2033
- Table 48: France Sodium Silicate Market Volume (K Tons) Forecast, by Application 2020 & 2033
- Table 49: Rest of Europe Sodium Silicate Market Revenue (Billion) Forecast, by Application 2020 & 2033
- Table 50: Rest of Europe Sodium Silicate Market Volume (K Tons) Forecast, by Application 2020 & 2033
- Table 51: Global Sodium Silicate Market Revenue Billion Forecast, by Type 2020 & 2033
- Table 52: Global Sodium Silicate Market Volume K Tons Forecast, by Type 2020 & 2033
- Table 53: Global Sodium Silicate Market Revenue Billion Forecast, by Application 2020 & 2033
- Table 54: Global Sodium Silicate Market Volume K Tons Forecast, by Application 2020 & 2033
- Table 55: Global Sodium Silicate Market Revenue Billion Forecast, by Country 2020 & 2033
- Table 56: Global Sodium Silicate Market Volume K Tons Forecast, by Country 2020 & 2033
- Table 57: Brazil Sodium Silicate Market Revenue (Billion) Forecast, by Application 2020 & 2033
- Table 58: Brazil Sodium Silicate Market Volume (K Tons) Forecast, by Application 2020 & 2033
- Table 59: Argentina Sodium Silicate Market Revenue (Billion) Forecast, by Application 2020 & 2033
- Table 60: Argentina Sodium Silicate Market Volume (K Tons) Forecast, by Application 2020 & 2033
- Table 61: Rest of South America Sodium Silicate Market Revenue (Billion) Forecast, by Application 2020 & 2033
- Table 62: Rest of South America Sodium Silicate Market Volume (K Tons) Forecast, by Application 2020 & 2033
- Table 63: Global Sodium Silicate Market Revenue Billion Forecast, by Type 2020 & 2033
- Table 64: Global Sodium Silicate Market Volume K Tons Forecast, by Type 2020 & 2033
- Table 65: Global Sodium Silicate Market Revenue Billion Forecast, by Application 2020 & 2033
- Table 66: Global Sodium Silicate Market Volume K Tons Forecast, by Application 2020 & 2033
- Table 67: Global Sodium Silicate Market Revenue Billion Forecast, by Country 2020 & 2033
- Table 68: Global Sodium Silicate Market Volume K Tons Forecast, by Country 2020 & 2033
- Table 69: Saudi Arabia Sodium Silicate Market Revenue (Billion) Forecast, by Application 2020 & 2033
- Table 70: Saudi Arabia Sodium Silicate Market Volume (K Tons) Forecast, by Application 2020 & 2033
- Table 71: South Africa Sodium Silicate Market Revenue (Billion) Forecast, by Application 2020 & 2033
- Table 72: South Africa Sodium Silicate Market Volume (K Tons) Forecast, by Application 2020 & 2033
- Table 73: Rest of Middle East and Africa Sodium Silicate Market Revenue (Billion) Forecast, by Application 2020 & 2033
- Table 74: Rest of Middle East and Africa Sodium Silicate Market Volume (K Tons) Forecast, by Application 2020 & 2033
Frequently Asked Questions
1. What is the projected Compound Annual Growth Rate (CAGR) of the Sodium Silicate Market?
The projected CAGR is approximately 3.6%.
2. Which companies are prominent players in the Sodium Silicate Market?
Key companies in the market include Kiran Global Chem Limited, Occidental Petroleum Corporation, FUJI SILYSIA CHEMICAL LTD, Hindcon, Evonik Industries AG, Silmaco, BASF SE, PQ Corporation, Z Ch Rudniki S A, C THAI GROUP, Alumina doo Zvornik, W R Grace & Co -Conn, CIECH Group.
3. What are the main segments of the Sodium Silicate Market?
The market segments include Type, Application.
4. Can you provide details about the market size?
The market size is estimated to be USD 6.62 Billion as of 2022.
5. What are some drivers contributing to market growth?
Increasing Demand for Waste Paper Recycling; Rising Demand for Precipitated Silica from the Rubber and Tyre Industry; Other Drivers.
6. What are the notable trends driving market growth?
Detergents Segment to Witness Healthy Demand.
7. Are there any restraints impacting market growth?
Hazardous Effects of Sodium Silicate; Other Restraints.
8. Can you provide examples of recent developments in the market?
September 2022: Evonik, one of the world's leading silica producers, has entered a strategic cooperation with the Porner Group, Austria and Phichit Bio Power Co., Ltd., Thailand, to supply sustainable ULTRASIL precipitated silica to tire manufacturers.
9. What pricing options are available for accessing the report?
Pricing options include single-user, multi-user, and enterprise licenses priced at USD 4750, USD 5250, and USD 8750 respectively.
10. Is the market size provided in terms of value or volume?
The market size is provided in terms of value, measured in Billion and volume, measured in K Tons.
11. Are there any specific market keywords associated with the report?
Yes, the market keyword associated with the report is "Sodium Silicate Market," which aids in identifying and referencing the specific market segment covered.
12. How do I determine which pricing option suits my needs best?
The pricing options vary based on user requirements and access needs. Individual users may opt for single-user licenses, while businesses requiring broader access may choose multi-user or enterprise licenses for cost-effective access to the report.
13. Are there any additional resources or data provided in the Sodium Silicate Market report?
While the report offers comprehensive insights, it's advisable to review the specific contents or supplementary materials provided to ascertain if additional resources or data are available.
14. How can I stay updated on further developments or reports in the Sodium Silicate Market?
To stay informed about further developments, trends, and reports in the Sodium Silicate Market, consider subscribing to industry newsletters, following relevant companies and organizations, or regularly checking reputable industry news sources and publications.
Methodology
Step 1 - Identification of Relevant Samples Size from Population Database


Step 2 - Approaches for Defining Global Market Size (Value, Volume* & Price*)

Note*: In applicable scenarios
Step 3 - Data Sources
Primary Research
- Web Analytics
- Survey Reports
- Research Institute
- Latest Research Reports
- Opinion Leaders
Secondary Research
- Annual Reports
- White Paper
- Latest Press Release
- Industry Association
- Paid Database
- Investor Presentations

Step 4 - Data Triangulation
Involves using different sources of information in order to increase the validity of a study
These sources are likely to be stakeholders in a program - participants, other researchers, program staff, other community members, and so on.
Then we put all data in single framework & apply various statistical tools to find out the dynamic on the market.
During the analysis stage, feedback from the stakeholder groups would be compared to determine areas of agreement as well as areas of divergence