

Key Insights
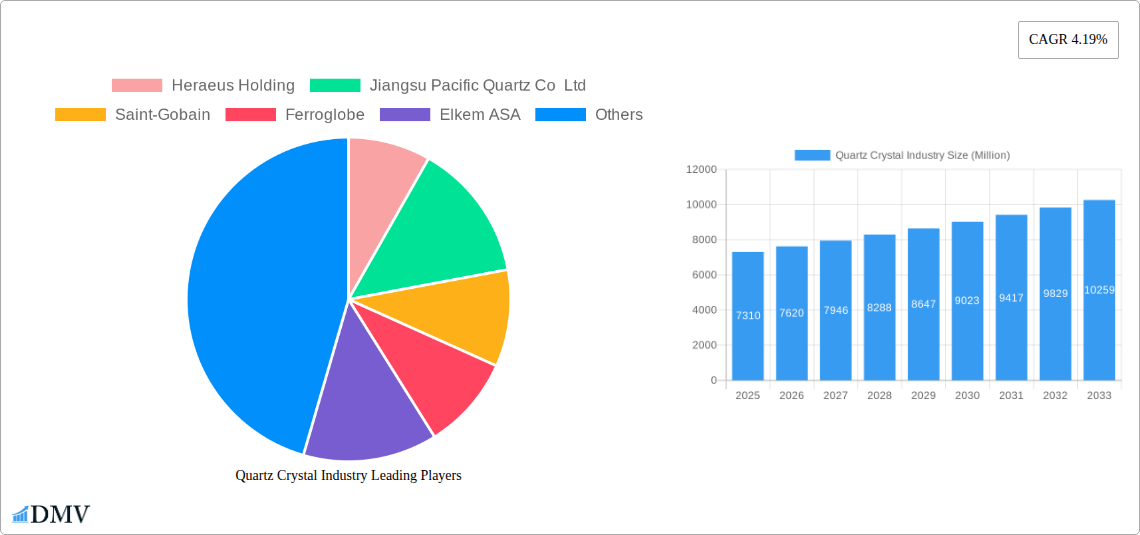
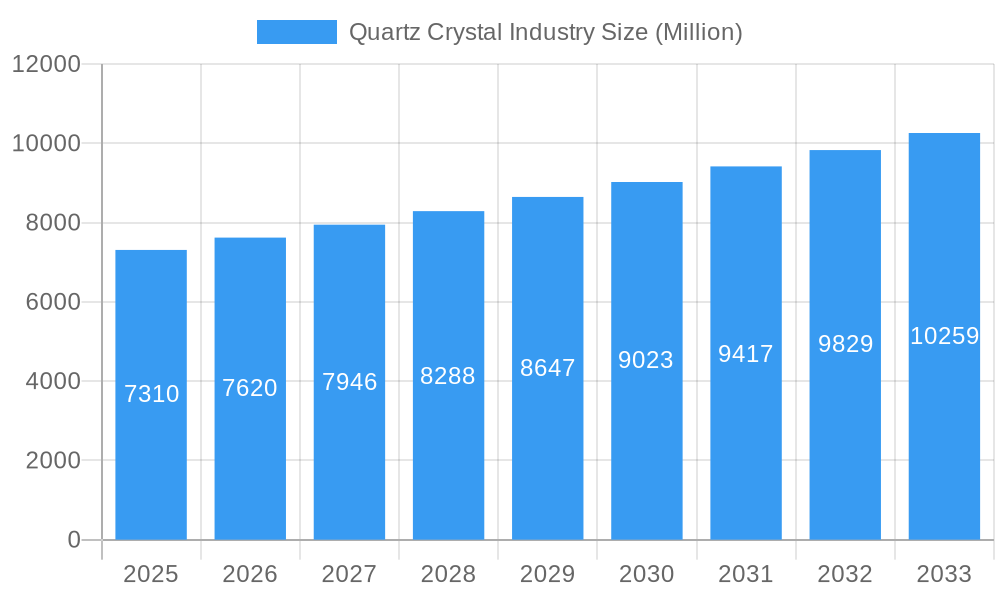
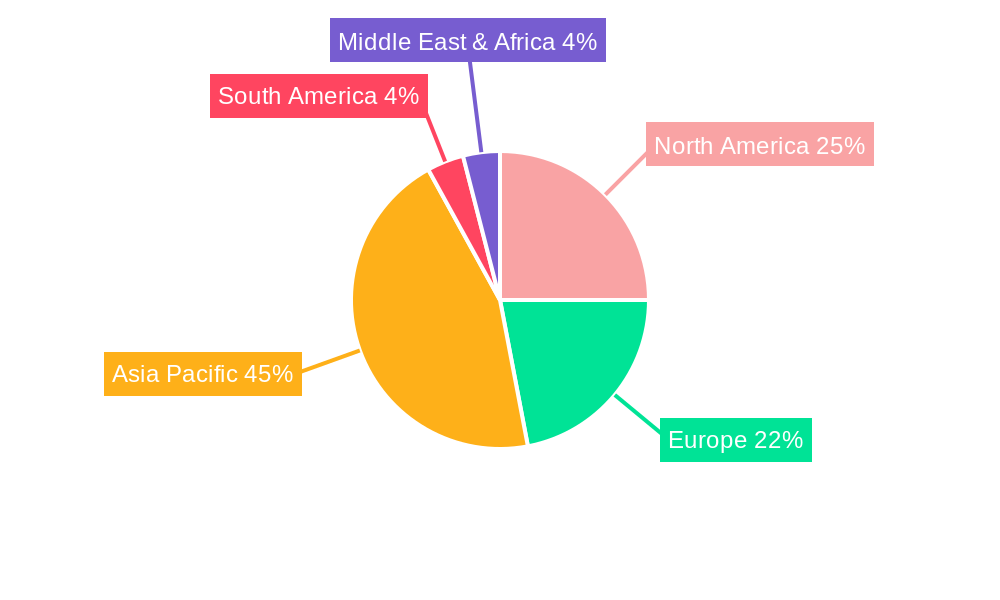
The global quartz crystal market, valued at $7.31 billion in 2025, is projected to experience robust growth, driven by the increasing demand from diverse end-use sectors. A compound annual growth rate (CAGR) of 4.19% from 2025 to 2033 indicates a significant expansion, primarily fueled by the electronics and semiconductor industry's relentless pursuit of higher performance and miniaturization. The burgeoning solar energy sector further contributes to this growth, with quartz crystal playing a crucial role in solar cell manufacturing. Furthermore, advancements in optical fiber and telecommunication technologies, coupled with the growing automotive industry's adoption of quartz crystal components, are key drivers. The market segmentation reveals high-purity quartz as the dominant type, owing to its superior properties for demanding applications. Geographically, the Asia-Pacific region, particularly China, holds a substantial market share due to its robust manufacturing base and significant presence of electronics and semiconductor companies. However, North America and Europe are also expected to witness considerable growth, driven by technological advancements and increasing investments in renewable energy infrastructure. While the market faces restraints like raw material price fluctuations and potential supply chain disruptions, its overall trajectory remains positive, indicating a promising future for quartz crystal manufacturers.
Quartz Crystal Industry Market Size (In Billion)
The competitive landscape is characterized by a mix of established global players and regional manufacturers. Companies like Heraeus Holding, Saint-Gobain, and others are actively engaged in expanding their production capacity and investing in research and development to improve the quality and functionality of quartz crystal products. The market is witnessing increased consolidation, with larger players acquiring smaller companies to enhance their market share and expand their product portfolio. Strategic partnerships and technological collaborations are also shaping the competitive dynamics. The forecast period suggests that continued innovation in materials science, along with the growing demand from key end-use sectors, will be instrumental in driving the continued expansion of the quartz crystal market during the period from 2025 to 2033. Understanding the interplay between these various factors is crucial for both established players and new entrants seeking to navigate this dynamic and rapidly growing market.
Quartz Crystal Industry Company Market Share
Quartz Crystal Industry Market Report: 2019-2033
This comprehensive report provides an in-depth analysis of the global quartz crystal industry, offering valuable insights for stakeholders seeking to understand market dynamics, future trends, and investment opportunities. The report covers the period from 2019 to 2033, with a focus on the 2025-2033 forecast period. The global market size is projected to reach xx Million by 2033.
Quartz Crystal Industry Market Composition & Trends
The quartz crystal market is moderately concentrated, with several major players holding significant market share. Market share distribution is dynamic, influenced by mergers and acquisitions (M&A) activity, technological advancements, and regional variations in demand. The report analyzes the competitive landscape, identifying key players such as Heraeus Holding, Jiangsu Pacific Quartz Co Ltd, Saint-Gobain, Ferroglobe, Elkem ASA, Wonic QnC Corporation, The Quartz Corporation, Nihon Dempa Kogyo Co Ltd, Sibelco, Nordic Mining ASA, SUMCO Corporation, Dow, RUSNANO Group, AGC Inc, and Beijing Kai de Quartz Co Ltd. (Note: This list is not exhaustive). Innovation is driven by the need for higher purity quartz in advanced applications, particularly in electronics and semiconductors. Regulatory landscapes vary across regions, impacting production and environmental compliance. Substitute products, such as synthetic materials, pose a competitive challenge. M&A activity, exemplified by Sibelco's acquisition of Bassanetti Group in December 2022 (valued at xx Million), shapes market consolidation and geographic expansion.
- Market Concentration: Moderately concentrated, with top 5 players holding approximately xx% market share in 2024.
- Innovation Catalysts: Demand for high-purity quartz, miniaturization in electronics, and advancements in material science.
- Regulatory Landscape: Varies by region; focuses on environmental protection and worker safety.
- Substitute Products: Synthetic quartz and alternative materials present limited competition.
- M&A Activity: Significant activity, driven by consolidation and expansion into new markets. Total M&A deal value in 2024 was approximately xx Million.
- End-User Profiles: Electronics and semiconductors, solar energy, construction, optical fiber, automotive, and other specialized sectors.
Quartz Crystal Industry Evolution
The quartz crystal industry has experienced consistent growth over the historical period (2019-2024), with a Compound Annual Growth Rate (CAGR) of xx%. This growth is attributed to several factors, including the increasing demand for electronics and semiconductors, the expansion of renewable energy sectors (particularly solar), and the growing adoption of quartz crystal in various other applications, like optical fibers and construction. Technological advancements in quartz crystal production have led to improvements in purity, yield, and cost-effectiveness. Shifts in consumer demands, driven by increasing technological sophistication and sustainability concerns, are influencing product development and market segmentation. The forecast period (2025-2033) projects a CAGR of xx%, driven primarily by the expanding electronics and renewable energy markets, as well as ongoing technological innovations. Adoption of high-purity quartz is expected to increase at a rate of xx% annually during the forecast period.
Leading Regions, Countries, or Segments in Quartz Crystal Industry
The Asia-Pacific region is currently the dominant market for quartz crystal, driven by the high concentration of electronics manufacturing and the rapid growth of the solar energy sector in countries like China and Japan. Within the segments, Quartz Glass and High-Purity Quartz are the fastest-growing segments.
- Key Drivers in Asia-Pacific:
- Significant investments in electronics and semiconductor manufacturing.
- Strong government support for renewable energy initiatives.
- A large and growing consumer base.
- Dominance Factors: High manufacturing capacity, favorable government policies, and proximity to key end-users.
- Other Regions: North America and Europe hold significant market share but are growing at a slower pace compared to the Asia-Pacific region. The Electronics and Semiconductor segment is the leading end-user industry, driven by the ever-increasing demand for advanced electronic components and the miniaturization of electronics.
Quartz Crystal Industry Product Innovations
Recent innovations in quartz crystal technology have focused on improving purity levels, enhancing thermal stability, and expanding applications. The development of new production processes and surface treatment techniques has led to the creation of higher-performance quartz crystals with improved optical properties and mechanical strength. These advancements have opened up new applications in high-precision sensors, optical devices, and advanced electronics. Unique selling propositions include improved efficiency, durability, and cost-effectiveness.
Propelling Factors for Quartz Crystal Industry Growth
Technological advancements, such as the development of higher-purity quartz crystals and improved manufacturing processes, are significantly boosting industry growth. The expanding electronics and semiconductor industries are key drivers, along with the increased adoption of renewable energy technologies, particularly solar power, that rely on quartz crystal materials. Government policies promoting renewable energy and technological advancements also play a crucial role.
Obstacles in the Quartz Crystal Industry Market
The quartz crystal industry faces several challenges, including potential supply chain disruptions due to geopolitical instability and the concentration of production in specific regions. Fluctuations in raw material prices and increasing environmental regulations can also impact profitability. Intense competition from existing players and the emergence of new entrants pose further challenges. The impact of these factors can translate into higher production costs and reduced profit margins.
Future Opportunities in Quartz Crystal Industry
Future growth opportunities lie in the exploration of new applications for quartz crystal in emerging technologies, such as 5G networks, electric vehicles, and advanced medical devices. The development of sustainable and environmentally friendly production processes will also drive market expansion. Growth in developing economies, coupled with increasing demand for advanced electronic components, present further opportunities.
Major Players in the Quartz Crystal Industry Ecosystem
- Heraeus Holding
- Jiangsu Pacific Quartz Co Ltd
- Saint-Gobain
- Ferroglobe
- Elkem ASA
- Wonic QnC Corporation
- The Quartz Corporation
- Nihon Dempa Kogyo Co Ltd
- Sibelco
- Nordic Mining ASA
- SUMCO Corporation
- Dow
- RUSNANO Group
- AGC Inc
- Beijing Kai de Quartz Co Ltd
Key Developments in Quartz Crystal Industry Industry
- December 2022: Sibelco acquired Bassanetti Group, strengthening its position in Southern Europe.
- March 2022: AGC Inc. terminated operations in Russia and Ukraine due to the war.
Strategic Quartz Crystal Industry Market Forecast
The quartz crystal market is poised for sustained growth over the forecast period, driven by technological advancements, the expanding electronics and renewable energy sectors, and rising demand from emerging economies. Opportunities exist in developing specialized high-purity quartz applications and expanding into new markets. The market's future potential is significant, with continued innovation promising new applications and increased market penetration across various industries.
Quartz Crystal Industry Segmentation
-
1. Type
-
1.1. High-purity Quartz
- 1.1.1. Quartz Surface and Tile
- 1.1.2. Fused Quartz Crucible
- 1.1.3. Quartz Glass
- 1.2. Quartz Crystal
- 1.3. Silicon Metal
-
1.1. High-purity Quartz
-
2. End-user Industry
- 2.1. Electronics and Semiconductor
- 2.2. Solar
- 2.3. Buildings and Construction
- 2.4. Optical fiber and Telecommunication
- 2.5. Automotive
- 2.6. Other End-user Industries
Quartz Crystal Industry Segmentation By Geography
-
1. Asia Pacific
- 1.1. China
- 1.2. India
- 1.3. Japan
- 1.4. South Korea
- 1.5. Rest of Asia Pacific
-
2. North America
- 2.1. United States
- 2.2. Canada
- 2.3. Mexico
-
3. Europe
- 3.1. Germany
- 3.2. United Kingdom
- 3.3. Italy
- 3.4. France
- 3.5. Russia
- 3.6. Rest of Europe
-
4. South America
- 4.1. Brazil
- 4.2. Argentina
- 4.3. Rest of South America
- 5. Middle East
-
6. Saudi Arabia
- 6.1. South Africa
- 6.2. Rest of Middle East
Quartz Crystal Industry Regional Market Share
Geographic Coverage of Quartz Crystal Industry
Quartz Crystal Industry REPORT HIGHLIGHTS
| Aspects | Details |
|---|---|
| Study Period | 2020-2034 |
| Base Year | 2025 |
| Estimated Year | 2026 |
| Forecast Period | 2026-2034 |
| Historical Period | 2020-2025 |
| Growth Rate | CAGR of 4.19% from 2020-2034 |
| Segmentation |
|
Table of Contents
- 1. Introduction
- 1.1. Research Scope
- 1.2. Market Segmentation
- 1.3. Research Objective
- 1.4. Definitions and Assumptions
- 2. Executive Summary
- 2.1. Market Snapshot
- 3. Market Dynamics
- 3.1. Market Drivers
- 3.2. Market Restrains
- 3.3. Market Trends
- 3.4. Market Opportunities
- 4. Market Factor Analysis
- 4.1. Porters Five Forces
- 4.1.1. Bargaining Power of Suppliers
- 4.1.2. Bargaining Power of Buyers
- 4.1.3. Threat of New Entrants
- 4.1.4. Threat of Substitutes
- 4.1.5. Competitive Rivalry
- 4.2. PESTEL analysis
- 4.3. BCG Analysis
- 4.3.1. Stars (High Growth, High Market Share)
- 4.3.2. Cash Cows (Low Growth, High Market Share)
- 4.3.3. Question Mark (High Growth, Low Market Share)
- 4.3.4. Dogs (Low Growth, Low Market Share)
- 4.4. Ansoff Matrix Analysis
- 4.5. Supply Chain Analysis
- 4.6. Regulatory Landscape
- 4.7. Current Market Potential and Opportunity Assessment (TAM–SAM–SOM Framework)
- 4.8. DMV Analyst Note
- 4.1. Porters Five Forces
- 5. Market Analysis, Insights and Forecast 2021-2033
- 5.1. Market Analysis, Insights and Forecast - by Type
- 5.1.1. High-purity Quartz
- 5.1.1.1. Quartz Surface and Tile
- 5.1.1.2. Fused Quartz Crucible
- 5.1.1.3. Quartz Glass
- 5.1.2. Quartz Crystal
- 5.1.3. Silicon Metal
- 5.1.1. High-purity Quartz
- 5.2. Market Analysis, Insights and Forecast - by End-user Industry
- 5.2.1. Electronics and Semiconductor
- 5.2.2. Solar
- 5.2.3. Buildings and Construction
- 5.2.4. Optical fiber and Telecommunication
- 5.2.5. Automotive
- 5.2.6. Other End-user Industries
- 5.3. Market Analysis, Insights and Forecast - by Region
- 5.3.1. Asia Pacific
- 5.3.2. North America
- 5.3.3. Europe
- 5.3.4. South America
- 5.3.5. Middle East
- 5.3.6. Saudi Arabia
- 5.1. Market Analysis, Insights and Forecast - by Type
- 6. Global Quartz Crystal Industry Analysis, Insights and Forecast, 2021-2033
- 6.1. Market Analysis, Insights and Forecast - by Type
- 6.1.1. High-purity Quartz
- 6.1.1.1. Quartz Surface and Tile
- 6.1.1.2. Fused Quartz Crucible
- 6.1.1.3. Quartz Glass
- 6.1.2. Quartz Crystal
- 6.1.3. Silicon Metal
- 6.1.1. High-purity Quartz
- 6.2. Market Analysis, Insights and Forecast - by End-user Industry
- 6.2.1. Electronics and Semiconductor
- 6.2.2. Solar
- 6.2.3. Buildings and Construction
- 6.2.4. Optical fiber and Telecommunication
- 6.2.5. Automotive
- 6.2.6. Other End-user Industries
- 6.1. Market Analysis, Insights and Forecast - by Type
- 7. Asia Pacific Quartz Crystal Industry Analysis, Insights and Forecast, 2020-2032
- 7.1. Market Analysis, Insights and Forecast - by Type
- 7.1.1. High-purity Quartz
- 7.1.1.1. Quartz Surface and Tile
- 7.1.1.2. Fused Quartz Crucible
- 7.1.1.3. Quartz Glass
- 7.1.2. Quartz Crystal
- 7.1.3. Silicon Metal
- 7.1.1. High-purity Quartz
- 7.2. Market Analysis, Insights and Forecast - by End-user Industry
- 7.2.1. Electronics and Semiconductor
- 7.2.2. Solar
- 7.2.3. Buildings and Construction
- 7.2.4. Optical fiber and Telecommunication
- 7.2.5. Automotive
- 7.2.6. Other End-user Industries
- 7.1. Market Analysis, Insights and Forecast - by Type
- 8. North America Quartz Crystal Industry Analysis, Insights and Forecast, 2020-2032
- 8.1. Market Analysis, Insights and Forecast - by Type
- 8.1.1. High-purity Quartz
- 8.1.1.1. Quartz Surface and Tile
- 8.1.1.2. Fused Quartz Crucible
- 8.1.1.3. Quartz Glass
- 8.1.2. Quartz Crystal
- 8.1.3. Silicon Metal
- 8.1.1. High-purity Quartz
- 8.2. Market Analysis, Insights and Forecast - by End-user Industry
- 8.2.1. Electronics and Semiconductor
- 8.2.2. Solar
- 8.2.3. Buildings and Construction
- 8.2.4. Optical fiber and Telecommunication
- 8.2.5. Automotive
- 8.2.6. Other End-user Industries
- 8.1. Market Analysis, Insights and Forecast - by Type
- 9. Europe Quartz Crystal Industry Analysis, Insights and Forecast, 2020-2032
- 9.1. Market Analysis, Insights and Forecast - by Type
- 9.1.1. High-purity Quartz
- 9.1.1.1. Quartz Surface and Tile
- 9.1.1.2. Fused Quartz Crucible
- 9.1.1.3. Quartz Glass
- 9.1.2. Quartz Crystal
- 9.1.3. Silicon Metal
- 9.1.1. High-purity Quartz
- 9.2. Market Analysis, Insights and Forecast - by End-user Industry
- 9.2.1. Electronics and Semiconductor
- 9.2.2. Solar
- 9.2.3. Buildings and Construction
- 9.2.4. Optical fiber and Telecommunication
- 9.2.5. Automotive
- 9.2.6. Other End-user Industries
- 9.1. Market Analysis, Insights and Forecast - by Type
- 10. South America Quartz Crystal Industry Analysis, Insights and Forecast, 2020-2032
- 10.1. Market Analysis, Insights and Forecast - by Type
- 10.1.1. High-purity Quartz
- 10.1.1.1. Quartz Surface and Tile
- 10.1.1.2. Fused Quartz Crucible
- 10.1.1.3. Quartz Glass
- 10.1.2. Quartz Crystal
- 10.1.3. Silicon Metal
- 10.1.1. High-purity Quartz
- 10.2. Market Analysis, Insights and Forecast - by End-user Industry
- 10.2.1. Electronics and Semiconductor
- 10.2.2. Solar
- 10.2.3. Buildings and Construction
- 10.2.4. Optical fiber and Telecommunication
- 10.2.5. Automotive
- 10.2.6. Other End-user Industries
- 10.1. Market Analysis, Insights and Forecast - by Type
- 11. Middle East Quartz Crystal Industry Analysis, Insights and Forecast, 2020-2032
- 11.1. Market Analysis, Insights and Forecast - by Type
- 11.1.1. High-purity Quartz
- 11.1.1.1. Quartz Surface and Tile
- 11.1.1.2. Fused Quartz Crucible
- 11.1.1.3. Quartz Glass
- 11.1.2. Quartz Crystal
- 11.1.3. Silicon Metal
- 11.1.1. High-purity Quartz
- 11.2. Market Analysis, Insights and Forecast - by End-user Industry
- 11.2.1. Electronics and Semiconductor
- 11.2.2. Solar
- 11.2.3. Buildings and Construction
- 11.2.4. Optical fiber and Telecommunication
- 11.2.5. Automotive
- 11.2.6. Other End-user Industries
- 11.1. Market Analysis, Insights and Forecast - by Type
- 12. Saudi Arabia Quartz Crystal Industry Analysis, Insights and Forecast, 2020-2032
- 12.1. Market Analysis, Insights and Forecast - by Type
- 12.1.1. High-purity Quartz
- 12.1.1.1. Quartz Surface and Tile
- 12.1.1.2. Fused Quartz Crucible
- 12.1.1.3. Quartz Glass
- 12.1.2. Quartz Crystal
- 12.1.3. Silicon Metal
- 12.1.1. High-purity Quartz
- 12.2. Market Analysis, Insights and Forecast - by End-user Industry
- 12.2.1. Electronics and Semiconductor
- 12.2.2. Solar
- 12.2.3. Buildings and Construction
- 12.2.4. Optical fiber and Telecommunication
- 12.2.5. Automotive
- 12.2.6. Other End-user Industries
- 12.1. Market Analysis, Insights and Forecast - by Type
- 13. Competitive Analysis
- 13.1. Company Profiles
- 13.1.1 Heraeus Holding
- 13.1.1.1. Company Overview
- 13.1.1.2. Products
- 13.1.1.3. Company Financials
- 13.1.1.4. SWOT Analysis
- 13.1.2 Jiangsu Pacific Quartz Co Ltd
- 13.1.2.1. Company Overview
- 13.1.2.2. Products
- 13.1.2.3. Company Financials
- 13.1.2.4. SWOT Analysis
- 13.1.3 Saint-Gobain
- 13.1.3.1. Company Overview
- 13.1.3.2. Products
- 13.1.3.3. Company Financials
- 13.1.3.4. SWOT Analysis
- 13.1.4 Ferroglobe
- 13.1.4.1. Company Overview
- 13.1.4.2. Products
- 13.1.4.3. Company Financials
- 13.1.4.4. SWOT Analysis
- 13.1.5 Elkem ASA
- 13.1.5.1. Company Overview
- 13.1.5.2. Products
- 13.1.5.3. Company Financials
- 13.1.5.4. SWOT Analysis
- 13.1.6 Wonic QnC Corporation
- 13.1.6.1. Company Overview
- 13.1.6.2. Products
- 13.1.6.3. Company Financials
- 13.1.6.4. SWOT Analysis
- 13.1.7 The Quartz Corporation*List Not Exhaustive
- 13.1.7.1. Company Overview
- 13.1.7.2. Products
- 13.1.7.3. Company Financials
- 13.1.7.4. SWOT Analysis
- 13.1.8 Nihon Dempa Kogyo Co Ltd
- 13.1.8.1. Company Overview
- 13.1.8.2. Products
- 13.1.8.3. Company Financials
- 13.1.8.4. SWOT Analysis
- 13.1.9 Sibelco
- 13.1.9.1. Company Overview
- 13.1.9.2. Products
- 13.1.9.3. Company Financials
- 13.1.9.4. SWOT Analysis
- 13.1.10 Nordic Mining ASA
- 13.1.10.1. Company Overview
- 13.1.10.2. Products
- 13.1.10.3. Company Financials
- 13.1.10.4. SWOT Analysis
- 13.1.11 SUMCO Corporation
- 13.1.11.1. Company Overview
- 13.1.11.2. Products
- 13.1.11.3. Company Financials
- 13.1.11.4. SWOT Analysis
- 13.1.12 Dow
- 13.1.12.1. Company Overview
- 13.1.12.2. Products
- 13.1.12.3. Company Financials
- 13.1.12.4. SWOT Analysis
- 13.1.13 RUSNANO Group
- 13.1.13.1. Company Overview
- 13.1.13.2. Products
- 13.1.13.3. Company Financials
- 13.1.13.4. SWOT Analysis
- 13.1.14 AGC Inc
- 13.1.14.1. Company Overview
- 13.1.14.2. Products
- 13.1.14.3. Company Financials
- 13.1.14.4. SWOT Analysis
- 13.1.15 Beijing Kai de Quartz Co Ltd
- 13.1.15.1. Company Overview
- 13.1.15.2. Products
- 13.1.15.3. Company Financials
- 13.1.15.4. SWOT Analysis
- 13.1.1 Heraeus Holding
- 13.2. Market Entropy
- 13.2.1 Company's Key Areas Served
- 13.2.2 Recent Developments
- 13.3. Company Market Share Analysis 2025
- 13.3.1 Top 5 Companies Market Share Analysis
- 13.3.2 Top 3 Companies Market Share Analysis
- 13.4. List of Potential Customers
- 14. Research Methodology
List of Figures
- Figure 1: Global Quartz Crystal Industry Revenue Breakdown (Million, %) by Region 2025 & 2033
- Figure 2: Asia Pacific Quartz Crystal Industry Revenue (Million), by Type 2025 & 2033
- Figure 3: Asia Pacific Quartz Crystal Industry Revenue Share (%), by Type 2025 & 2033
- Figure 4: Asia Pacific Quartz Crystal Industry Revenue (Million), by End-user Industry 2025 & 2033
- Figure 5: Asia Pacific Quartz Crystal Industry Revenue Share (%), by End-user Industry 2025 & 2033
- Figure 6: Asia Pacific Quartz Crystal Industry Revenue (Million), by Country 2025 & 2033
- Figure 7: Asia Pacific Quartz Crystal Industry Revenue Share (%), by Country 2025 & 2033
- Figure 8: North America Quartz Crystal Industry Revenue (Million), by Type 2025 & 2033
- Figure 9: North America Quartz Crystal Industry Revenue Share (%), by Type 2025 & 2033
- Figure 10: North America Quartz Crystal Industry Revenue (Million), by End-user Industry 2025 & 2033
- Figure 11: North America Quartz Crystal Industry Revenue Share (%), by End-user Industry 2025 & 2033
- Figure 12: North America Quartz Crystal Industry Revenue (Million), by Country 2025 & 2033
- Figure 13: North America Quartz Crystal Industry Revenue Share (%), by Country 2025 & 2033
- Figure 14: Europe Quartz Crystal Industry Revenue (Million), by Type 2025 & 2033
- Figure 15: Europe Quartz Crystal Industry Revenue Share (%), by Type 2025 & 2033
- Figure 16: Europe Quartz Crystal Industry Revenue (Million), by End-user Industry 2025 & 2033
- Figure 17: Europe Quartz Crystal Industry Revenue Share (%), by End-user Industry 2025 & 2033
- Figure 18: Europe Quartz Crystal Industry Revenue (Million), by Country 2025 & 2033
- Figure 19: Europe Quartz Crystal Industry Revenue Share (%), by Country 2025 & 2033
- Figure 20: South America Quartz Crystal Industry Revenue (Million), by Type 2025 & 2033
- Figure 21: South America Quartz Crystal Industry Revenue Share (%), by Type 2025 & 2033
- Figure 22: South America Quartz Crystal Industry Revenue (Million), by End-user Industry 2025 & 2033
- Figure 23: South America Quartz Crystal Industry Revenue Share (%), by End-user Industry 2025 & 2033
- Figure 24: South America Quartz Crystal Industry Revenue (Million), by Country 2025 & 2033
- Figure 25: South America Quartz Crystal Industry Revenue Share (%), by Country 2025 & 2033
- Figure 26: Middle East Quartz Crystal Industry Revenue (Million), by Type 2025 & 2033
- Figure 27: Middle East Quartz Crystal Industry Revenue Share (%), by Type 2025 & 2033
- Figure 28: Middle East Quartz Crystal Industry Revenue (Million), by End-user Industry 2025 & 2033
- Figure 29: Middle East Quartz Crystal Industry Revenue Share (%), by End-user Industry 2025 & 2033
- Figure 30: Middle East Quartz Crystal Industry Revenue (Million), by Country 2025 & 2033
- Figure 31: Middle East Quartz Crystal Industry Revenue Share (%), by Country 2025 & 2033
- Figure 32: Saudi Arabia Quartz Crystal Industry Revenue (Million), by Type 2025 & 2033
- Figure 33: Saudi Arabia Quartz Crystal Industry Revenue Share (%), by Type 2025 & 2033
- Figure 34: Saudi Arabia Quartz Crystal Industry Revenue (Million), by End-user Industry 2025 & 2033
- Figure 35: Saudi Arabia Quartz Crystal Industry Revenue Share (%), by End-user Industry 2025 & 2033
- Figure 36: Saudi Arabia Quartz Crystal Industry Revenue (Million), by Country 2025 & 2033
- Figure 37: Saudi Arabia Quartz Crystal Industry Revenue Share (%), by Country 2025 & 2033
List of Tables
- Table 1: Global Quartz Crystal Industry Revenue Million Forecast, by Type 2020 & 2033
- Table 2: Global Quartz Crystal Industry Revenue Million Forecast, by End-user Industry 2020 & 2033
- Table 3: Global Quartz Crystal Industry Revenue Million Forecast, by Region 2020 & 2033
- Table 4: Global Quartz Crystal Industry Revenue Million Forecast, by Type 2020 & 2033
- Table 5: Global Quartz Crystal Industry Revenue Million Forecast, by End-user Industry 2020 & 2033
- Table 6: Global Quartz Crystal Industry Revenue Million Forecast, by Country 2020 & 2033
- Table 7: China Quartz Crystal Industry Revenue (Million) Forecast, by Application 2020 & 2033
- Table 8: India Quartz Crystal Industry Revenue (Million) Forecast, by Application 2020 & 2033
- Table 9: Japan Quartz Crystal Industry Revenue (Million) Forecast, by Application 2020 & 2033
- Table 10: South Korea Quartz Crystal Industry Revenue (Million) Forecast, by Application 2020 & 2033
- Table 11: Rest of Asia Pacific Quartz Crystal Industry Revenue (Million) Forecast, by Application 2020 & 2033
- Table 12: Global Quartz Crystal Industry Revenue Million Forecast, by Type 2020 & 2033
- Table 13: Global Quartz Crystal Industry Revenue Million Forecast, by End-user Industry 2020 & 2033
- Table 14: Global Quartz Crystal Industry Revenue Million Forecast, by Country 2020 & 2033
- Table 15: United States Quartz Crystal Industry Revenue (Million) Forecast, by Application 2020 & 2033
- Table 16: Canada Quartz Crystal Industry Revenue (Million) Forecast, by Application 2020 & 2033
- Table 17: Mexico Quartz Crystal Industry Revenue (Million) Forecast, by Application 2020 & 2033
- Table 18: Global Quartz Crystal Industry Revenue Million Forecast, by Type 2020 & 2033
- Table 19: Global Quartz Crystal Industry Revenue Million Forecast, by End-user Industry 2020 & 2033
- Table 20: Global Quartz Crystal Industry Revenue Million Forecast, by Country 2020 & 2033
- Table 21: Germany Quartz Crystal Industry Revenue (Million) Forecast, by Application 2020 & 2033
- Table 22: United Kingdom Quartz Crystal Industry Revenue (Million) Forecast, by Application 2020 & 2033
- Table 23: Italy Quartz Crystal Industry Revenue (Million) Forecast, by Application 2020 & 2033
- Table 24: France Quartz Crystal Industry Revenue (Million) Forecast, by Application 2020 & 2033
- Table 25: Russia Quartz Crystal Industry Revenue (Million) Forecast, by Application 2020 & 2033
- Table 26: Rest of Europe Quartz Crystal Industry Revenue (Million) Forecast, by Application 2020 & 2033
- Table 27: Global Quartz Crystal Industry Revenue Million Forecast, by Type 2020 & 2033
- Table 28: Global Quartz Crystal Industry Revenue Million Forecast, by End-user Industry 2020 & 2033
- Table 29: Global Quartz Crystal Industry Revenue Million Forecast, by Country 2020 & 2033
- Table 30: Brazil Quartz Crystal Industry Revenue (Million) Forecast, by Application 2020 & 2033
- Table 31: Argentina Quartz Crystal Industry Revenue (Million) Forecast, by Application 2020 & 2033
- Table 32: Rest of South America Quartz Crystal Industry Revenue (Million) Forecast, by Application 2020 & 2033
- Table 33: Global Quartz Crystal Industry Revenue Million Forecast, by Type 2020 & 2033
- Table 34: Global Quartz Crystal Industry Revenue Million Forecast, by End-user Industry 2020 & 2033
- Table 35: Global Quartz Crystal Industry Revenue Million Forecast, by Country 2020 & 2033
- Table 36: Global Quartz Crystal Industry Revenue Million Forecast, by Type 2020 & 2033
- Table 37: Global Quartz Crystal Industry Revenue Million Forecast, by End-user Industry 2020 & 2033
- Table 38: Global Quartz Crystal Industry Revenue Million Forecast, by Country 2020 & 2033
- Table 39: South Africa Quartz Crystal Industry Revenue (Million) Forecast, by Application 2020 & 2033
- Table 40: Rest of Middle East Quartz Crystal Industry Revenue (Million) Forecast, by Application 2020 & 2033
Frequently Asked Questions
1. What is the projected Compound Annual Growth Rate (CAGR) of the Quartz Crystal Industry?
The projected CAGR is approximately 4.19%.
2. Which companies are prominent players in the Quartz Crystal Industry?
Key companies in the market include Heraeus Holding, Jiangsu Pacific Quartz Co Ltd, Saint-Gobain, Ferroglobe, Elkem ASA, Wonic QnC Corporation, The Quartz Corporation*List Not Exhaustive, Nihon Dempa Kogyo Co Ltd, Sibelco, Nordic Mining ASA, SUMCO Corporation, Dow, RUSNANO Group, AGC Inc, Beijing Kai de Quartz Co Ltd.
3. What are the main segments of the Quartz Crystal Industry?
The market segments include Type, End-user Industry.
4. Can you provide details about the market size?
The market size is estimated to be USD 7.31 Million as of 2022.
5. What are some drivers contributing to market growth?
Growing Solar Industry; Demand for High-purity Quartz in the Semiconductor Industry.
6. What are the notable trends driving market growth?
Rising Demand from the Electronics and Semiconductor Industry.
7. Are there any restraints impacting market growth?
Ecological Impact of Quartz Mining; Discoloration in Quartz Tiles and Slabs.
8. Can you provide examples of recent developments in the market?
December 2022: Sibelco acquired Bassanetti Group of Italy, which is a local player in the extraction, processing, and marketing of sand products in Southern Europe. This move will strengthen the company's positioning in Southern Europe.
9. What pricing options are available for accessing the report?
Pricing options include single-user, multi-user, and enterprise licenses priced at USD 4750, USD 5250, and USD 8750 respectively.
10. Is the market size provided in terms of value or volume?
The market size is provided in terms of value, measured in Million.
11. Are there any specific market keywords associated with the report?
Yes, the market keyword associated with the report is "Quartz Crystal Industry," which aids in identifying and referencing the specific market segment covered.
12. How do I determine which pricing option suits my needs best?
The pricing options vary based on user requirements and access needs. Individual users may opt for single-user licenses, while businesses requiring broader access may choose multi-user or enterprise licenses for cost-effective access to the report.
13. Are there any additional resources or data provided in the Quartz Crystal Industry report?
While the report offers comprehensive insights, it's advisable to review the specific contents or supplementary materials provided to ascertain if additional resources or data are available.
14. How can I stay updated on further developments or reports in the Quartz Crystal Industry?
To stay informed about further developments, trends, and reports in the Quartz Crystal Industry, consider subscribing to industry newsletters, following relevant companies and organizations, or regularly checking reputable industry news sources and publications.
Methodology
Step 1 - Identification of Relevant Samples Size from Population Database


Step 2 - Approaches for Defining Global Market Size (Value, Volume* & Price*)

Note*: In applicable scenarios
Step 3 - Data Sources
Primary Research
- Web Analytics
- Survey Reports
- Research Institute
- Latest Research Reports
- Opinion Leaders
Secondary Research
- Annual Reports
- White Paper
- Latest Press Release
- Industry Association
- Paid Database
- Investor Presentations

Step 4 - Data Triangulation
Involves using different sources of information in order to increase the validity of a study
These sources are likely to be stakeholders in a program - participants, other researchers, program staff, other community members, and so on.
Then we put all data in single framework & apply various statistical tools to find out the dynamic on the market.
During the analysis stage, feedback from the stakeholder groups would be compared to determine areas of agreement as well as areas of divergence