

Key Insights
The global polyurea market, valued at $1.02 billion in 2025, is projected to experience robust growth, exceeding a 5.6% Compound Annual Growth Rate (CAGR) through 2033. This expansion is driven by several key factors. The increasing demand for high-performance coatings in the construction sector, particularly for waterproofing and corrosion protection, is a major catalyst. Furthermore, the automotive industry's adoption of polyurea for lightweighting and enhanced durability in vehicles contributes significantly to market growth. The rising preference for environmentally friendly and durable coatings, coupled with advancements in spray application technology, further fuels market expansion. The diverse applications across various end-user industries, including paints and coatings, industrial manufacturing, and maritime sectors, contribute to the market's broad appeal. Segment-wise, hot polyurea applications currently hold a larger market share than cold polyurea due to their superior performance characteristics in specific applications. However, the cold polyurea segment is anticipated to witness faster growth owing to advancements increasing its versatility and applicability. Aromatic polyureas are expected to maintain a larger market share due to their superior mechanical properties compared to aliphatic polyureas. The geographical distribution indicates strong growth potential in the Asia-Pacific region, driven primarily by increasing construction activity and industrialization in countries like China and India. North America and Europe are also expected to witness substantial growth, fueled by ongoing infrastructure development and stringent environmental regulations promoting durable and eco-friendly coating solutions.
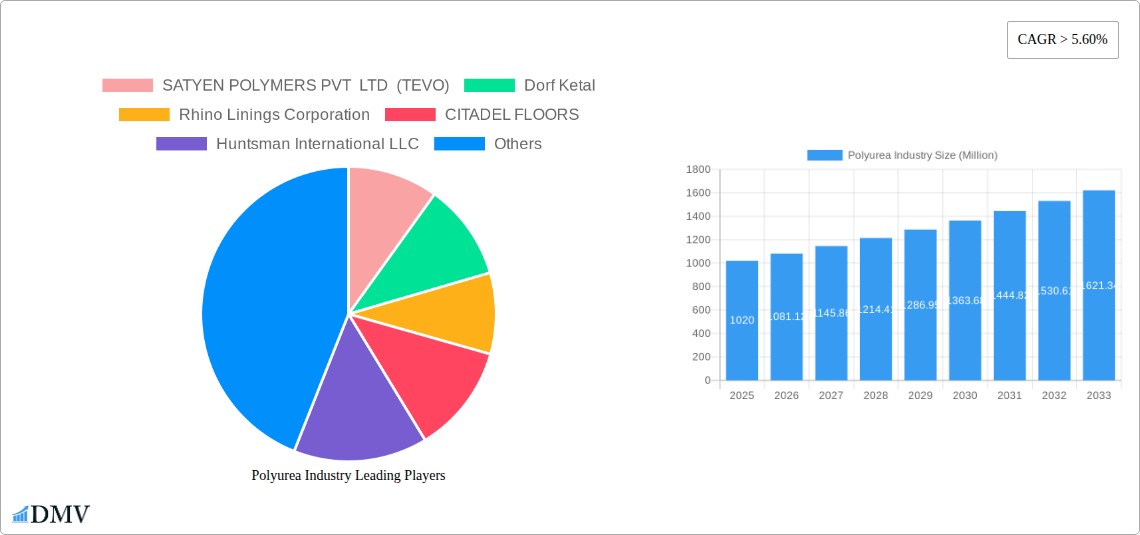
Polyurea Industry Market Size (In Billion)
The competitive landscape is characterized by a mix of large multinational corporations and specialized manufacturers. Key players are focused on product innovation, strategic partnerships, and geographical expansion to solidify their market positions. The market faces some restraints, including the relatively high cost of polyurea compared to traditional coatings and the specialized equipment required for application. However, the long-term benefits in terms of durability and performance are expected to outweigh these limitations, leading to continued market expansion. The forecast period will likely witness increased consolidation through mergers and acquisitions, further shaping the market dynamics and accelerating technological advancements. Specific market share data for individual companies or regions within the provided timeframe is not available; however, the aforementioned factors point towards consistent growth across all segments.
Polyurea Industry Company Market Share
Polyurea Industry Market Report: 2019-2033
This comprehensive report provides an in-depth analysis of the global polyurea industry, offering invaluable insights for stakeholders seeking to navigate this dynamic market. From market sizing and segmentation to future trends and opportunities, this report delivers a 360-degree view, covering the period 2019-2033, with a base year of 2025 and a forecast period of 2025-2033. The historical period analyzed is 2019-2024. The global market is expected to reach $xx Million by 2033.
Polyurea Industry Market Composition & Trends
This section meticulously examines the current state of the polyurea market, encompassing market concentration, innovation, regulations, substitute products, end-user profiles, and merger & acquisition (M&A) activities. The market is moderately fragmented with key players holding significant but not dominant shares. The top five companies – Huntsman International LLC, Covestro AG, Teknos Group, Dorf Ketal, and Rhino Linings Corporation – collectively hold an estimated 40% market share.
- Market Concentration: Moderately Fragmented. Top 5 companies hold approximately 40% market share.
- Innovation Catalysts: Increasing demand for high-performance coatings, advancements in spray application technology, and the development of sustainable polyurea formulations.
- Regulatory Landscape: Stringent environmental regulations concerning VOC emissions are driving the adoption of low-VOC polyurea formulations.
- Substitute Products: Epoxy coatings and polyurethane systems are major substitutes, but polyurea's superior properties (faster curing, high elasticity, and durability) provide a competitive edge.
- End-User Profiles: Construction, automotive, industrial, and maritime sectors are major end-users, with construction accounting for the largest share (approximately 35%).
- M&A Activities: The past five years have witnessed a moderate level of M&A activity, with deal values averaging approximately $xx Million per transaction. Consolidation is expected to increase in the coming years as companies seek to expand their market reach and product portfolios.
Polyurea Industry Evolution
This section details the historical and projected trajectory of the polyurea industry, exploring market growth, technological breakthroughs, and evolving consumer demands. The global polyurea market has witnessed significant growth over the past five years (2019-2024), expanding at a CAGR of approximately 10%. This growth is driven by factors such as rising demand for durable and protective coatings across various end-user industries. Technological advancements, particularly in spray equipment and formulation chemistry, have contributed significantly to market expansion. The shift towards sustainable and environmentally friendly polyurea formulations is also gaining traction, which we expect to maintain a CAGR of 8% during the forecast period (2025-2033), reaching an estimated $xx Million by 2033. Key drivers include increased infrastructure spending, advancements in automotive manufacturing, and growing demand for corrosion protection in the maritime industry. The adoption rate of cold polyurea systems is increasing due to their ease of application and lower energy consumption.
Leading Regions, Countries, or Segments in Polyurea Industry
North America currently dominates the global polyurea market, driven by robust construction activity and a strong presence of major manufacturers. However, Asia-Pacific is poised for significant growth due to rapid industrialization and infrastructural development.
Key Drivers:
- North America: Strong construction sector, high adoption of advanced technologies, and established manufacturing base.
- Asia-Pacific: Rapid infrastructure development, rising industrialization, and increasing disposable incomes.
- Europe: Growing awareness of sustainable solutions, stringent environmental regulations, and a focus on energy efficiency.
Dominant Segments:
- Chemical Structure: Aromatic polyureas currently hold a larger market share due to their superior mechanical properties. However, aliphatic polyureas are gaining traction due to their better UV resistance.
- Type: Cold polyurea is experiencing faster growth compared to hot polyurea owing to ease of application and reduced energy consumption.
- Product: Coatings represent the largest segment, followed by linings and sealants.
- End-user Industry: Construction is the leading end-user industry, followed by the automotive and industrial sectors.
Polyurea Industry Product Innovations
Recent product innovations have focused on developing high-performance polyurea formulations with improved UV resistance, enhanced flexibility, and lower VOC emissions. The introduction of water-based polyurea systems is gaining traction due to their eco-friendly nature. These advancements are expanding the application range of polyurea into new markets, such as renewable energy and aerospace. The development of self-healing polyurea coatings offers further opportunities for innovation in the long term.
Propelling Factors for Polyurea Industry Growth
Several factors fuel the polyurea market's growth. These include: rising demand for durable and protective coatings across diverse sectors, advancements in spray application technology enhancing efficiency and ease of use, increasing focus on sustainable and environmentally friendly solutions leading to low-VOC options, and robust infrastructural development globally fueling the construction sector's expansion, which is the leading consumer of polyurea products.
Obstacles in the Polyurea Industry Market
The polyurea industry faces challenges like the volatility of raw material prices, the potential for supply chain disruptions impacting production and delivery, and intense competition from alternative coating materials like epoxy and polyurethane. Regulatory hurdles related to VOC emissions, though driving innovation towards sustainable alternatives, also pose operational and compliance costs.
Future Opportunities in Polyurea Industry
Future opportunities lie in exploring new applications in rapidly developing sectors such as renewable energy infrastructure (wind turbine coatings), the expansion into niche markets like aerospace and medical devices demanding high-performance materials, and capitalizing on the increasing demand for sustainable and eco-friendly solutions which leads to market expansion in developing nations.
Major Players in the Polyurea Industry Ecosystem
- Huntsman International LLC
- Covestro AG
- Teknos Group
- Dorf Ketal
- Rhino Linings Corporation
- CITADEL FLOORS
- Elastothane
- Speciality Products Inc
- Lonza
- Armorthane
- SATYEN POLYMERS PVT LTD (TEVO)
Key Developments in Polyurea Industry Industry
- September 2022: Teknos Group opened a new Commercial and Competence Centre in Vietnam, boosting its presence in Asia and the polyurea market there.
- January 2023: Teknos Deutschland GmbH's production relocation to Brüggen aims to enhance its production and delivery capabilities in Germany, positively impacting the polyurea market in the region.
Strategic Polyurea Industry Market Forecast
The polyurea industry is poised for continued growth, driven by technological advancements, expanding applications across various end-user sectors, and the increasing demand for sustainable solutions. The market is projected to exhibit strong growth during the forecast period (2025-2033), driven by the factors already mentioned. Strategic investments in research and development, along with focused expansion into emerging markets, are crucial for companies seeking to capitalize on this growth potential.
Polyurea Industry Segmentation
-
1. Chemical Structure
- 1.1. Aromatic
- 1.2. Aliphatic
-
2. Type
- 2.1. Hot Polyurea
- 2.2. Cold Polyurea
-
3. Product
- 3.1. Lining
- 3.2. Coating
- 3.3. Sealants
-
4. End-user Industry
- 4.1. Construction
- 4.2. Paints and Coatings
- 4.3. Automotive
- 4.4. Industrial
- 4.5. Maritime
- 4.6. Other End-user Industries (Transportation, Etc.)
Polyurea Industry Segmentation By Geography
-
1. Asia Pacific
- 1.1. China
- 1.2. India
- 1.3. Japan
- 1.4. South Korea
- 1.5. Rest of Asia Pacific
-
2. North America
- 2.1. United States
- 2.2. Canada
- 2.3. Mexico
-
3. Europe
- 3.1. Germany
- 3.2. United Kingdom
- 3.3. France
- 3.4. Italy
- 3.5. Rest of Europe
-
4. South America
- 4.1. Brazil
- 4.2. Argentina
- 4.3. Rest of South America
-
5. Middle East and Africa
- 5.1. Saudi Arabia
- 5.2. South Africa
- 5.3. Rest of Middle East and Africa
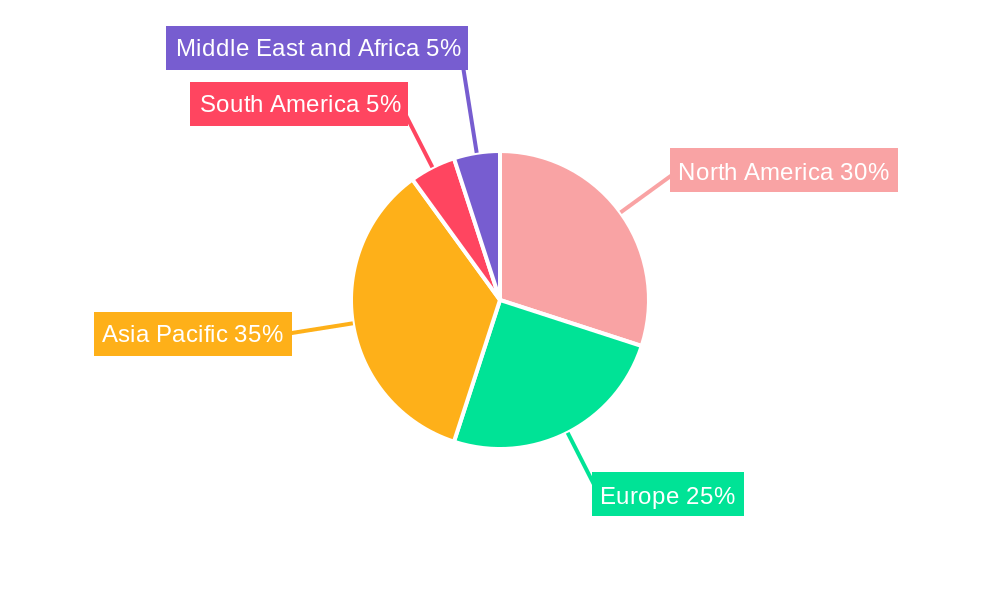
Polyurea Industry Regional Market Share
Geographic Coverage of Polyurea Industry
Polyurea Industry REPORT HIGHLIGHTS
| Aspects | Details |
|---|---|
| Study Period | 2020-2034 |
| Base Year | 2025 |
| Estimated Year | 2026 |
| Forecast Period | 2026-2034 |
| Historical Period | 2020-2025 |
| Growth Rate | CAGR of > 5.60% from 2020-2034 |
| Segmentation |
|
Table of Contents
- 1. Introduction
- 1.1. Research Scope
- 1.2. Market Segmentation
- 1.3. Research Objective
- 1.4. Definitions and Assumptions
- 2. Executive Summary
- 2.1. Market Snapshot
- 3. Market Dynamics
- 3.1. Market Drivers
- 3.2. Market Restrains
- 3.3. Market Trends
- 3.4. Market Opportunities
- 4. Market Factor Analysis
- 4.1. Porters Five Forces
- 4.1.1. Bargaining Power of Suppliers
- 4.1.2. Bargaining Power of Buyers
- 4.1.3. Threat of New Entrants
- 4.1.4. Threat of Substitutes
- 4.1.5. Competitive Rivalry
- 4.2. PESTEL analysis
- 4.3. BCG Analysis
- 4.3.1. Stars (High Growth, High Market Share)
- 4.3.2. Cash Cows (Low Growth, High Market Share)
- 4.3.3. Question Mark (High Growth, Low Market Share)
- 4.3.4. Dogs (Low Growth, Low Market Share)
- 4.4. Ansoff Matrix Analysis
- 4.5. Supply Chain Analysis
- 4.6. Regulatory Landscape
- 4.7. Current Market Potential and Opportunity Assessment (TAM–SAM–SOM Framework)
- 4.8. DMV Analyst Note
- 4.1. Porters Five Forces
- 5. Market Analysis, Insights and Forecast 2021-2033
- 5.1. Market Analysis, Insights and Forecast - by Chemical Structure
- 5.1.1. Aromatic
- 5.1.2. Aliphatic
- 5.2. Market Analysis, Insights and Forecast - by Type
- 5.2.1. Hot Polyurea
- 5.2.2. Cold Polyurea
- 5.3. Market Analysis, Insights and Forecast - by Product
- 5.3.1. Lining
- 5.3.2. Coating
- 5.3.3. Sealants
- 5.4. Market Analysis, Insights and Forecast - by End-user Industry
- 5.4.1. Construction
- 5.4.2. Paints and Coatings
- 5.4.3. Automotive
- 5.4.4. Industrial
- 5.4.5. Maritime
- 5.4.6. Other End-user Industries (Transportation, Etc.)
- 5.5. Market Analysis, Insights and Forecast - by Region
- 5.5.1. Asia Pacific
- 5.5.2. North America
- 5.5.3. Europe
- 5.5.4. South America
- 5.5.5. Middle East and Africa
- 5.1. Market Analysis, Insights and Forecast - by Chemical Structure
- 6. Global Polyurea Industry Analysis, Insights and Forecast, 2021-2033
- 6.1. Market Analysis, Insights and Forecast - by Chemical Structure
- 6.1.1. Aromatic
- 6.1.2. Aliphatic
- 6.2. Market Analysis, Insights and Forecast - by Type
- 6.2.1. Hot Polyurea
- 6.2.2. Cold Polyurea
- 6.3. Market Analysis, Insights and Forecast - by Product
- 6.3.1. Lining
- 6.3.2. Coating
- 6.3.3. Sealants
- 6.4. Market Analysis, Insights and Forecast - by End-user Industry
- 6.4.1. Construction
- 6.4.2. Paints and Coatings
- 6.4.3. Automotive
- 6.4.4. Industrial
- 6.4.5. Maritime
- 6.4.6. Other End-user Industries (Transportation, Etc.)
- 6.1. Market Analysis, Insights and Forecast - by Chemical Structure
- 7. Asia Pacific Polyurea Industry Analysis, Insights and Forecast, 2020-2032
- 7.1. Market Analysis, Insights and Forecast - by Chemical Structure
- 7.1.1. Aromatic
- 7.1.2. Aliphatic
- 7.2. Market Analysis, Insights and Forecast - by Type
- 7.2.1. Hot Polyurea
- 7.2.2. Cold Polyurea
- 7.3. Market Analysis, Insights and Forecast - by Product
- 7.3.1. Lining
- 7.3.2. Coating
- 7.3.3. Sealants
- 7.4. Market Analysis, Insights and Forecast - by End-user Industry
- 7.4.1. Construction
- 7.4.2. Paints and Coatings
- 7.4.3. Automotive
- 7.4.4. Industrial
- 7.4.5. Maritime
- 7.4.6. Other End-user Industries (Transportation, Etc.)
- 7.1. Market Analysis, Insights and Forecast - by Chemical Structure
- 8. North America Polyurea Industry Analysis, Insights and Forecast, 2020-2032
- 8.1. Market Analysis, Insights and Forecast - by Chemical Structure
- 8.1.1. Aromatic
- 8.1.2. Aliphatic
- 8.2. Market Analysis, Insights and Forecast - by Type
- 8.2.1. Hot Polyurea
- 8.2.2. Cold Polyurea
- 8.3. Market Analysis, Insights and Forecast - by Product
- 8.3.1. Lining
- 8.3.2. Coating
- 8.3.3. Sealants
- 8.4. Market Analysis, Insights and Forecast - by End-user Industry
- 8.4.1. Construction
- 8.4.2. Paints and Coatings
- 8.4.3. Automotive
- 8.4.4. Industrial
- 8.4.5. Maritime
- 8.4.6. Other End-user Industries (Transportation, Etc.)
- 8.1. Market Analysis, Insights and Forecast - by Chemical Structure
- 9. Europe Polyurea Industry Analysis, Insights and Forecast, 2020-2032
- 9.1. Market Analysis, Insights and Forecast - by Chemical Structure
- 9.1.1. Aromatic
- 9.1.2. Aliphatic
- 9.2. Market Analysis, Insights and Forecast - by Type
- 9.2.1. Hot Polyurea
- 9.2.2. Cold Polyurea
- 9.3. Market Analysis, Insights and Forecast - by Product
- 9.3.1. Lining
- 9.3.2. Coating
- 9.3.3. Sealants
- 9.4. Market Analysis, Insights and Forecast - by End-user Industry
- 9.4.1. Construction
- 9.4.2. Paints and Coatings
- 9.4.3. Automotive
- 9.4.4. Industrial
- 9.4.5. Maritime
- 9.4.6. Other End-user Industries (Transportation, Etc.)
- 9.1. Market Analysis, Insights and Forecast - by Chemical Structure
- 10. South America Polyurea Industry Analysis, Insights and Forecast, 2020-2032
- 10.1. Market Analysis, Insights and Forecast - by Chemical Structure
- 10.1.1. Aromatic
- 10.1.2. Aliphatic
- 10.2. Market Analysis, Insights and Forecast - by Type
- 10.2.1. Hot Polyurea
- 10.2.2. Cold Polyurea
- 10.3. Market Analysis, Insights and Forecast - by Product
- 10.3.1. Lining
- 10.3.2. Coating
- 10.3.3. Sealants
- 10.4. Market Analysis, Insights and Forecast - by End-user Industry
- 10.4.1. Construction
- 10.4.2. Paints and Coatings
- 10.4.3. Automotive
- 10.4.4. Industrial
- 10.4.5. Maritime
- 10.4.6. Other End-user Industries (Transportation, Etc.)
- 10.1. Market Analysis, Insights and Forecast - by Chemical Structure
- 11. Middle East and Africa Polyurea Industry Analysis, Insights and Forecast, 2020-2032
- 11.1. Market Analysis, Insights and Forecast - by Chemical Structure
- 11.1.1. Aromatic
- 11.1.2. Aliphatic
- 11.2. Market Analysis, Insights and Forecast - by Type
- 11.2.1. Hot Polyurea
- 11.2.2. Cold Polyurea
- 11.3. Market Analysis, Insights and Forecast - by Product
- 11.3.1. Lining
- 11.3.2. Coating
- 11.3.3. Sealants
- 11.4. Market Analysis, Insights and Forecast - by End-user Industry
- 11.4.1. Construction
- 11.4.2. Paints and Coatings
- 11.4.3. Automotive
- 11.4.4. Industrial
- 11.4.5. Maritime
- 11.4.6. Other End-user Industries (Transportation, Etc.)
- 11.1. Market Analysis, Insights and Forecast - by Chemical Structure
- 12. Competitive Analysis
- 12.1. Company Profiles
- 12.1.1 SATYEN POLYMERS PVT LTD (TEVO)
- 12.1.1.1. Company Overview
- 12.1.1.2. Products
- 12.1.1.3. Company Financials
- 12.1.1.4. SWOT Analysis
- 12.1.2 Dorf Ketal
- 12.1.2.1. Company Overview
- 12.1.2.2. Products
- 12.1.2.3. Company Financials
- 12.1.2.4. SWOT Analysis
- 12.1.3 Rhino Linings Corporation
- 12.1.3.1. Company Overview
- 12.1.3.2. Products
- 12.1.3.3. Company Financials
- 12.1.3.4. SWOT Analysis
- 12.1.4 CITADEL FLOORS
- 12.1.4.1. Company Overview
- 12.1.4.2. Products
- 12.1.4.3. Company Financials
- 12.1.4.4. SWOT Analysis
- 12.1.5 Huntsman International LLC
- 12.1.5.1. Company Overview
- 12.1.5.2. Products
- 12.1.5.3. Company Financials
- 12.1.5.4. SWOT Analysis
- 12.1.6 Elastothane
- 12.1.6.1. Company Overview
- 12.1.6.2. Products
- 12.1.6.3. Company Financials
- 12.1.6.4. SWOT Analysis
- 12.1.7 Speciality Products Inc
- 12.1.7.1. Company Overview
- 12.1.7.2. Products
- 12.1.7.3. Company Financials
- 12.1.7.4. SWOT Analysis
- 12.1.8 Teknos Group
- 12.1.8.1. Company Overview
- 12.1.8.2. Products
- 12.1.8.3. Company Financials
- 12.1.8.4. SWOT Analysis
- 12.1.9 Lonza
- 12.1.9.1. Company Overview
- 12.1.9.2. Products
- 12.1.9.3. Company Financials
- 12.1.9.4. SWOT Analysis
- 12.1.10 Covestro AG
- 12.1.10.1. Company Overview
- 12.1.10.2. Products
- 12.1.10.3. Company Financials
- 12.1.10.4. SWOT Analysis
- 12.1.11 Armorthane
- 12.1.11.1. Company Overview
- 12.1.11.2. Products
- 12.1.11.3. Company Financials
- 12.1.11.4. SWOT Analysis
- 12.1.1 SATYEN POLYMERS PVT LTD (TEVO)
- 12.2. Market Entropy
- 12.2.1 Company's Key Areas Served
- 12.2.2 Recent Developments
- 12.3. Company Market Share Analysis 2025
- 12.3.1 Top 5 Companies Market Share Analysis
- 12.3.2 Top 3 Companies Market Share Analysis
- 12.4. List of Potential Customers
- 13. Research Methodology
List of Figures
- Figure 1: Global Polyurea Industry Revenue Breakdown (Million, %) by Region 2025 & 2033
- Figure 2: Global Polyurea Industry Volume Breakdown (K Tons, %) by Region 2025 & 2033
- Figure 3: Asia Pacific Polyurea Industry Revenue (Million), by Chemical Structure 2025 & 2033
- Figure 4: Asia Pacific Polyurea Industry Volume (K Tons), by Chemical Structure 2025 & 2033
- Figure 5: Asia Pacific Polyurea Industry Revenue Share (%), by Chemical Structure 2025 & 2033
- Figure 6: Asia Pacific Polyurea Industry Volume Share (%), by Chemical Structure 2025 & 2033
- Figure 7: Asia Pacific Polyurea Industry Revenue (Million), by Type 2025 & 2033
- Figure 8: Asia Pacific Polyurea Industry Volume (K Tons), by Type 2025 & 2033
- Figure 9: Asia Pacific Polyurea Industry Revenue Share (%), by Type 2025 & 2033
- Figure 10: Asia Pacific Polyurea Industry Volume Share (%), by Type 2025 & 2033
- Figure 11: Asia Pacific Polyurea Industry Revenue (Million), by Product 2025 & 2033
- Figure 12: Asia Pacific Polyurea Industry Volume (K Tons), by Product 2025 & 2033
- Figure 13: Asia Pacific Polyurea Industry Revenue Share (%), by Product 2025 & 2033
- Figure 14: Asia Pacific Polyurea Industry Volume Share (%), by Product 2025 & 2033
- Figure 15: Asia Pacific Polyurea Industry Revenue (Million), by End-user Industry 2025 & 2033
- Figure 16: Asia Pacific Polyurea Industry Volume (K Tons), by End-user Industry 2025 & 2033
- Figure 17: Asia Pacific Polyurea Industry Revenue Share (%), by End-user Industry 2025 & 2033
- Figure 18: Asia Pacific Polyurea Industry Volume Share (%), by End-user Industry 2025 & 2033
- Figure 19: Asia Pacific Polyurea Industry Revenue (Million), by Country 2025 & 2033
- Figure 20: Asia Pacific Polyurea Industry Volume (K Tons), by Country 2025 & 2033
- Figure 21: Asia Pacific Polyurea Industry Revenue Share (%), by Country 2025 & 2033
- Figure 22: Asia Pacific Polyurea Industry Volume Share (%), by Country 2025 & 2033
- Figure 23: North America Polyurea Industry Revenue (Million), by Chemical Structure 2025 & 2033
- Figure 24: North America Polyurea Industry Volume (K Tons), by Chemical Structure 2025 & 2033
- Figure 25: North America Polyurea Industry Revenue Share (%), by Chemical Structure 2025 & 2033
- Figure 26: North America Polyurea Industry Volume Share (%), by Chemical Structure 2025 & 2033
- Figure 27: North America Polyurea Industry Revenue (Million), by Type 2025 & 2033
- Figure 28: North America Polyurea Industry Volume (K Tons), by Type 2025 & 2033
- Figure 29: North America Polyurea Industry Revenue Share (%), by Type 2025 & 2033
- Figure 30: North America Polyurea Industry Volume Share (%), by Type 2025 & 2033
- Figure 31: North America Polyurea Industry Revenue (Million), by Product 2025 & 2033
- Figure 32: North America Polyurea Industry Volume (K Tons), by Product 2025 & 2033
- Figure 33: North America Polyurea Industry Revenue Share (%), by Product 2025 & 2033
- Figure 34: North America Polyurea Industry Volume Share (%), by Product 2025 & 2033
- Figure 35: North America Polyurea Industry Revenue (Million), by End-user Industry 2025 & 2033
- Figure 36: North America Polyurea Industry Volume (K Tons), by End-user Industry 2025 & 2033
- Figure 37: North America Polyurea Industry Revenue Share (%), by End-user Industry 2025 & 2033
- Figure 38: North America Polyurea Industry Volume Share (%), by End-user Industry 2025 & 2033
- Figure 39: North America Polyurea Industry Revenue (Million), by Country 2025 & 2033
- Figure 40: North America Polyurea Industry Volume (K Tons), by Country 2025 & 2033
- Figure 41: North America Polyurea Industry Revenue Share (%), by Country 2025 & 2033
- Figure 42: North America Polyurea Industry Volume Share (%), by Country 2025 & 2033
- Figure 43: Europe Polyurea Industry Revenue (Million), by Chemical Structure 2025 & 2033
- Figure 44: Europe Polyurea Industry Volume (K Tons), by Chemical Structure 2025 & 2033
- Figure 45: Europe Polyurea Industry Revenue Share (%), by Chemical Structure 2025 & 2033
- Figure 46: Europe Polyurea Industry Volume Share (%), by Chemical Structure 2025 & 2033
- Figure 47: Europe Polyurea Industry Revenue (Million), by Type 2025 & 2033
- Figure 48: Europe Polyurea Industry Volume (K Tons), by Type 2025 & 2033
- Figure 49: Europe Polyurea Industry Revenue Share (%), by Type 2025 & 2033
- Figure 50: Europe Polyurea Industry Volume Share (%), by Type 2025 & 2033
- Figure 51: Europe Polyurea Industry Revenue (Million), by Product 2025 & 2033
- Figure 52: Europe Polyurea Industry Volume (K Tons), by Product 2025 & 2033
- Figure 53: Europe Polyurea Industry Revenue Share (%), by Product 2025 & 2033
- Figure 54: Europe Polyurea Industry Volume Share (%), by Product 2025 & 2033
- Figure 55: Europe Polyurea Industry Revenue (Million), by End-user Industry 2025 & 2033
- Figure 56: Europe Polyurea Industry Volume (K Tons), by End-user Industry 2025 & 2033
- Figure 57: Europe Polyurea Industry Revenue Share (%), by End-user Industry 2025 & 2033
- Figure 58: Europe Polyurea Industry Volume Share (%), by End-user Industry 2025 & 2033
- Figure 59: Europe Polyurea Industry Revenue (Million), by Country 2025 & 2033
- Figure 60: Europe Polyurea Industry Volume (K Tons), by Country 2025 & 2033
- Figure 61: Europe Polyurea Industry Revenue Share (%), by Country 2025 & 2033
- Figure 62: Europe Polyurea Industry Volume Share (%), by Country 2025 & 2033
- Figure 63: South America Polyurea Industry Revenue (Million), by Chemical Structure 2025 & 2033
- Figure 64: South America Polyurea Industry Volume (K Tons), by Chemical Structure 2025 & 2033
- Figure 65: South America Polyurea Industry Revenue Share (%), by Chemical Structure 2025 & 2033
- Figure 66: South America Polyurea Industry Volume Share (%), by Chemical Structure 2025 & 2033
- Figure 67: South America Polyurea Industry Revenue (Million), by Type 2025 & 2033
- Figure 68: South America Polyurea Industry Volume (K Tons), by Type 2025 & 2033
- Figure 69: South America Polyurea Industry Revenue Share (%), by Type 2025 & 2033
- Figure 70: South America Polyurea Industry Volume Share (%), by Type 2025 & 2033
- Figure 71: South America Polyurea Industry Revenue (Million), by Product 2025 & 2033
- Figure 72: South America Polyurea Industry Volume (K Tons), by Product 2025 & 2033
- Figure 73: South America Polyurea Industry Revenue Share (%), by Product 2025 & 2033
- Figure 74: South America Polyurea Industry Volume Share (%), by Product 2025 & 2033
- Figure 75: South America Polyurea Industry Revenue (Million), by End-user Industry 2025 & 2033
- Figure 76: South America Polyurea Industry Volume (K Tons), by End-user Industry 2025 & 2033
- Figure 77: South America Polyurea Industry Revenue Share (%), by End-user Industry 2025 & 2033
- Figure 78: South America Polyurea Industry Volume Share (%), by End-user Industry 2025 & 2033
- Figure 79: South America Polyurea Industry Revenue (Million), by Country 2025 & 2033
- Figure 80: South America Polyurea Industry Volume (K Tons), by Country 2025 & 2033
- Figure 81: South America Polyurea Industry Revenue Share (%), by Country 2025 & 2033
- Figure 82: South America Polyurea Industry Volume Share (%), by Country 2025 & 2033
- Figure 83: Middle East and Africa Polyurea Industry Revenue (Million), by Chemical Structure 2025 & 2033
- Figure 84: Middle East and Africa Polyurea Industry Volume (K Tons), by Chemical Structure 2025 & 2033
- Figure 85: Middle East and Africa Polyurea Industry Revenue Share (%), by Chemical Structure 2025 & 2033
- Figure 86: Middle East and Africa Polyurea Industry Volume Share (%), by Chemical Structure 2025 & 2033
- Figure 87: Middle East and Africa Polyurea Industry Revenue (Million), by Type 2025 & 2033
- Figure 88: Middle East and Africa Polyurea Industry Volume (K Tons), by Type 2025 & 2033
- Figure 89: Middle East and Africa Polyurea Industry Revenue Share (%), by Type 2025 & 2033
- Figure 90: Middle East and Africa Polyurea Industry Volume Share (%), by Type 2025 & 2033
- Figure 91: Middle East and Africa Polyurea Industry Revenue (Million), by Product 2025 & 2033
- Figure 92: Middle East and Africa Polyurea Industry Volume (K Tons), by Product 2025 & 2033
- Figure 93: Middle East and Africa Polyurea Industry Revenue Share (%), by Product 2025 & 2033
- Figure 94: Middle East and Africa Polyurea Industry Volume Share (%), by Product 2025 & 2033
- Figure 95: Middle East and Africa Polyurea Industry Revenue (Million), by End-user Industry 2025 & 2033
- Figure 96: Middle East and Africa Polyurea Industry Volume (K Tons), by End-user Industry 2025 & 2033
- Figure 97: Middle East and Africa Polyurea Industry Revenue Share (%), by End-user Industry 2025 & 2033
- Figure 98: Middle East and Africa Polyurea Industry Volume Share (%), by End-user Industry 2025 & 2033
- Figure 99: Middle East and Africa Polyurea Industry Revenue (Million), by Country 2025 & 2033
- Figure 100: Middle East and Africa Polyurea Industry Volume (K Tons), by Country 2025 & 2033
- Figure 101: Middle East and Africa Polyurea Industry Revenue Share (%), by Country 2025 & 2033
- Figure 102: Middle East and Africa Polyurea Industry Volume Share (%), by Country 2025 & 2033
List of Tables
- Table 1: Global Polyurea Industry Revenue Million Forecast, by Chemical Structure 2020 & 2033
- Table 2: Global Polyurea Industry Volume K Tons Forecast, by Chemical Structure 2020 & 2033
- Table 3: Global Polyurea Industry Revenue Million Forecast, by Type 2020 & 2033
- Table 4: Global Polyurea Industry Volume K Tons Forecast, by Type 2020 & 2033
- Table 5: Global Polyurea Industry Revenue Million Forecast, by Product 2020 & 2033
- Table 6: Global Polyurea Industry Volume K Tons Forecast, by Product 2020 & 2033
- Table 7: Global Polyurea Industry Revenue Million Forecast, by End-user Industry 2020 & 2033
- Table 8: Global Polyurea Industry Volume K Tons Forecast, by End-user Industry 2020 & 2033
- Table 9: Global Polyurea Industry Revenue Million Forecast, by Region 2020 & 2033
- Table 10: Global Polyurea Industry Volume K Tons Forecast, by Region 2020 & 2033
- Table 11: Global Polyurea Industry Revenue Million Forecast, by Chemical Structure 2020 & 2033
- Table 12: Global Polyurea Industry Volume K Tons Forecast, by Chemical Structure 2020 & 2033
- Table 13: Global Polyurea Industry Revenue Million Forecast, by Type 2020 & 2033
- Table 14: Global Polyurea Industry Volume K Tons Forecast, by Type 2020 & 2033
- Table 15: Global Polyurea Industry Revenue Million Forecast, by Product 2020 & 2033
- Table 16: Global Polyurea Industry Volume K Tons Forecast, by Product 2020 & 2033
- Table 17: Global Polyurea Industry Revenue Million Forecast, by End-user Industry 2020 & 2033
- Table 18: Global Polyurea Industry Volume K Tons Forecast, by End-user Industry 2020 & 2033
- Table 19: Global Polyurea Industry Revenue Million Forecast, by Country 2020 & 2033
- Table 20: Global Polyurea Industry Volume K Tons Forecast, by Country 2020 & 2033
- Table 21: China Polyurea Industry Revenue (Million) Forecast, by Application 2020 & 2033
- Table 22: China Polyurea Industry Volume (K Tons) Forecast, by Application 2020 & 2033
- Table 23: India Polyurea Industry Revenue (Million) Forecast, by Application 2020 & 2033
- Table 24: India Polyurea Industry Volume (K Tons) Forecast, by Application 2020 & 2033
- Table 25: Japan Polyurea Industry Revenue (Million) Forecast, by Application 2020 & 2033
- Table 26: Japan Polyurea Industry Volume (K Tons) Forecast, by Application 2020 & 2033
- Table 27: South Korea Polyurea Industry Revenue (Million) Forecast, by Application 2020 & 2033
- Table 28: South Korea Polyurea Industry Volume (K Tons) Forecast, by Application 2020 & 2033
- Table 29: Rest of Asia Pacific Polyurea Industry Revenue (Million) Forecast, by Application 2020 & 2033
- Table 30: Rest of Asia Pacific Polyurea Industry Volume (K Tons) Forecast, by Application 2020 & 2033
- Table 31: Global Polyurea Industry Revenue Million Forecast, by Chemical Structure 2020 & 2033
- Table 32: Global Polyurea Industry Volume K Tons Forecast, by Chemical Structure 2020 & 2033
- Table 33: Global Polyurea Industry Revenue Million Forecast, by Type 2020 & 2033
- Table 34: Global Polyurea Industry Volume K Tons Forecast, by Type 2020 & 2033
- Table 35: Global Polyurea Industry Revenue Million Forecast, by Product 2020 & 2033
- Table 36: Global Polyurea Industry Volume K Tons Forecast, by Product 2020 & 2033
- Table 37: Global Polyurea Industry Revenue Million Forecast, by End-user Industry 2020 & 2033
- Table 38: Global Polyurea Industry Volume K Tons Forecast, by End-user Industry 2020 & 2033
- Table 39: Global Polyurea Industry Revenue Million Forecast, by Country 2020 & 2033
- Table 40: Global Polyurea Industry Volume K Tons Forecast, by Country 2020 & 2033
- Table 41: United States Polyurea Industry Revenue (Million) Forecast, by Application 2020 & 2033
- Table 42: United States Polyurea Industry Volume (K Tons) Forecast, by Application 2020 & 2033
- Table 43: Canada Polyurea Industry Revenue (Million) Forecast, by Application 2020 & 2033
- Table 44: Canada Polyurea Industry Volume (K Tons) Forecast, by Application 2020 & 2033
- Table 45: Mexico Polyurea Industry Revenue (Million) Forecast, by Application 2020 & 2033
- Table 46: Mexico Polyurea Industry Volume (K Tons) Forecast, by Application 2020 & 2033
- Table 47: Global Polyurea Industry Revenue Million Forecast, by Chemical Structure 2020 & 2033
- Table 48: Global Polyurea Industry Volume K Tons Forecast, by Chemical Structure 2020 & 2033
- Table 49: Global Polyurea Industry Revenue Million Forecast, by Type 2020 & 2033
- Table 50: Global Polyurea Industry Volume K Tons Forecast, by Type 2020 & 2033
- Table 51: Global Polyurea Industry Revenue Million Forecast, by Product 2020 & 2033
- Table 52: Global Polyurea Industry Volume K Tons Forecast, by Product 2020 & 2033
- Table 53: Global Polyurea Industry Revenue Million Forecast, by End-user Industry 2020 & 2033
- Table 54: Global Polyurea Industry Volume K Tons Forecast, by End-user Industry 2020 & 2033
- Table 55: Global Polyurea Industry Revenue Million Forecast, by Country 2020 & 2033
- Table 56: Global Polyurea Industry Volume K Tons Forecast, by Country 2020 & 2033
- Table 57: Germany Polyurea Industry Revenue (Million) Forecast, by Application 2020 & 2033
- Table 58: Germany Polyurea Industry Volume (K Tons) Forecast, by Application 2020 & 2033
- Table 59: United Kingdom Polyurea Industry Revenue (Million) Forecast, by Application 2020 & 2033
- Table 60: United Kingdom Polyurea Industry Volume (K Tons) Forecast, by Application 2020 & 2033
- Table 61: France Polyurea Industry Revenue (Million) Forecast, by Application 2020 & 2033
- Table 62: France Polyurea Industry Volume (K Tons) Forecast, by Application 2020 & 2033
- Table 63: Italy Polyurea Industry Revenue (Million) Forecast, by Application 2020 & 2033
- Table 64: Italy Polyurea Industry Volume (K Tons) Forecast, by Application 2020 & 2033
- Table 65: Rest of Europe Polyurea Industry Revenue (Million) Forecast, by Application 2020 & 2033
- Table 66: Rest of Europe Polyurea Industry Volume (K Tons) Forecast, by Application 2020 & 2033
- Table 67: Global Polyurea Industry Revenue Million Forecast, by Chemical Structure 2020 & 2033
- Table 68: Global Polyurea Industry Volume K Tons Forecast, by Chemical Structure 2020 & 2033
- Table 69: Global Polyurea Industry Revenue Million Forecast, by Type 2020 & 2033
- Table 70: Global Polyurea Industry Volume K Tons Forecast, by Type 2020 & 2033
- Table 71: Global Polyurea Industry Revenue Million Forecast, by Product 2020 & 2033
- Table 72: Global Polyurea Industry Volume K Tons Forecast, by Product 2020 & 2033
- Table 73: Global Polyurea Industry Revenue Million Forecast, by End-user Industry 2020 & 2033
- Table 74: Global Polyurea Industry Volume K Tons Forecast, by End-user Industry 2020 & 2033
- Table 75: Global Polyurea Industry Revenue Million Forecast, by Country 2020 & 2033
- Table 76: Global Polyurea Industry Volume K Tons Forecast, by Country 2020 & 2033
- Table 77: Brazil Polyurea Industry Revenue (Million) Forecast, by Application 2020 & 2033
- Table 78: Brazil Polyurea Industry Volume (K Tons) Forecast, by Application 2020 & 2033
- Table 79: Argentina Polyurea Industry Revenue (Million) Forecast, by Application 2020 & 2033
- Table 80: Argentina Polyurea Industry Volume (K Tons) Forecast, by Application 2020 & 2033
- Table 81: Rest of South America Polyurea Industry Revenue (Million) Forecast, by Application 2020 & 2033
- Table 82: Rest of South America Polyurea Industry Volume (K Tons) Forecast, by Application 2020 & 2033
- Table 83: Global Polyurea Industry Revenue Million Forecast, by Chemical Structure 2020 & 2033
- Table 84: Global Polyurea Industry Volume K Tons Forecast, by Chemical Structure 2020 & 2033
- Table 85: Global Polyurea Industry Revenue Million Forecast, by Type 2020 & 2033
- Table 86: Global Polyurea Industry Volume K Tons Forecast, by Type 2020 & 2033
- Table 87: Global Polyurea Industry Revenue Million Forecast, by Product 2020 & 2033
- Table 88: Global Polyurea Industry Volume K Tons Forecast, by Product 2020 & 2033
- Table 89: Global Polyurea Industry Revenue Million Forecast, by End-user Industry 2020 & 2033
- Table 90: Global Polyurea Industry Volume K Tons Forecast, by End-user Industry 2020 & 2033
- Table 91: Global Polyurea Industry Revenue Million Forecast, by Country 2020 & 2033
- Table 92: Global Polyurea Industry Volume K Tons Forecast, by Country 2020 & 2033
- Table 93: Saudi Arabia Polyurea Industry Revenue (Million) Forecast, by Application 2020 & 2033
- Table 94: Saudi Arabia Polyurea Industry Volume (K Tons) Forecast, by Application 2020 & 2033
- Table 95: South Africa Polyurea Industry Revenue (Million) Forecast, by Application 2020 & 2033
- Table 96: South Africa Polyurea Industry Volume (K Tons) Forecast, by Application 2020 & 2033
- Table 97: Rest of Middle East and Africa Polyurea Industry Revenue (Million) Forecast, by Application 2020 & 2033
- Table 98: Rest of Middle East and Africa Polyurea Industry Volume (K Tons) Forecast, by Application 2020 & 2033
Frequently Asked Questions
1. What is the projected Compound Annual Growth Rate (CAGR) of the Polyurea Industry?
The projected CAGR is approximately > 5.60%.
2. Which companies are prominent players in the Polyurea Industry?
Key companies in the market include SATYEN POLYMERS PVT LTD (TEVO), Dorf Ketal, Rhino Linings Corporation, CITADEL FLOORS, Huntsman International LLC, Elastothane, Speciality Products Inc, Teknos Group, Lonza, Covestro AG, Armorthane.
3. What are the main segments of the Polyurea Industry?
The market segments include Chemical Structure, Type, Product, End-user Industry.
4. Can you provide details about the market size?
The market size is estimated to be USD 1.02 Million as of 2022.
5. What are some drivers contributing to market growth?
Growing Demand of Polyurea from Construction Industry; Growing Demand from Automotive Sector; Other Drivers.
6. What are the notable trends driving market growth?
Growing Demand for Polyurea from the Construction Industry.
7. Are there any restraints impacting market growth?
Volatility in Raw Material Price; Other Restraints.
8. Can you provide examples of recent developments in the market?
January 2023: Teknos Deutschland GmbH plans to relocate its production from Fulda to the existing Brüggen site. The relocation aims to develop further the production and delivery capabilities of Teknos Deutschland GmbH in Germany. This enhancement of production capabilities is likely to boost the market for polyurea in Germany.
9. What pricing options are available for accessing the report?
Pricing options include single-user, multi-user, and enterprise licenses priced at USD 4750, USD 5250, and USD 8750 respectively.
10. Is the market size provided in terms of value or volume?
The market size is provided in terms of value, measured in Million and volume, measured in K Tons.
11. Are there any specific market keywords associated with the report?
Yes, the market keyword associated with the report is "Polyurea Industry," which aids in identifying and referencing the specific market segment covered.
12. How do I determine which pricing option suits my needs best?
The pricing options vary based on user requirements and access needs. Individual users may opt for single-user licenses, while businesses requiring broader access may choose multi-user or enterprise licenses for cost-effective access to the report.
13. Are there any additional resources or data provided in the Polyurea Industry report?
While the report offers comprehensive insights, it's advisable to review the specific contents or supplementary materials provided to ascertain if additional resources or data are available.
14. How can I stay updated on further developments or reports in the Polyurea Industry?
To stay informed about further developments, trends, and reports in the Polyurea Industry, consider subscribing to industry newsletters, following relevant companies and organizations, or regularly checking reputable industry news sources and publications.
Methodology
Step 1 - Identification of Relevant Samples Size from Population Database


Step 2 - Approaches for Defining Global Market Size (Value, Volume* & Price*)

Note*: In applicable scenarios
Step 3 - Data Sources
Primary Research
- Web Analytics
- Survey Reports
- Research Institute
- Latest Research Reports
- Opinion Leaders
Secondary Research
- Annual Reports
- White Paper
- Latest Press Release
- Industry Association
- Paid Database
- Investor Presentations

Step 4 - Data Triangulation
Involves using different sources of information in order to increase the validity of a study
These sources are likely to be stakeholders in a program - participants, other researchers, program staff, other community members, and so on.
Then we put all data in single framework & apply various statistical tools to find out the dynamic on the market.
During the analysis stage, feedback from the stakeholder groups would be compared to determine areas of agreement as well as areas of divergence