

Key Insights
The global polyether amine market, valued at approximately 9.05 billion in 2025, is projected to experience robust expansion, exhibiting a compound annual growth rate (CAGR) of 13.56% from 2025 to 2033. This growth is propelled by increasing demand for high-performance coatings across automotive, construction, and electronics sectors, leveraging polyether amines' superior adhesion, flexibility, and chemical resistance for durable applications. Furthermore, the surge in sustainable material adoption drives demand as polyether amines offer an eco-friendlier alternative to traditional chemicals. The market is segmented by type (monoamine, diamine, triamine) and application (polyurea, fuel additives, composites, epoxy coatings, adhesives and sealants). Polyurea and epoxy coatings are expected to lead due to their widespread use in protective and industrial applications. Asia Pacific, particularly China and India, will be a key growth region driven by industrialization and infrastructure development. Challenges include raw material price volatility and potential environmental regulations. Continuous innovation and new application development will ensure a positive market outlook.
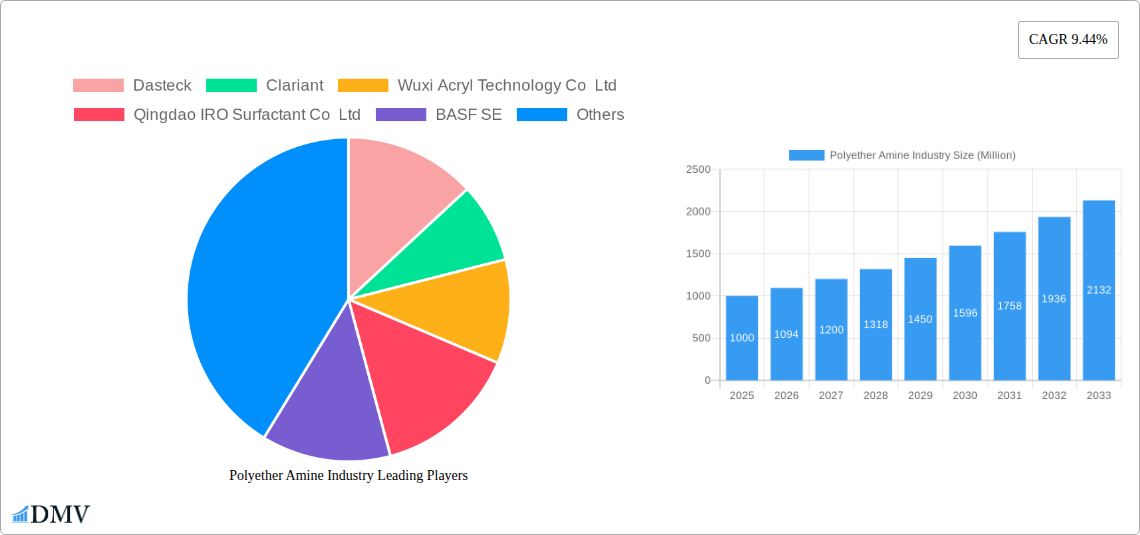
Polyether Amine Industry Market Size (In Billion)
The polyether amine market features a competitive landscape with major multinational corporations and specialized firms. Key players like BASF SE, Huntsman International LLC, and Clariant dominate through established manufacturing and distribution. Regional players are emerging in developing economies. Collaborations and strategic partnerships between manufacturers and end-users are increasing to develop bespoke solutions. Technological advancements focusing on enhanced performance, such as faster curing and improved durability, are key growth drivers. This innovation, combined with diversified sector demand, positions the polyether amine market for sustained success and dynamic evolution.

Polyether Amine Industry Company Market Share
Polyether Amine Industry Market Report: 2019-2033
This comprehensive report provides a detailed analysis of the Polyether Amine industry, offering invaluable insights for stakeholders seeking to understand market dynamics, future trends, and investment opportunities. The study covers the period from 2019 to 2033, with a focus on the forecast period from 2025 to 2033, using 2025 as the base year. The report uses Million as the unit for all values.
Polyether Amine Industry Market Composition & Trends
This section evaluates the competitive landscape, innovation drivers, regulatory environment, substitute products, end-user behavior, and merger & acquisition (M&A) activities within the polyether amine market. The global market size in 2025 is estimated at $XX Million. Market concentration is currently moderate, with several key players holding significant but not dominant shares. Innovation is driven by the need for higher-performance materials in diverse applications, particularly in the burgeoning renewable energy and advanced materials sectors. Stringent environmental regulations are shaping product development, pushing for more sustainable and less hazardous alternatives. Competitive pressures are intense, fueled by both established players and emerging entrants. M&A activity has been steady, with deals primarily focused on expanding product portfolios and geographic reach. Deal values have ranged from $XX Million to $XX Million in recent years.
- Market Share Distribution (2025): BASF SE (XX%), Huntsman International LLC (XX%), Clariant (XX%), Others (XX%).
- Key M&A Activities (2019-2024): Two significant acquisitions valued at $XX Million and $XX Million respectively, primarily focused on expanding geographic reach and product lines.
- Substitute Products: Polyols and other amine-based chemistries pose a competitive threat.
Polyether Amine Industry Evolution
The polyether amine market has witnessed significant growth over the past five years, driven by increasing demand across various end-use sectors. The historical period (2019-2024) showed a Compound Annual Growth Rate (CAGR) of XX%. Technological advancements, such as the development of more efficient synthesis methods and tailored product formulations, have been pivotal in this growth. The focus has shifted toward eco-friendly and high-performance polyether amines to meet stringent environmental regulations and evolving customer needs. The forecast period (2025-2033) is projected to show a CAGR of XX%, primarily fueled by expansion into emerging markets and the growing adoption of polyether amines in high-growth sectors like renewable energy and advanced materials. The adoption rate of new, specialized polyether amines is increasing at a rate of XX% annually. The market size is projected to reach $XX Million by 2033.
Leading Regions, Countries, or Segments in Polyether Amine Industry
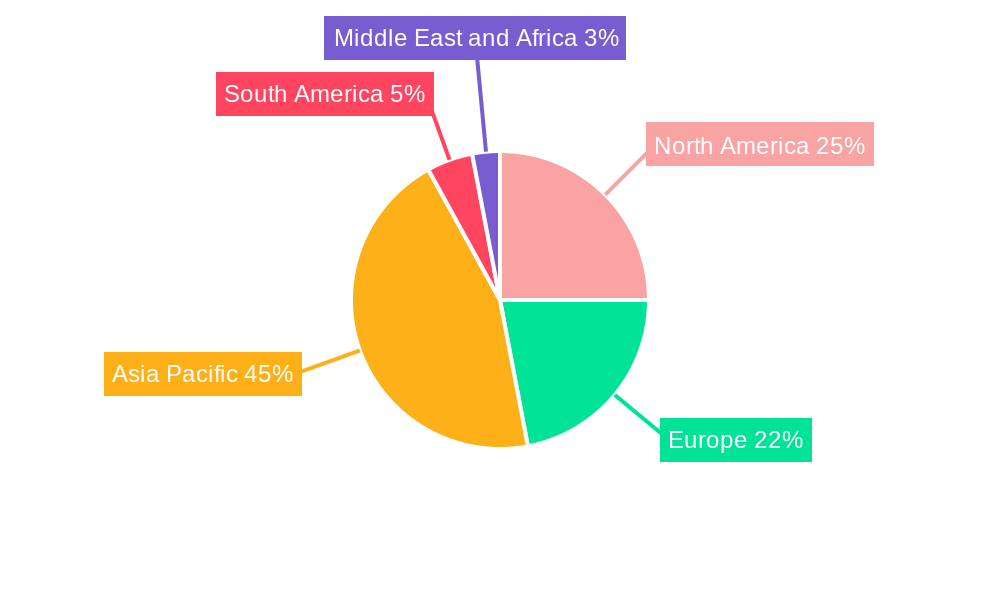
North America currently dominates the global polyether amine market, driven by robust demand from the automotive and construction sectors. Asia Pacific is anticipated to experience significant growth, propelled by rapid industrialization and infrastructure development. Within the product segments, the demand for diamines is highest, followed by triamines and monoamines. The polyurea application segment holds a substantial market share due to its wide usage in coatings and construction.
- Key Drivers for North America: Strong presence of major manufacturers, high demand from automotive and construction industries, supportive regulatory environment.
- Key Drivers for Asia Pacific: Rapid industrialization, increasing infrastructure development, growing automotive and construction sectors, cost-effective manufacturing.
- Dominant Application Segment: Polyurea coatings, due to its superior properties and applications in various industries like automotive, construction, and protective coatings.
Polyether Amine Industry Product Innovations
Recent innovations have focused on developing polyether amines with enhanced properties like improved adhesion, thermal stability, and UV resistance. These advancements have expanded the range of applications, leading to higher adoption rates in specialized industries like aerospace and electronics. The introduction of bio-based polyether amines further underscores the industry's commitment to sustainability.
Propelling Factors for Polyether Amine Industry Growth
The growth of the polyether amine market is driven by several factors. The increasing demand from the construction, automotive, and aerospace industries is a key factor. Technological advancements leading to improved product performance and efficiency are also significant drivers. Government regulations promoting sustainable materials are further boosting the market. The expansion into new applications, like renewable energy technologies, presents significant growth opportunities.
Obstacles in the Polyether Amine Industry Market
The polyether amine market faces several challenges, including fluctuations in raw material prices, stringent environmental regulations, and intense competition among major players. Supply chain disruptions can impact production and delivery timelines, affecting profitability. The need for continuous innovation to meet evolving customer demands also presents an ongoing challenge.
Future Opportunities in Polyether Amine Industry
Future opportunities lie in developing bio-based polyether amines, expanding into new applications like water treatment and oil & gas, and exploring new markets in developing economies. Focus on customized product formulations will also offer significant opportunities. The adoption of advanced manufacturing technologies and strategic partnerships will be key to capturing these opportunities.
Major Players in the Polyether Amine Industry Ecosystem
- Dasteck
- Clariant
- Wuxi Acryl Technology Co Ltd
- Qingdao IRO Surfactant Co Ltd
- BASF SE
- Huntsman International LLC
- Shanghai Chenhua International Trade Co Ltd
- Chia Tai New Materials (Zibo Zhengda Polyurethane Co Ltd)
Key Developments in Polyether Amine Industry Industry
- June 2022: BASF announced the expansion of its production capacity for specialty amines at the Geismar site in North America, aiming to be operational by mid-2023. This expansion will significantly increase the production of Baxxodur-branded polyetheramines.
- March 2022: Brenntag partnered with BASF SE to become the exclusive distributor of BASF's polyetheramines and Baxxodur portfolio in the United States and Canada, boosting market penetration and distribution reach.
Strategic Polyether Amine Industry Market Forecast
The polyether amine market is poised for continued growth, driven by technological advancements, expanding applications, and a growing focus on sustainability. The emergence of bio-based alternatives and the expansion into high-growth sectors will shape the market's trajectory. The market presents attractive opportunities for both established players and new entrants, promising substantial returns in the coming years.
Polyether Amine Industry Segmentation
-
1. Type
- 1.1. Monoamine
- 1.2. Diamine
- 1.3. Triamine
-
2. Application
- 2.1. Polyurea
- 2.2. Fuel Additives
- 2.3. Composites
- 2.4. Epoxy Coatings
- 2.5. Adhesives and Sealants
- 2.6. Other Applications
Polyether Amine Industry Segmentation By Geography
-
1. Asia Pacific
- 1.1. China
- 1.2. India
- 1.3. Japan
- 1.4. South Korea
- 1.5. Rest of Asia Pacific
-
2. North America
- 2.1. United States
- 2.2. Canada
- 2.3. Mexico
-
3. Europe
- 3.1. Germany
- 3.2. United Kingdom
- 3.3. Italy
- 3.4. France
- 3.5. Rest of Europe
-
4. South America
- 4.1. Brazil
- 4.2. Argentina
- 4.3. Rest of South America
-
5. Middle East and Africa
- 5.1. Saudi Arabia
- 5.2. South Africa
- 5.3. Rest of Middle East and Africa
Polyether Amine Industry Regional Market Share
Geographic Coverage of Polyether Amine Industry
Polyether Amine Industry REPORT HIGHLIGHTS
| Aspects | Details |
|---|---|
| Study Period | 2020-2034 |
| Base Year | 2025 |
| Estimated Year | 2026 |
| Forecast Period | 2026-2034 |
| Historical Period | 2020-2025 |
| Growth Rate | CAGR of 13.56% from 2020-2034 |
| Segmentation |
|
Table of Contents
- 1. Introduction
- 1.1. Research Scope
- 1.2. Market Segmentation
- 1.3. Research Objective
- 1.4. Definitions and Assumptions
- 2. Executive Summary
- 2.1. Market Snapshot
- 3. Market Dynamics
- 3.1. Market Drivers
- 3.2. Market Restrains
- 3.3. Market Trends
- 3.4. Market Opportunities
- 4. Market Factor Analysis
- 4.1. Porters Five Forces
- 4.1.1. Bargaining Power of Suppliers
- 4.1.2. Bargaining Power of Buyers
- 4.1.3. Threat of New Entrants
- 4.1.4. Threat of Substitutes
- 4.1.5. Competitive Rivalry
- 4.2. PESTEL analysis
- 4.3. BCG Analysis
- 4.3.1. Stars (High Growth, High Market Share)
- 4.3.2. Cash Cows (Low Growth, High Market Share)
- 4.3.3. Question Mark (High Growth, Low Market Share)
- 4.3.4. Dogs (Low Growth, Low Market Share)
- 4.4. Ansoff Matrix Analysis
- 4.5. Supply Chain Analysis
- 4.6. Regulatory Landscape
- 4.7. Current Market Potential and Opportunity Assessment (TAM–SAM–SOM Framework)
- 4.8. DMV Analyst Note
- 4.1. Porters Five Forces
- 5. Market Analysis, Insights and Forecast 2021-2033
- 5.1. Market Analysis, Insights and Forecast - by Type
- 5.1.1. Monoamine
- 5.1.2. Diamine
- 5.1.3. Triamine
- 5.2. Market Analysis, Insights and Forecast - by Application
- 5.2.1. Polyurea
- 5.2.2. Fuel Additives
- 5.2.3. Composites
- 5.2.4. Epoxy Coatings
- 5.2.5. Adhesives and Sealants
- 5.2.6. Other Applications
- 5.3. Market Analysis, Insights and Forecast - by Region
- 5.3.1. Asia Pacific
- 5.3.2. North America
- 5.3.3. Europe
- 5.3.4. South America
- 5.3.5. Middle East and Africa
- 5.1. Market Analysis, Insights and Forecast - by Type
- 6. Global Polyether Amine Industry Analysis, Insights and Forecast, 2021-2033
- 6.1. Market Analysis, Insights and Forecast - by Type
- 6.1.1. Monoamine
- 6.1.2. Diamine
- 6.1.3. Triamine
- 6.2. Market Analysis, Insights and Forecast - by Application
- 6.2.1. Polyurea
- 6.2.2. Fuel Additives
- 6.2.3. Composites
- 6.2.4. Epoxy Coatings
- 6.2.5. Adhesives and Sealants
- 6.2.6. Other Applications
- 6.1. Market Analysis, Insights and Forecast - by Type
- 7. Asia Pacific Polyether Amine Industry Analysis, Insights and Forecast, 2020-2032
- 7.1. Market Analysis, Insights and Forecast - by Type
- 7.1.1. Monoamine
- 7.1.2. Diamine
- 7.1.3. Triamine
- 7.2. Market Analysis, Insights and Forecast - by Application
- 7.2.1. Polyurea
- 7.2.2. Fuel Additives
- 7.2.3. Composites
- 7.2.4. Epoxy Coatings
- 7.2.5. Adhesives and Sealants
- 7.2.6. Other Applications
- 7.1. Market Analysis, Insights and Forecast - by Type
- 8. North America Polyether Amine Industry Analysis, Insights and Forecast, 2020-2032
- 8.1. Market Analysis, Insights and Forecast - by Type
- 8.1.1. Monoamine
- 8.1.2. Diamine
- 8.1.3. Triamine
- 8.2. Market Analysis, Insights and Forecast - by Application
- 8.2.1. Polyurea
- 8.2.2. Fuel Additives
- 8.2.3. Composites
- 8.2.4. Epoxy Coatings
- 8.2.5. Adhesives and Sealants
- 8.2.6. Other Applications
- 8.1. Market Analysis, Insights and Forecast - by Type
- 9. Europe Polyether Amine Industry Analysis, Insights and Forecast, 2020-2032
- 9.1. Market Analysis, Insights and Forecast - by Type
- 9.1.1. Monoamine
- 9.1.2. Diamine
- 9.1.3. Triamine
- 9.2. Market Analysis, Insights and Forecast - by Application
- 9.2.1. Polyurea
- 9.2.2. Fuel Additives
- 9.2.3. Composites
- 9.2.4. Epoxy Coatings
- 9.2.5. Adhesives and Sealants
- 9.2.6. Other Applications
- 9.1. Market Analysis, Insights and Forecast - by Type
- 10. South America Polyether Amine Industry Analysis, Insights and Forecast, 2020-2032
- 10.1. Market Analysis, Insights and Forecast - by Type
- 10.1.1. Monoamine
- 10.1.2. Diamine
- 10.1.3. Triamine
- 10.2. Market Analysis, Insights and Forecast - by Application
- 10.2.1. Polyurea
- 10.2.2. Fuel Additives
- 10.2.3. Composites
- 10.2.4. Epoxy Coatings
- 10.2.5. Adhesives and Sealants
- 10.2.6. Other Applications
- 10.1. Market Analysis, Insights and Forecast - by Type
- 11. Middle East and Africa Polyether Amine Industry Analysis, Insights and Forecast, 2020-2032
- 11.1. Market Analysis, Insights and Forecast - by Type
- 11.1.1. Monoamine
- 11.1.2. Diamine
- 11.1.3. Triamine
- 11.2. Market Analysis, Insights and Forecast - by Application
- 11.2.1. Polyurea
- 11.2.2. Fuel Additives
- 11.2.3. Composites
- 11.2.4. Epoxy Coatings
- 11.2.5. Adhesives and Sealants
- 11.2.6. Other Applications
- 11.1. Market Analysis, Insights and Forecast - by Type
- 12. Competitive Analysis
- 12.1. Company Profiles
- 12.1.1 Dasteck
- 12.1.1.1. Company Overview
- 12.1.1.2. Products
- 12.1.1.3. Company Financials
- 12.1.1.4. SWOT Analysis
- 12.1.2 Clariant
- 12.1.2.1. Company Overview
- 12.1.2.2. Products
- 12.1.2.3. Company Financials
- 12.1.2.4. SWOT Analysis
- 12.1.3 Wuxi Acryl Technology Co Ltd
- 12.1.3.1. Company Overview
- 12.1.3.2. Products
- 12.1.3.3. Company Financials
- 12.1.3.4. SWOT Analysis
- 12.1.4 Qingdao IRO Surfactant Co Ltd
- 12.1.4.1. Company Overview
- 12.1.4.2. Products
- 12.1.4.3. Company Financials
- 12.1.4.4. SWOT Analysis
- 12.1.5 BASF SE
- 12.1.5.1. Company Overview
- 12.1.5.2. Products
- 12.1.5.3. Company Financials
- 12.1.5.4. SWOT Analysis
- 12.1.6 Huntsman International LLC
- 12.1.6.1. Company Overview
- 12.1.6.2. Products
- 12.1.6.3. Company Financials
- 12.1.6.4. SWOT Analysis
- 12.1.7 Shanghai Chenhua International Trade Co Ltd
- 12.1.7.1. Company Overview
- 12.1.7.2. Products
- 12.1.7.3. Company Financials
- 12.1.7.4. SWOT Analysis
- 12.1.8 Chia Tai New Materials (Zibo Zhengda Polyurethane Co Ltd )
- 12.1.8.1. Company Overview
- 12.1.8.2. Products
- 12.1.8.3. Company Financials
- 12.1.8.4. SWOT Analysis
- 12.1.1 Dasteck
- 12.2. Market Entropy
- 12.2.1 Company's Key Areas Served
- 12.2.2 Recent Developments
- 12.3. Company Market Share Analysis 2025
- 12.3.1 Top 5 Companies Market Share Analysis
- 12.3.2 Top 3 Companies Market Share Analysis
- 12.4. List of Potential Customers
- 13. Research Methodology
List of Figures
- Figure 1: Global Polyether Amine Industry Revenue Breakdown (billion, %) by Region 2025 & 2033
- Figure 2: Global Polyether Amine Industry Volume Breakdown (kilotons, %) by Region 2025 & 2033
- Figure 3: Asia Pacific Polyether Amine Industry Revenue (billion), by Type 2025 & 2033
- Figure 4: Asia Pacific Polyether Amine Industry Volume (kilotons), by Type 2025 & 2033
- Figure 5: Asia Pacific Polyether Amine Industry Revenue Share (%), by Type 2025 & 2033
- Figure 6: Asia Pacific Polyether Amine Industry Volume Share (%), by Type 2025 & 2033
- Figure 7: Asia Pacific Polyether Amine Industry Revenue (billion), by Application 2025 & 2033
- Figure 8: Asia Pacific Polyether Amine Industry Volume (kilotons), by Application 2025 & 2033
- Figure 9: Asia Pacific Polyether Amine Industry Revenue Share (%), by Application 2025 & 2033
- Figure 10: Asia Pacific Polyether Amine Industry Volume Share (%), by Application 2025 & 2033
- Figure 11: Asia Pacific Polyether Amine Industry Revenue (billion), by Country 2025 & 2033
- Figure 12: Asia Pacific Polyether Amine Industry Volume (kilotons), by Country 2025 & 2033
- Figure 13: Asia Pacific Polyether Amine Industry Revenue Share (%), by Country 2025 & 2033
- Figure 14: Asia Pacific Polyether Amine Industry Volume Share (%), by Country 2025 & 2033
- Figure 15: North America Polyether Amine Industry Revenue (billion), by Type 2025 & 2033
- Figure 16: North America Polyether Amine Industry Volume (kilotons), by Type 2025 & 2033
- Figure 17: North America Polyether Amine Industry Revenue Share (%), by Type 2025 & 2033
- Figure 18: North America Polyether Amine Industry Volume Share (%), by Type 2025 & 2033
- Figure 19: North America Polyether Amine Industry Revenue (billion), by Application 2025 & 2033
- Figure 20: North America Polyether Amine Industry Volume (kilotons), by Application 2025 & 2033
- Figure 21: North America Polyether Amine Industry Revenue Share (%), by Application 2025 & 2033
- Figure 22: North America Polyether Amine Industry Volume Share (%), by Application 2025 & 2033
- Figure 23: North America Polyether Amine Industry Revenue (billion), by Country 2025 & 2033
- Figure 24: North America Polyether Amine Industry Volume (kilotons), by Country 2025 & 2033
- Figure 25: North America Polyether Amine Industry Revenue Share (%), by Country 2025 & 2033
- Figure 26: North America Polyether Amine Industry Volume Share (%), by Country 2025 & 2033
- Figure 27: Europe Polyether Amine Industry Revenue (billion), by Type 2025 & 2033
- Figure 28: Europe Polyether Amine Industry Volume (kilotons), by Type 2025 & 2033
- Figure 29: Europe Polyether Amine Industry Revenue Share (%), by Type 2025 & 2033
- Figure 30: Europe Polyether Amine Industry Volume Share (%), by Type 2025 & 2033
- Figure 31: Europe Polyether Amine Industry Revenue (billion), by Application 2025 & 2033
- Figure 32: Europe Polyether Amine Industry Volume (kilotons), by Application 2025 & 2033
- Figure 33: Europe Polyether Amine Industry Revenue Share (%), by Application 2025 & 2033
- Figure 34: Europe Polyether Amine Industry Volume Share (%), by Application 2025 & 2033
- Figure 35: Europe Polyether Amine Industry Revenue (billion), by Country 2025 & 2033
- Figure 36: Europe Polyether Amine Industry Volume (kilotons), by Country 2025 & 2033
- Figure 37: Europe Polyether Amine Industry Revenue Share (%), by Country 2025 & 2033
- Figure 38: Europe Polyether Amine Industry Volume Share (%), by Country 2025 & 2033
- Figure 39: South America Polyether Amine Industry Revenue (billion), by Type 2025 & 2033
- Figure 40: South America Polyether Amine Industry Volume (kilotons), by Type 2025 & 2033
- Figure 41: South America Polyether Amine Industry Revenue Share (%), by Type 2025 & 2033
- Figure 42: South America Polyether Amine Industry Volume Share (%), by Type 2025 & 2033
- Figure 43: South America Polyether Amine Industry Revenue (billion), by Application 2025 & 2033
- Figure 44: South America Polyether Amine Industry Volume (kilotons), by Application 2025 & 2033
- Figure 45: South America Polyether Amine Industry Revenue Share (%), by Application 2025 & 2033
- Figure 46: South America Polyether Amine Industry Volume Share (%), by Application 2025 & 2033
- Figure 47: South America Polyether Amine Industry Revenue (billion), by Country 2025 & 2033
- Figure 48: South America Polyether Amine Industry Volume (kilotons), by Country 2025 & 2033
- Figure 49: South America Polyether Amine Industry Revenue Share (%), by Country 2025 & 2033
- Figure 50: South America Polyether Amine Industry Volume Share (%), by Country 2025 & 2033
- Figure 51: Middle East and Africa Polyether Amine Industry Revenue (billion), by Type 2025 & 2033
- Figure 52: Middle East and Africa Polyether Amine Industry Volume (kilotons), by Type 2025 & 2033
- Figure 53: Middle East and Africa Polyether Amine Industry Revenue Share (%), by Type 2025 & 2033
- Figure 54: Middle East and Africa Polyether Amine Industry Volume Share (%), by Type 2025 & 2033
- Figure 55: Middle East and Africa Polyether Amine Industry Revenue (billion), by Application 2025 & 2033
- Figure 56: Middle East and Africa Polyether Amine Industry Volume (kilotons), by Application 2025 & 2033
- Figure 57: Middle East and Africa Polyether Amine Industry Revenue Share (%), by Application 2025 & 2033
- Figure 58: Middle East and Africa Polyether Amine Industry Volume Share (%), by Application 2025 & 2033
- Figure 59: Middle East and Africa Polyether Amine Industry Revenue (billion), by Country 2025 & 2033
- Figure 60: Middle East and Africa Polyether Amine Industry Volume (kilotons), by Country 2025 & 2033
- Figure 61: Middle East and Africa Polyether Amine Industry Revenue Share (%), by Country 2025 & 2033
- Figure 62: Middle East and Africa Polyether Amine Industry Volume Share (%), by Country 2025 & 2033
List of Tables
- Table 1: Global Polyether Amine Industry Revenue billion Forecast, by Type 2020 & 2033
- Table 2: Global Polyether Amine Industry Volume kilotons Forecast, by Type 2020 & 2033
- Table 3: Global Polyether Amine Industry Revenue billion Forecast, by Application 2020 & 2033
- Table 4: Global Polyether Amine Industry Volume kilotons Forecast, by Application 2020 & 2033
- Table 5: Global Polyether Amine Industry Revenue billion Forecast, by Region 2020 & 2033
- Table 6: Global Polyether Amine Industry Volume kilotons Forecast, by Region 2020 & 2033
- Table 7: Global Polyether Amine Industry Revenue billion Forecast, by Type 2020 & 2033
- Table 8: Global Polyether Amine Industry Volume kilotons Forecast, by Type 2020 & 2033
- Table 9: Global Polyether Amine Industry Revenue billion Forecast, by Application 2020 & 2033
- Table 10: Global Polyether Amine Industry Volume kilotons Forecast, by Application 2020 & 2033
- Table 11: Global Polyether Amine Industry Revenue billion Forecast, by Country 2020 & 2033
- Table 12: Global Polyether Amine Industry Volume kilotons Forecast, by Country 2020 & 2033
- Table 13: China Polyether Amine Industry Revenue (billion) Forecast, by Application 2020 & 2033
- Table 14: China Polyether Amine Industry Volume (kilotons) Forecast, by Application 2020 & 2033
- Table 15: India Polyether Amine Industry Revenue (billion) Forecast, by Application 2020 & 2033
- Table 16: India Polyether Amine Industry Volume (kilotons) Forecast, by Application 2020 & 2033
- Table 17: Japan Polyether Amine Industry Revenue (billion) Forecast, by Application 2020 & 2033
- Table 18: Japan Polyether Amine Industry Volume (kilotons) Forecast, by Application 2020 & 2033
- Table 19: South Korea Polyether Amine Industry Revenue (billion) Forecast, by Application 2020 & 2033
- Table 20: South Korea Polyether Amine Industry Volume (kilotons) Forecast, by Application 2020 & 2033
- Table 21: Rest of Asia Pacific Polyether Amine Industry Revenue (billion) Forecast, by Application 2020 & 2033
- Table 22: Rest of Asia Pacific Polyether Amine Industry Volume (kilotons) Forecast, by Application 2020 & 2033
- Table 23: Global Polyether Amine Industry Revenue billion Forecast, by Type 2020 & 2033
- Table 24: Global Polyether Amine Industry Volume kilotons Forecast, by Type 2020 & 2033
- Table 25: Global Polyether Amine Industry Revenue billion Forecast, by Application 2020 & 2033
- Table 26: Global Polyether Amine Industry Volume kilotons Forecast, by Application 2020 & 2033
- Table 27: Global Polyether Amine Industry Revenue billion Forecast, by Country 2020 & 2033
- Table 28: Global Polyether Amine Industry Volume kilotons Forecast, by Country 2020 & 2033
- Table 29: United States Polyether Amine Industry Revenue (billion) Forecast, by Application 2020 & 2033
- Table 30: United States Polyether Amine Industry Volume (kilotons) Forecast, by Application 2020 & 2033
- Table 31: Canada Polyether Amine Industry Revenue (billion) Forecast, by Application 2020 & 2033
- Table 32: Canada Polyether Amine Industry Volume (kilotons) Forecast, by Application 2020 & 2033
- Table 33: Mexico Polyether Amine Industry Revenue (billion) Forecast, by Application 2020 & 2033
- Table 34: Mexico Polyether Amine Industry Volume (kilotons) Forecast, by Application 2020 & 2033
- Table 35: Global Polyether Amine Industry Revenue billion Forecast, by Type 2020 & 2033
- Table 36: Global Polyether Amine Industry Volume kilotons Forecast, by Type 2020 & 2033
- Table 37: Global Polyether Amine Industry Revenue billion Forecast, by Application 2020 & 2033
- Table 38: Global Polyether Amine Industry Volume kilotons Forecast, by Application 2020 & 2033
- Table 39: Global Polyether Amine Industry Revenue billion Forecast, by Country 2020 & 2033
- Table 40: Global Polyether Amine Industry Volume kilotons Forecast, by Country 2020 & 2033
- Table 41: Germany Polyether Amine Industry Revenue (billion) Forecast, by Application 2020 & 2033
- Table 42: Germany Polyether Amine Industry Volume (kilotons) Forecast, by Application 2020 & 2033
- Table 43: United Kingdom Polyether Amine Industry Revenue (billion) Forecast, by Application 2020 & 2033
- Table 44: United Kingdom Polyether Amine Industry Volume (kilotons) Forecast, by Application 2020 & 2033
- Table 45: Italy Polyether Amine Industry Revenue (billion) Forecast, by Application 2020 & 2033
- Table 46: Italy Polyether Amine Industry Volume (kilotons) Forecast, by Application 2020 & 2033
- Table 47: France Polyether Amine Industry Revenue (billion) Forecast, by Application 2020 & 2033
- Table 48: France Polyether Amine Industry Volume (kilotons) Forecast, by Application 2020 & 2033
- Table 49: Rest of Europe Polyether Amine Industry Revenue (billion) Forecast, by Application 2020 & 2033
- Table 50: Rest of Europe Polyether Amine Industry Volume (kilotons) Forecast, by Application 2020 & 2033
- Table 51: Global Polyether Amine Industry Revenue billion Forecast, by Type 2020 & 2033
- Table 52: Global Polyether Amine Industry Volume kilotons Forecast, by Type 2020 & 2033
- Table 53: Global Polyether Amine Industry Revenue billion Forecast, by Application 2020 & 2033
- Table 54: Global Polyether Amine Industry Volume kilotons Forecast, by Application 2020 & 2033
- Table 55: Global Polyether Amine Industry Revenue billion Forecast, by Country 2020 & 2033
- Table 56: Global Polyether Amine Industry Volume kilotons Forecast, by Country 2020 & 2033
- Table 57: Brazil Polyether Amine Industry Revenue (billion) Forecast, by Application 2020 & 2033
- Table 58: Brazil Polyether Amine Industry Volume (kilotons) Forecast, by Application 2020 & 2033
- Table 59: Argentina Polyether Amine Industry Revenue (billion) Forecast, by Application 2020 & 2033
- Table 60: Argentina Polyether Amine Industry Volume (kilotons) Forecast, by Application 2020 & 2033
- Table 61: Rest of South America Polyether Amine Industry Revenue (billion) Forecast, by Application 2020 & 2033
- Table 62: Rest of South America Polyether Amine Industry Volume (kilotons) Forecast, by Application 2020 & 2033
- Table 63: Global Polyether Amine Industry Revenue billion Forecast, by Type 2020 & 2033
- Table 64: Global Polyether Amine Industry Volume kilotons Forecast, by Type 2020 & 2033
- Table 65: Global Polyether Amine Industry Revenue billion Forecast, by Application 2020 & 2033
- Table 66: Global Polyether Amine Industry Volume kilotons Forecast, by Application 2020 & 2033
- Table 67: Global Polyether Amine Industry Revenue billion Forecast, by Country 2020 & 2033
- Table 68: Global Polyether Amine Industry Volume kilotons Forecast, by Country 2020 & 2033
- Table 69: Saudi Arabia Polyether Amine Industry Revenue (billion) Forecast, by Application 2020 & 2033
- Table 70: Saudi Arabia Polyether Amine Industry Volume (kilotons) Forecast, by Application 2020 & 2033
- Table 71: South Africa Polyether Amine Industry Revenue (billion) Forecast, by Application 2020 & 2033
- Table 72: South Africa Polyether Amine Industry Volume (kilotons) Forecast, by Application 2020 & 2033
- Table 73: Rest of Middle East and Africa Polyether Amine Industry Revenue (billion) Forecast, by Application 2020 & 2033
- Table 74: Rest of Middle East and Africa Polyether Amine Industry Volume (kilotons) Forecast, by Application 2020 & 2033
Frequently Asked Questions
1. What is the projected Compound Annual Growth Rate (CAGR) of the Polyether Amine Industry?
The projected CAGR is approximately 13.56%.
2. Which companies are prominent players in the Polyether Amine Industry?
Key companies in the market include Dasteck, Clariant, Wuxi Acryl Technology Co Ltd , Qingdao IRO Surfactant Co Ltd, BASF SE, Huntsman International LLC, Shanghai Chenhua International Trade Co Ltd, Chia Tai New Materials (Zibo Zhengda Polyurethane Co Ltd ).
3. What are the main segments of the Polyether Amine Industry?
The market segments include Type, Application.
4. Can you provide details about the market size?
The market size is estimated to be USD 9.05 billion as of 2022.
5. What are some drivers contributing to market growth?
Increasing Demand from Construction Industry; Growing Trend of Eco-friendly and Renewable Energy Generation; Other Drivers.
6. What are the notable trends driving market growth?
Increasing Demand from Composite Application.
7. Are there any restraints impacting market growth?
Environmental Concern Due to Excessive Use of Polyetheramines; Other Restraints.
8. Can you provide examples of recent developments in the market?
June 2022: BASF made an announcement about the ongoing expansion of production capacity at the Geismar site in North America, with the aim of being on-stream by mid-2023. This expansion will focus on key specialty amines and will enable the production of more polyetheramines marketed under the Baxxodur brand.
9. What pricing options are available for accessing the report?
Pricing options include single-user, multi-user, and enterprise licenses priced at USD 4750, USD 5250, and USD 8750 respectively.
10. Is the market size provided in terms of value or volume?
The market size is provided in terms of value, measured in billion and volume, measured in kilotons.
11. Are there any specific market keywords associated with the report?
Yes, the market keyword associated with the report is "Polyether Amine Industry," which aids in identifying and referencing the specific market segment covered.
12. How do I determine which pricing option suits my needs best?
The pricing options vary based on user requirements and access needs. Individual users may opt for single-user licenses, while businesses requiring broader access may choose multi-user or enterprise licenses for cost-effective access to the report.
13. Are there any additional resources or data provided in the Polyether Amine Industry report?
While the report offers comprehensive insights, it's advisable to review the specific contents or supplementary materials provided to ascertain if additional resources or data are available.
14. How can I stay updated on further developments or reports in the Polyether Amine Industry?
To stay informed about further developments, trends, and reports in the Polyether Amine Industry, consider subscribing to industry newsletters, following relevant companies and organizations, or regularly checking reputable industry news sources and publications.
Methodology
Step 1 - Identification of Relevant Samples Size from Population Database


Step 2 - Approaches for Defining Global Market Size (Value, Volume* & Price*)

Note*: In applicable scenarios
Step 3 - Data Sources
Primary Research
- Web Analytics
- Survey Reports
- Research Institute
- Latest Research Reports
- Opinion Leaders
Secondary Research
- Annual Reports
- White Paper
- Latest Press Release
- Industry Association
- Paid Database
- Investor Presentations

Step 4 - Data Triangulation
Involves using different sources of information in order to increase the validity of a study
These sources are likely to be stakeholders in a program - participants, other researchers, program staff, other community members, and so on.
Then we put all data in single framework & apply various statistical tools to find out the dynamic on the market.
During the analysis stage, feedback from the stakeholder groups would be compared to determine areas of agreement as well as areas of divergence