

Key Insights
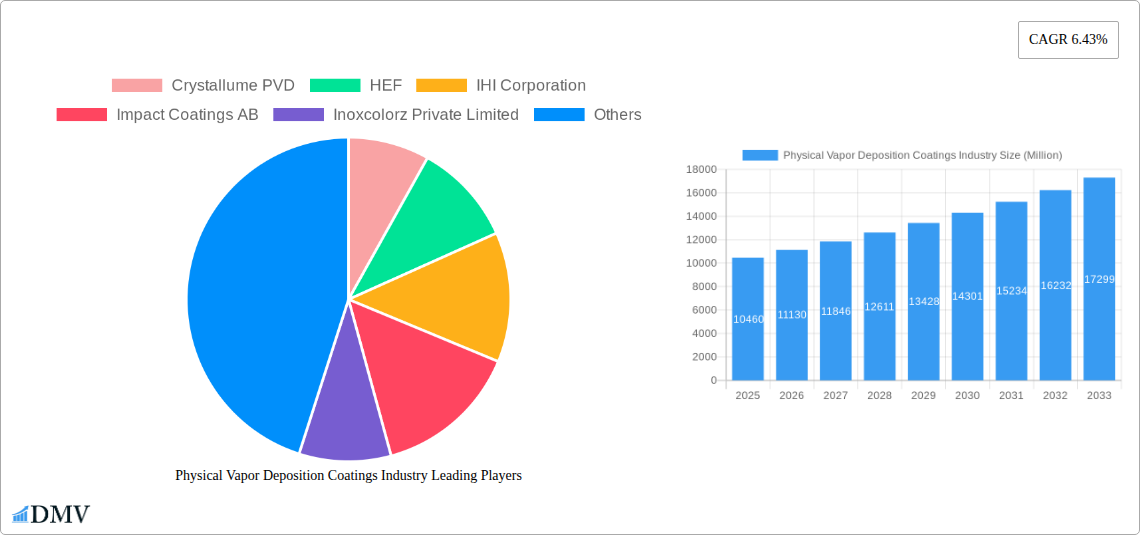
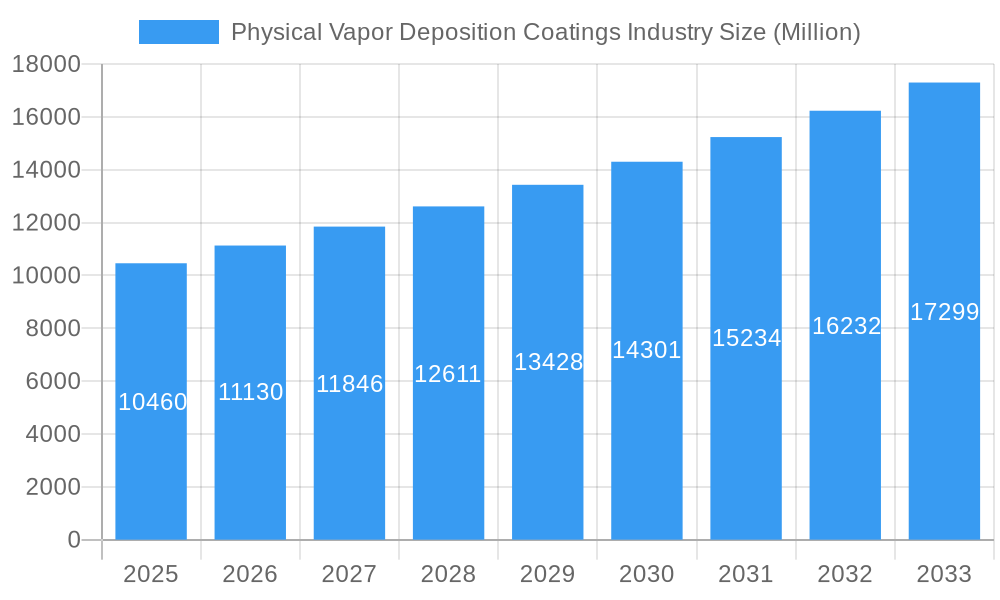
The Physical Vapor Deposition (PVD) coatings market, valued at $10.46 billion in 2025, is projected to experience robust growth, driven by increasing demand across diverse sectors. A Compound Annual Growth Rate (CAGR) of 6.43% from 2025 to 2033 indicates a significant expansion, reaching an estimated market size of approximately $18 billion by 2033. This growth is fueled by several key factors. The automotive industry's adoption of PVD coatings for enhanced durability and aesthetics in vehicle components is a significant driver. Similarly, the electronics industry utilizes PVD for improved performance and reliability in microelectronics and semiconductors. Furthermore, the growing demand for corrosion-resistant and wear-resistant coatings in aerospace, medical implants, and tooling applications further bolsters market expansion. Technological advancements leading to improved coating properties, such as enhanced hardness, lubricity, and adhesion, contribute to the market's positive trajectory. The increasing adoption of sustainable manufacturing practices also plays a crucial role, with PVD coatings offering environmentally friendly alternatives to traditional coating methods.
Physical Vapor Deposition Coatings Industry Market Size (In Billion)
However, certain restraints exist. The high initial investment costs associated with PVD equipment can pose a barrier to entry for smaller companies. Furthermore, the complexity of the PVD process and the need for skilled technicians can limit wider adoption. Nevertheless, ongoing research and development in the field are expected to mitigate these challenges, resulting in more efficient and cost-effective PVD coating solutions. Major players like Oerlikon, Mitsubishi Materials, and others are investing heavily in innovation and expansion, shaping the competitive landscape. Segmentation within the market, though not explicitly provided, likely includes variations in coating materials (e.g., titanium nitride, chromium nitride), application methods (e.g., sputtering, evaporation), and end-use industries. Future growth will depend on continuous innovation, strategic partnerships, and adapting to evolving industry demands.
Physical Vapor Deposition Coatings Industry Company Market Share
Physical Vapor Deposition (PVD) Coatings Industry Market Report: 2019-2033
This comprehensive report provides an in-depth analysis of the Physical Vapor Deposition (PVD) Coatings industry, offering invaluable insights for stakeholders seeking to navigate this dynamic market. Covering the period from 2019 to 2033, with a focus on 2025, this report analyzes market trends, technological advancements, and key players, enabling informed decision-making and strategic planning. The global PVD coatings market is projected to reach xx Million by 2033.
Physical Vapor Deposition Coatings Industry Market Composition & Trends
This section meticulously examines the competitive landscape of the PVD coatings market. We delve into market concentration, identifying key players such as OC Oerlikon Management AG, Mitsubishi Materials Corporation, and others, and analyzing their market share distribution. The report also investigates innovation catalysts, regulatory landscapes impacting the industry, substitute products posing challenges, and the evolving end-user profiles driving demand. Furthermore, a detailed overview of recent mergers and acquisitions (M&A) activities, including deal values (where available), is provided, highlighting the strategic shifts within the industry.
- Market Concentration: The market exhibits a [describe concentration - e.g., moderately concentrated] structure with the top 5 players holding approximately xx% of the market share in 2024.
- Innovation Catalysts: Focus on advancements in materials science, enabling the development of specialized coatings with enhanced properties.
- Regulatory Landscape: Stringent environmental regulations drive demand for eco-friendly PVD coating solutions.
- Substitute Products: Competition from alternative coating technologies, such as chemical vapor deposition (CVD), is analyzed.
- End-User Profiles: Key end-use sectors, including automotive, aerospace, electronics, and medical devices, are profiled.
- M&A Activities: Analysis of significant M&A deals in the past five years, with a focus on deal values and strategic implications (estimated total value of M&A deals in the historical period: xx Million).
Physical Vapor Deposition Coatings Industry Evolution
This section traces the evolution of the PVD coatings industry, analyzing market growth trajectories, technological advancements, and shifts in consumer demands throughout the study period (2019-2024). We examine historical growth rates and project future growth based on identified trends. Technological advancements such as the introduction of new coating materials and improved deposition techniques are explored, along with their impact on market penetration and adoption rates. The evolving demands of end-users, driven by factors like sustainability concerns and performance requirements, are also meticulously analyzed. This section further details shifts in consumer preferences (e.g., demand for specific coating properties) and their impact on the market. Detailed analysis of growth rates and adoption of new technologies will be provided. (Projected CAGR for 2025-2033: xx%).
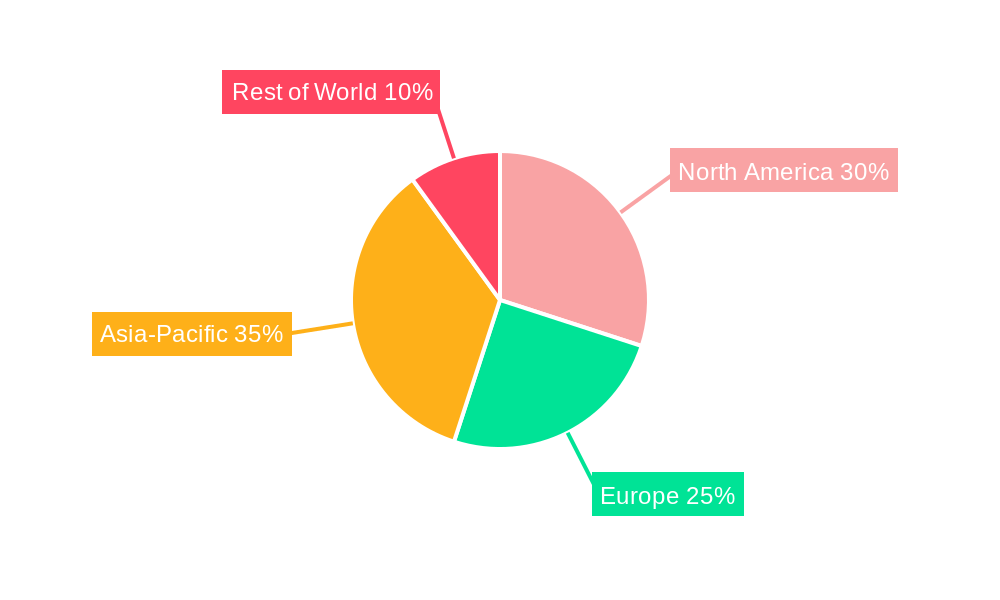
Leading Regions, Countries, or Segments in Physical Vapor Deposition Coatings Industry
This section identifies the leading regions, countries, and segments within the PVD coatings market. Through in-depth analysis, we determine the factors contributing to their dominance. This analysis involves a detailed examination of various influential factors.
- Key Drivers for Dominant Regions/Countries/Segments:
- Investment Trends: Analysis of investments in R&D, manufacturing capacity, and infrastructure development in leading regions.
- Regulatory Support: Evaluation of government policies and incentives fostering growth in specific regions/countries.
- Market Size and Growth Potential: Assessment of the current and projected market size for dominant regions/countries/segments.
[Detailed paragraph analysis of dominance factors, with specific data on leading regions, such as North America, Europe, Asia-Pacific. Quantifiable data on market share distribution will be included. Example: "Asia-Pacific is projected to dominate the market due to strong growth in the electronics and automotive industries."]
Physical Vapor Deposition Coatings Industry Product Innovations
Recent innovations in PVD coatings focus on enhancing properties such as hardness, wear resistance, corrosion resistance, and aesthetic appeal. New materials are being incorporated into coating formulations to meet increasingly stringent performance requirements across various end-use sectors. For example, advancements in nanotechnology are being leveraged to create coatings with unique functionalities such as self-cleaning or antimicrobial properties. The development of more sustainable and environmentally friendly PVD processes is also a significant area of focus, driven by growing environmental concerns.
Propelling Factors for Physical Vapor Deposition Coatings Industry Growth
The growth of the PVD coatings industry is driven by several key factors. Technological advancements, particularly in materials science and deposition techniques, are leading to the development of superior coatings with enhanced properties. Furthermore, the rising demand for high-performance materials across diverse end-use sectors, such as automotive, aerospace, and electronics, fuels market growth. Government regulations promoting the adoption of energy-efficient and environmentally friendly coating solutions also stimulate market expansion.
Obstacles in the Physical Vapor Deposition Coatings Industry Market
Despite the promising growth prospects, the PVD coatings industry faces certain challenges. Stringent environmental regulations necessitate costly upgrades to production processes, impacting profitability. Supply chain disruptions, especially in the procurement of raw materials, can lead to production delays and increased costs. The competitive landscape is characterized by intense rivalry among established players and emerging companies, leading to price pressures.
Future Opportunities in Physical Vapor Deposition Coatings Industry
Future opportunities in the PVD coatings industry lie in exploring niche applications, such as biomedical coatings and energy-related applications. The development of advanced coatings with unique functionalities, such as self-healing or superhydrophobic properties, presents significant potential. Furthermore, expanding into emerging markets and establishing strategic partnerships with key players in various end-use sectors offer avenues for growth.
Major Players in the Physical Vapor Deposition Coatings Industry Ecosystem
- Crystallume PVD
- HEF
- IHI Corporation
- Impact Coatings AB
- Inoxcolorz Private Limited
- KOLZER SRL
- Mitsubishi Materials Corporation
- OC Oerlikon Management AG
- Red Spot Paint & Varnish Company Inc
- Richter Precision Inc
- Sputtek Advanced Metallurgical Coatings
- Surface Modification Technologies
- TOCALO Co Ltd
- voestalpine eifeler Group
Key Developments in Physical Vapor Deposition Coatings Industry Industry
- January 2022: IHI Ionbond invested significantly in decorative coating capacity, purchasing a Hauzer Flexicoat 1500 PVD system.
- April 2022: Impact Coatings established a Chinese subsidiary in Shanghai, expanding its market reach for hydrogen solutions.
Strategic Physical Vapor Deposition Coatings Industry Market Forecast
The PVD coatings industry is poised for continued growth driven by technological innovation and increasing demand from diverse sectors. The development of novel coatings with enhanced properties and the expansion into new applications, particularly in the renewable energy and biomedical fields, will drive market expansion. Strategic partnerships and investments in research and development will play a crucial role in shaping the future of the industry, unlocking its vast potential in the coming years.
Physical Vapor Deposition Coatings Industry Segmentation
-
1. Substrate
- 1.1. Metals
- 1.2. Plastics
- 1.3. Glass
-
2. Material Type
- 2.1. Metals (Includes Alloys)
- 2.2. Ceramics
- 2.3. Other Material Types
-
3. End User
- 3.1. Tools
-
3.2. Components
- 3.2.1. Aerospace and Defense
- 3.2.2. Automotive
- 3.2.3. Electronics and Semiconductors (Including Optics)
- 3.2.4. Power Generation
- 3.2.5. Other Co
Physical Vapor Deposition Coatings Industry Segmentation By Geography
-
1. Asia Pacific
- 1.1. China
- 1.2. India
- 1.3. Japan
- 1.4. South Korea
- 1.5. Malaysia
- 1.6. Thailand
- 1.7. Indonesia
- 1.8. Vietnam
- 1.9. Rest of Asia Pacific
-
2. North America
- 2.1. United States
- 2.2. Canada
- 2.3. Mexico
-
3. Europe
- 3.1. Germany
- 3.2. United Kingdom
- 3.3. France
- 3.4. Italy
- 3.5. Spain
- 3.6. Turkey
- 3.7. Russia
- 3.8. NORDIC Countries
- 3.9. Rest of Europe
-
4. South America
- 4.1. Brazil
- 4.2. Argentina
- 4.3. Colombia
- 4.4. Rest of South America
-
5. Middle East and Africa
- 5.1. Saudi Arabia
- 5.2. Nigeria
- 5.3. Qatar
- 5.4. Egypt
- 5.5. United Arab Emirates
- 5.6. South Africa
- 5.7. Rest of Middle East and Africa
Physical Vapor Deposition Coatings Industry Regional Market Share
Geographic Coverage of Physical Vapor Deposition Coatings Industry
Physical Vapor Deposition Coatings Industry REPORT HIGHLIGHTS
| Aspects | Details |
|---|---|
| Study Period | 2020-2034 |
| Base Year | 2025 |
| Estimated Year | 2026 |
| Forecast Period | 2026-2034 |
| Historical Period | 2020-2025 |
| Growth Rate | CAGR of 6.43% from 2020-2034 |
| Segmentation |
|
Table of Contents
- 1. Introduction
- 1.1. Research Scope
- 1.2. Market Segmentation
- 1.3. Research Methodology
- 1.4. Definitions and Assumptions
- 2. Executive Summary
- 2.1. Introduction
- 3. Market Dynamics
- 3.1. Introduction
- 3.2. Market Drivers
- 3.2.1. Demand from the Electronics Sector; Increasing Usage in Medical Industry; Other Drivers
- 3.3. Market Restrains
- 3.3.1. Demand from the Electronics Sector; Increasing Usage in Medical Industry; Other Drivers
- 3.4. Market Trends
- 3.4.1. The Automotive Industry is Expected to Dominate the Market Studied
- 4. Market Factor Analysis
- 4.1. Porters Five Forces
- 4.2. Supply/Value Chain
- 4.3. PESTEL analysis
- 4.4. Market Entropy
- 4.5. Patent/Trademark Analysis
- 5. Global Physical Vapor Deposition Coatings Industry Analysis, Insights and Forecast, 2020-2032
- 5.1. Market Analysis, Insights and Forecast - by Substrate
- 5.1.1. Metals
- 5.1.2. Plastics
- 5.1.3. Glass
- 5.2. Market Analysis, Insights and Forecast - by Material Type
- 5.2.1. Metals (Includes Alloys)
- 5.2.2. Ceramics
- 5.2.3. Other Material Types
- 5.3. Market Analysis, Insights and Forecast - by End User
- 5.3.1. Tools
- 5.3.2. Components
- 5.3.2.1. Aerospace and Defense
- 5.3.2.2. Automotive
- 5.3.2.3. Electronics and Semiconductors (Including Optics)
- 5.3.2.4. Power Generation
- 5.3.2.5. Other Co
- 5.4. Market Analysis, Insights and Forecast - by Region
- 5.4.1. Asia Pacific
- 5.4.2. North America
- 5.4.3. Europe
- 5.4.4. South America
- 5.4.5. Middle East and Africa
- 5.1. Market Analysis, Insights and Forecast - by Substrate
- 6. Asia Pacific Physical Vapor Deposition Coatings Industry Analysis, Insights and Forecast, 2020-2032
- 6.1. Market Analysis, Insights and Forecast - by Substrate
- 6.1.1. Metals
- 6.1.2. Plastics
- 6.1.3. Glass
- 6.2. Market Analysis, Insights and Forecast - by Material Type
- 6.2.1. Metals (Includes Alloys)
- 6.2.2. Ceramics
- 6.2.3. Other Material Types
- 6.3. Market Analysis, Insights and Forecast - by End User
- 6.3.1. Tools
- 6.3.2. Components
- 6.3.2.1. Aerospace and Defense
- 6.3.2.2. Automotive
- 6.3.2.3. Electronics and Semiconductors (Including Optics)
- 6.3.2.4. Power Generation
- 6.3.2.5. Other Co
- 6.1. Market Analysis, Insights and Forecast - by Substrate
- 7. North America Physical Vapor Deposition Coatings Industry Analysis, Insights and Forecast, 2020-2032
- 7.1. Market Analysis, Insights and Forecast - by Substrate
- 7.1.1. Metals
- 7.1.2. Plastics
- 7.1.3. Glass
- 7.2. Market Analysis, Insights and Forecast - by Material Type
- 7.2.1. Metals (Includes Alloys)
- 7.2.2. Ceramics
- 7.2.3. Other Material Types
- 7.3. Market Analysis, Insights and Forecast - by End User
- 7.3.1. Tools
- 7.3.2. Components
- 7.3.2.1. Aerospace and Defense
- 7.3.2.2. Automotive
- 7.3.2.3. Electronics and Semiconductors (Including Optics)
- 7.3.2.4. Power Generation
- 7.3.2.5. Other Co
- 7.1. Market Analysis, Insights and Forecast - by Substrate
- 8. Europe Physical Vapor Deposition Coatings Industry Analysis, Insights and Forecast, 2020-2032
- 8.1. Market Analysis, Insights and Forecast - by Substrate
- 8.1.1. Metals
- 8.1.2. Plastics
- 8.1.3. Glass
- 8.2. Market Analysis, Insights and Forecast - by Material Type
- 8.2.1. Metals (Includes Alloys)
- 8.2.2. Ceramics
- 8.2.3. Other Material Types
- 8.3. Market Analysis, Insights and Forecast - by End User
- 8.3.1. Tools
- 8.3.2. Components
- 8.3.2.1. Aerospace and Defense
- 8.3.2.2. Automotive
- 8.3.2.3. Electronics and Semiconductors (Including Optics)
- 8.3.2.4. Power Generation
- 8.3.2.5. Other Co
- 8.1. Market Analysis, Insights and Forecast - by Substrate
- 9. South America Physical Vapor Deposition Coatings Industry Analysis, Insights and Forecast, 2020-2032
- 9.1. Market Analysis, Insights and Forecast - by Substrate
- 9.1.1. Metals
- 9.1.2. Plastics
- 9.1.3. Glass
- 9.2. Market Analysis, Insights and Forecast - by Material Type
- 9.2.1. Metals (Includes Alloys)
- 9.2.2. Ceramics
- 9.2.3. Other Material Types
- 9.3. Market Analysis, Insights and Forecast - by End User
- 9.3.1. Tools
- 9.3.2. Components
- 9.3.2.1. Aerospace and Defense
- 9.3.2.2. Automotive
- 9.3.2.3. Electronics and Semiconductors (Including Optics)
- 9.3.2.4. Power Generation
- 9.3.2.5. Other Co
- 9.1. Market Analysis, Insights and Forecast - by Substrate
- 10. Middle East and Africa Physical Vapor Deposition Coatings Industry Analysis, Insights and Forecast, 2020-2032
- 10.1. Market Analysis, Insights and Forecast - by Substrate
- 10.1.1. Metals
- 10.1.2. Plastics
- 10.1.3. Glass
- 10.2. Market Analysis, Insights and Forecast - by Material Type
- 10.2.1. Metals (Includes Alloys)
- 10.2.2. Ceramics
- 10.2.3. Other Material Types
- 10.3. Market Analysis, Insights and Forecast - by End User
- 10.3.1. Tools
- 10.3.2. Components
- 10.3.2.1. Aerospace and Defense
- 10.3.2.2. Automotive
- 10.3.2.3. Electronics and Semiconductors (Including Optics)
- 10.3.2.4. Power Generation
- 10.3.2.5. Other Co
- 10.1. Market Analysis, Insights and Forecast - by Substrate
- 11. Competitive Analysis
- 11.1. Global Market Share Analysis 2025
- 11.2. Company Profiles
- 11.2.1 Crystallume PVD
- 11.2.1.1. Overview
- 11.2.1.2. Products
- 11.2.1.3. SWOT Analysis
- 11.2.1.4. Recent Developments
- 11.2.1.5. Financials (Based on Availability)
- 11.2.2 HEF
- 11.2.2.1. Overview
- 11.2.2.2. Products
- 11.2.2.3. SWOT Analysis
- 11.2.2.4. Recent Developments
- 11.2.2.5. Financials (Based on Availability)
- 11.2.3 IHI Corporation
- 11.2.3.1. Overview
- 11.2.3.2. Products
- 11.2.3.3. SWOT Analysis
- 11.2.3.4. Recent Developments
- 11.2.3.5. Financials (Based on Availability)
- 11.2.4 Impact Coatings AB
- 11.2.4.1. Overview
- 11.2.4.2. Products
- 11.2.4.3. SWOT Analysis
- 11.2.4.4. Recent Developments
- 11.2.4.5. Financials (Based on Availability)
- 11.2.5 Inoxcolorz Private Limited
- 11.2.5.1. Overview
- 11.2.5.2. Products
- 11.2.5.3. SWOT Analysis
- 11.2.5.4. Recent Developments
- 11.2.5.5. Financials (Based on Availability)
- 11.2.6 KOLZER SRL
- 11.2.6.1. Overview
- 11.2.6.2. Products
- 11.2.6.3. SWOT Analysis
- 11.2.6.4. Recent Developments
- 11.2.6.5. Financials (Based on Availability)
- 11.2.7 Mitsubishi Materials Corporation
- 11.2.7.1. Overview
- 11.2.7.2. Products
- 11.2.7.3. SWOT Analysis
- 11.2.7.4. Recent Developments
- 11.2.7.5. Financials (Based on Availability)
- 11.2.8 OC Oerlikon Management AG
- 11.2.8.1. Overview
- 11.2.8.2. Products
- 11.2.8.3. SWOT Analysis
- 11.2.8.4. Recent Developments
- 11.2.8.5. Financials (Based on Availability)
- 11.2.9 Red Spot Paint & Varnish Company Inc
- 11.2.9.1. Overview
- 11.2.9.2. Products
- 11.2.9.3. SWOT Analysis
- 11.2.9.4. Recent Developments
- 11.2.9.5. Financials (Based on Availability)
- 11.2.10 Richter Precision Inc
- 11.2.10.1. Overview
- 11.2.10.2. Products
- 11.2.10.3. SWOT Analysis
- 11.2.10.4. Recent Developments
- 11.2.10.5. Financials (Based on Availability)
- 11.2.11 Sputtek Advanced Metallurgical Coatings
- 11.2.11.1. Overview
- 11.2.11.2. Products
- 11.2.11.3. SWOT Analysis
- 11.2.11.4. Recent Developments
- 11.2.11.5. Financials (Based on Availability)
- 11.2.12 Surface Modification Technologies
- 11.2.12.1. Overview
- 11.2.12.2. Products
- 11.2.12.3. SWOT Analysis
- 11.2.12.4. Recent Developments
- 11.2.12.5. Financials (Based on Availability)
- 11.2.13 TOCALO Co Ltd
- 11.2.13.1. Overview
- 11.2.13.2. Products
- 11.2.13.3. SWOT Analysis
- 11.2.13.4. Recent Developments
- 11.2.13.5. Financials (Based on Availability)
- 11.2.14 voestalpine eifeler Group*List Not Exhaustive
- 11.2.14.1. Overview
- 11.2.14.2. Products
- 11.2.14.3. SWOT Analysis
- 11.2.14.4. Recent Developments
- 11.2.14.5. Financials (Based on Availability)
- 11.2.1 Crystallume PVD
List of Figures
- Figure 1: Global Physical Vapor Deposition Coatings Industry Revenue Breakdown (Million, %) by Region 2025 & 2033
- Figure 2: Global Physical Vapor Deposition Coatings Industry Volume Breakdown (Billion, %) by Region 2025 & 2033
- Figure 3: Asia Pacific Physical Vapor Deposition Coatings Industry Revenue (Million), by Substrate 2025 & 2033
- Figure 4: Asia Pacific Physical Vapor Deposition Coatings Industry Volume (Billion), by Substrate 2025 & 2033
- Figure 5: Asia Pacific Physical Vapor Deposition Coatings Industry Revenue Share (%), by Substrate 2025 & 2033
- Figure 6: Asia Pacific Physical Vapor Deposition Coatings Industry Volume Share (%), by Substrate 2025 & 2033
- Figure 7: Asia Pacific Physical Vapor Deposition Coatings Industry Revenue (Million), by Material Type 2025 & 2033
- Figure 8: Asia Pacific Physical Vapor Deposition Coatings Industry Volume (Billion), by Material Type 2025 & 2033
- Figure 9: Asia Pacific Physical Vapor Deposition Coatings Industry Revenue Share (%), by Material Type 2025 & 2033
- Figure 10: Asia Pacific Physical Vapor Deposition Coatings Industry Volume Share (%), by Material Type 2025 & 2033
- Figure 11: Asia Pacific Physical Vapor Deposition Coatings Industry Revenue (Million), by End User 2025 & 2033
- Figure 12: Asia Pacific Physical Vapor Deposition Coatings Industry Volume (Billion), by End User 2025 & 2033
- Figure 13: Asia Pacific Physical Vapor Deposition Coatings Industry Revenue Share (%), by End User 2025 & 2033
- Figure 14: Asia Pacific Physical Vapor Deposition Coatings Industry Volume Share (%), by End User 2025 & 2033
- Figure 15: Asia Pacific Physical Vapor Deposition Coatings Industry Revenue (Million), by Country 2025 & 2033
- Figure 16: Asia Pacific Physical Vapor Deposition Coatings Industry Volume (Billion), by Country 2025 & 2033
- Figure 17: Asia Pacific Physical Vapor Deposition Coatings Industry Revenue Share (%), by Country 2025 & 2033
- Figure 18: Asia Pacific Physical Vapor Deposition Coatings Industry Volume Share (%), by Country 2025 & 2033
- Figure 19: North America Physical Vapor Deposition Coatings Industry Revenue (Million), by Substrate 2025 & 2033
- Figure 20: North America Physical Vapor Deposition Coatings Industry Volume (Billion), by Substrate 2025 & 2033
- Figure 21: North America Physical Vapor Deposition Coatings Industry Revenue Share (%), by Substrate 2025 & 2033
- Figure 22: North America Physical Vapor Deposition Coatings Industry Volume Share (%), by Substrate 2025 & 2033
- Figure 23: North America Physical Vapor Deposition Coatings Industry Revenue (Million), by Material Type 2025 & 2033
- Figure 24: North America Physical Vapor Deposition Coatings Industry Volume (Billion), by Material Type 2025 & 2033
- Figure 25: North America Physical Vapor Deposition Coatings Industry Revenue Share (%), by Material Type 2025 & 2033
- Figure 26: North America Physical Vapor Deposition Coatings Industry Volume Share (%), by Material Type 2025 & 2033
- Figure 27: North America Physical Vapor Deposition Coatings Industry Revenue (Million), by End User 2025 & 2033
- Figure 28: North America Physical Vapor Deposition Coatings Industry Volume (Billion), by End User 2025 & 2033
- Figure 29: North America Physical Vapor Deposition Coatings Industry Revenue Share (%), by End User 2025 & 2033
- Figure 30: North America Physical Vapor Deposition Coatings Industry Volume Share (%), by End User 2025 & 2033
- Figure 31: North America Physical Vapor Deposition Coatings Industry Revenue (Million), by Country 2025 & 2033
- Figure 32: North America Physical Vapor Deposition Coatings Industry Volume (Billion), by Country 2025 & 2033
- Figure 33: North America Physical Vapor Deposition Coatings Industry Revenue Share (%), by Country 2025 & 2033
- Figure 34: North America Physical Vapor Deposition Coatings Industry Volume Share (%), by Country 2025 & 2033
- Figure 35: Europe Physical Vapor Deposition Coatings Industry Revenue (Million), by Substrate 2025 & 2033
- Figure 36: Europe Physical Vapor Deposition Coatings Industry Volume (Billion), by Substrate 2025 & 2033
- Figure 37: Europe Physical Vapor Deposition Coatings Industry Revenue Share (%), by Substrate 2025 & 2033
- Figure 38: Europe Physical Vapor Deposition Coatings Industry Volume Share (%), by Substrate 2025 & 2033
- Figure 39: Europe Physical Vapor Deposition Coatings Industry Revenue (Million), by Material Type 2025 & 2033
- Figure 40: Europe Physical Vapor Deposition Coatings Industry Volume (Billion), by Material Type 2025 & 2033
- Figure 41: Europe Physical Vapor Deposition Coatings Industry Revenue Share (%), by Material Type 2025 & 2033
- Figure 42: Europe Physical Vapor Deposition Coatings Industry Volume Share (%), by Material Type 2025 & 2033
- Figure 43: Europe Physical Vapor Deposition Coatings Industry Revenue (Million), by End User 2025 & 2033
- Figure 44: Europe Physical Vapor Deposition Coatings Industry Volume (Billion), by End User 2025 & 2033
- Figure 45: Europe Physical Vapor Deposition Coatings Industry Revenue Share (%), by End User 2025 & 2033
- Figure 46: Europe Physical Vapor Deposition Coatings Industry Volume Share (%), by End User 2025 & 2033
- Figure 47: Europe Physical Vapor Deposition Coatings Industry Revenue (Million), by Country 2025 & 2033
- Figure 48: Europe Physical Vapor Deposition Coatings Industry Volume (Billion), by Country 2025 & 2033
- Figure 49: Europe Physical Vapor Deposition Coatings Industry Revenue Share (%), by Country 2025 & 2033
- Figure 50: Europe Physical Vapor Deposition Coatings Industry Volume Share (%), by Country 2025 & 2033
- Figure 51: South America Physical Vapor Deposition Coatings Industry Revenue (Million), by Substrate 2025 & 2033
- Figure 52: South America Physical Vapor Deposition Coatings Industry Volume (Billion), by Substrate 2025 & 2033
- Figure 53: South America Physical Vapor Deposition Coatings Industry Revenue Share (%), by Substrate 2025 & 2033
- Figure 54: South America Physical Vapor Deposition Coatings Industry Volume Share (%), by Substrate 2025 & 2033
- Figure 55: South America Physical Vapor Deposition Coatings Industry Revenue (Million), by Material Type 2025 & 2033
- Figure 56: South America Physical Vapor Deposition Coatings Industry Volume (Billion), by Material Type 2025 & 2033
- Figure 57: South America Physical Vapor Deposition Coatings Industry Revenue Share (%), by Material Type 2025 & 2033
- Figure 58: South America Physical Vapor Deposition Coatings Industry Volume Share (%), by Material Type 2025 & 2033
- Figure 59: South America Physical Vapor Deposition Coatings Industry Revenue (Million), by End User 2025 & 2033
- Figure 60: South America Physical Vapor Deposition Coatings Industry Volume (Billion), by End User 2025 & 2033
- Figure 61: South America Physical Vapor Deposition Coatings Industry Revenue Share (%), by End User 2025 & 2033
- Figure 62: South America Physical Vapor Deposition Coatings Industry Volume Share (%), by End User 2025 & 2033
- Figure 63: South America Physical Vapor Deposition Coatings Industry Revenue (Million), by Country 2025 & 2033
- Figure 64: South America Physical Vapor Deposition Coatings Industry Volume (Billion), by Country 2025 & 2033
- Figure 65: South America Physical Vapor Deposition Coatings Industry Revenue Share (%), by Country 2025 & 2033
- Figure 66: South America Physical Vapor Deposition Coatings Industry Volume Share (%), by Country 2025 & 2033
- Figure 67: Middle East and Africa Physical Vapor Deposition Coatings Industry Revenue (Million), by Substrate 2025 & 2033
- Figure 68: Middle East and Africa Physical Vapor Deposition Coatings Industry Volume (Billion), by Substrate 2025 & 2033
- Figure 69: Middle East and Africa Physical Vapor Deposition Coatings Industry Revenue Share (%), by Substrate 2025 & 2033
- Figure 70: Middle East and Africa Physical Vapor Deposition Coatings Industry Volume Share (%), by Substrate 2025 & 2033
- Figure 71: Middle East and Africa Physical Vapor Deposition Coatings Industry Revenue (Million), by Material Type 2025 & 2033
- Figure 72: Middle East and Africa Physical Vapor Deposition Coatings Industry Volume (Billion), by Material Type 2025 & 2033
- Figure 73: Middle East and Africa Physical Vapor Deposition Coatings Industry Revenue Share (%), by Material Type 2025 & 2033
- Figure 74: Middle East and Africa Physical Vapor Deposition Coatings Industry Volume Share (%), by Material Type 2025 & 2033
- Figure 75: Middle East and Africa Physical Vapor Deposition Coatings Industry Revenue (Million), by End User 2025 & 2033
- Figure 76: Middle East and Africa Physical Vapor Deposition Coatings Industry Volume (Billion), by End User 2025 & 2033
- Figure 77: Middle East and Africa Physical Vapor Deposition Coatings Industry Revenue Share (%), by End User 2025 & 2033
- Figure 78: Middle East and Africa Physical Vapor Deposition Coatings Industry Volume Share (%), by End User 2025 & 2033
- Figure 79: Middle East and Africa Physical Vapor Deposition Coatings Industry Revenue (Million), by Country 2025 & 2033
- Figure 80: Middle East and Africa Physical Vapor Deposition Coatings Industry Volume (Billion), by Country 2025 & 2033
- Figure 81: Middle East and Africa Physical Vapor Deposition Coatings Industry Revenue Share (%), by Country 2025 & 2033
- Figure 82: Middle East and Africa Physical Vapor Deposition Coatings Industry Volume Share (%), by Country 2025 & 2033
List of Tables
- Table 1: Global Physical Vapor Deposition Coatings Industry Revenue Million Forecast, by Substrate 2020 & 2033
- Table 2: Global Physical Vapor Deposition Coatings Industry Volume Billion Forecast, by Substrate 2020 & 2033
- Table 3: Global Physical Vapor Deposition Coatings Industry Revenue Million Forecast, by Material Type 2020 & 2033
- Table 4: Global Physical Vapor Deposition Coatings Industry Volume Billion Forecast, by Material Type 2020 & 2033
- Table 5: Global Physical Vapor Deposition Coatings Industry Revenue Million Forecast, by End User 2020 & 2033
- Table 6: Global Physical Vapor Deposition Coatings Industry Volume Billion Forecast, by End User 2020 & 2033
- Table 7: Global Physical Vapor Deposition Coatings Industry Revenue Million Forecast, by Region 2020 & 2033
- Table 8: Global Physical Vapor Deposition Coatings Industry Volume Billion Forecast, by Region 2020 & 2033
- Table 9: Global Physical Vapor Deposition Coatings Industry Revenue Million Forecast, by Substrate 2020 & 2033
- Table 10: Global Physical Vapor Deposition Coatings Industry Volume Billion Forecast, by Substrate 2020 & 2033
- Table 11: Global Physical Vapor Deposition Coatings Industry Revenue Million Forecast, by Material Type 2020 & 2033
- Table 12: Global Physical Vapor Deposition Coatings Industry Volume Billion Forecast, by Material Type 2020 & 2033
- Table 13: Global Physical Vapor Deposition Coatings Industry Revenue Million Forecast, by End User 2020 & 2033
- Table 14: Global Physical Vapor Deposition Coatings Industry Volume Billion Forecast, by End User 2020 & 2033
- Table 15: Global Physical Vapor Deposition Coatings Industry Revenue Million Forecast, by Country 2020 & 2033
- Table 16: Global Physical Vapor Deposition Coatings Industry Volume Billion Forecast, by Country 2020 & 2033
- Table 17: China Physical Vapor Deposition Coatings Industry Revenue (Million) Forecast, by Application 2020 & 2033
- Table 18: China Physical Vapor Deposition Coatings Industry Volume (Billion) Forecast, by Application 2020 & 2033
- Table 19: India Physical Vapor Deposition Coatings Industry Revenue (Million) Forecast, by Application 2020 & 2033
- Table 20: India Physical Vapor Deposition Coatings Industry Volume (Billion) Forecast, by Application 2020 & 2033
- Table 21: Japan Physical Vapor Deposition Coatings Industry Revenue (Million) Forecast, by Application 2020 & 2033
- Table 22: Japan Physical Vapor Deposition Coatings Industry Volume (Billion) Forecast, by Application 2020 & 2033
- Table 23: South Korea Physical Vapor Deposition Coatings Industry Revenue (Million) Forecast, by Application 2020 & 2033
- Table 24: South Korea Physical Vapor Deposition Coatings Industry Volume (Billion) Forecast, by Application 2020 & 2033
- Table 25: Malaysia Physical Vapor Deposition Coatings Industry Revenue (Million) Forecast, by Application 2020 & 2033
- Table 26: Malaysia Physical Vapor Deposition Coatings Industry Volume (Billion) Forecast, by Application 2020 & 2033
- Table 27: Thailand Physical Vapor Deposition Coatings Industry Revenue (Million) Forecast, by Application 2020 & 2033
- Table 28: Thailand Physical Vapor Deposition Coatings Industry Volume (Billion) Forecast, by Application 2020 & 2033
- Table 29: Indonesia Physical Vapor Deposition Coatings Industry Revenue (Million) Forecast, by Application 2020 & 2033
- Table 30: Indonesia Physical Vapor Deposition Coatings Industry Volume (Billion) Forecast, by Application 2020 & 2033
- Table 31: Vietnam Physical Vapor Deposition Coatings Industry Revenue (Million) Forecast, by Application 2020 & 2033
- Table 32: Vietnam Physical Vapor Deposition Coatings Industry Volume (Billion) Forecast, by Application 2020 & 2033
- Table 33: Rest of Asia Pacific Physical Vapor Deposition Coatings Industry Revenue (Million) Forecast, by Application 2020 & 2033
- Table 34: Rest of Asia Pacific Physical Vapor Deposition Coatings Industry Volume (Billion) Forecast, by Application 2020 & 2033
- Table 35: Global Physical Vapor Deposition Coatings Industry Revenue Million Forecast, by Substrate 2020 & 2033
- Table 36: Global Physical Vapor Deposition Coatings Industry Volume Billion Forecast, by Substrate 2020 & 2033
- Table 37: Global Physical Vapor Deposition Coatings Industry Revenue Million Forecast, by Material Type 2020 & 2033
- Table 38: Global Physical Vapor Deposition Coatings Industry Volume Billion Forecast, by Material Type 2020 & 2033
- Table 39: Global Physical Vapor Deposition Coatings Industry Revenue Million Forecast, by End User 2020 & 2033
- Table 40: Global Physical Vapor Deposition Coatings Industry Volume Billion Forecast, by End User 2020 & 2033
- Table 41: Global Physical Vapor Deposition Coatings Industry Revenue Million Forecast, by Country 2020 & 2033
- Table 42: Global Physical Vapor Deposition Coatings Industry Volume Billion Forecast, by Country 2020 & 2033
- Table 43: United States Physical Vapor Deposition Coatings Industry Revenue (Million) Forecast, by Application 2020 & 2033
- Table 44: United States Physical Vapor Deposition Coatings Industry Volume (Billion) Forecast, by Application 2020 & 2033
- Table 45: Canada Physical Vapor Deposition Coatings Industry Revenue (Million) Forecast, by Application 2020 & 2033
- Table 46: Canada Physical Vapor Deposition Coatings Industry Volume (Billion) Forecast, by Application 2020 & 2033
- Table 47: Mexico Physical Vapor Deposition Coatings Industry Revenue (Million) Forecast, by Application 2020 & 2033
- Table 48: Mexico Physical Vapor Deposition Coatings Industry Volume (Billion) Forecast, by Application 2020 & 2033
- Table 49: Global Physical Vapor Deposition Coatings Industry Revenue Million Forecast, by Substrate 2020 & 2033
- Table 50: Global Physical Vapor Deposition Coatings Industry Volume Billion Forecast, by Substrate 2020 & 2033
- Table 51: Global Physical Vapor Deposition Coatings Industry Revenue Million Forecast, by Material Type 2020 & 2033
- Table 52: Global Physical Vapor Deposition Coatings Industry Volume Billion Forecast, by Material Type 2020 & 2033
- Table 53: Global Physical Vapor Deposition Coatings Industry Revenue Million Forecast, by End User 2020 & 2033
- Table 54: Global Physical Vapor Deposition Coatings Industry Volume Billion Forecast, by End User 2020 & 2033
- Table 55: Global Physical Vapor Deposition Coatings Industry Revenue Million Forecast, by Country 2020 & 2033
- Table 56: Global Physical Vapor Deposition Coatings Industry Volume Billion Forecast, by Country 2020 & 2033
- Table 57: Germany Physical Vapor Deposition Coatings Industry Revenue (Million) Forecast, by Application 2020 & 2033
- Table 58: Germany Physical Vapor Deposition Coatings Industry Volume (Billion) Forecast, by Application 2020 & 2033
- Table 59: United Kingdom Physical Vapor Deposition Coatings Industry Revenue (Million) Forecast, by Application 2020 & 2033
- Table 60: United Kingdom Physical Vapor Deposition Coatings Industry Volume (Billion) Forecast, by Application 2020 & 2033
- Table 61: France Physical Vapor Deposition Coatings Industry Revenue (Million) Forecast, by Application 2020 & 2033
- Table 62: France Physical Vapor Deposition Coatings Industry Volume (Billion) Forecast, by Application 2020 & 2033
- Table 63: Italy Physical Vapor Deposition Coatings Industry Revenue (Million) Forecast, by Application 2020 & 2033
- Table 64: Italy Physical Vapor Deposition Coatings Industry Volume (Billion) Forecast, by Application 2020 & 2033
- Table 65: Spain Physical Vapor Deposition Coatings Industry Revenue (Million) Forecast, by Application 2020 & 2033
- Table 66: Spain Physical Vapor Deposition Coatings Industry Volume (Billion) Forecast, by Application 2020 & 2033
- Table 67: Turkey Physical Vapor Deposition Coatings Industry Revenue (Million) Forecast, by Application 2020 & 2033
- Table 68: Turkey Physical Vapor Deposition Coatings Industry Volume (Billion) Forecast, by Application 2020 & 2033
- Table 69: Russia Physical Vapor Deposition Coatings Industry Revenue (Million) Forecast, by Application 2020 & 2033
- Table 70: Russia Physical Vapor Deposition Coatings Industry Volume (Billion) Forecast, by Application 2020 & 2033
- Table 71: NORDIC Countries Physical Vapor Deposition Coatings Industry Revenue (Million) Forecast, by Application 2020 & 2033
- Table 72: NORDIC Countries Physical Vapor Deposition Coatings Industry Volume (Billion) Forecast, by Application 2020 & 2033
- Table 73: Rest of Europe Physical Vapor Deposition Coatings Industry Revenue (Million) Forecast, by Application 2020 & 2033
- Table 74: Rest of Europe Physical Vapor Deposition Coatings Industry Volume (Billion) Forecast, by Application 2020 & 2033
- Table 75: Global Physical Vapor Deposition Coatings Industry Revenue Million Forecast, by Substrate 2020 & 2033
- Table 76: Global Physical Vapor Deposition Coatings Industry Volume Billion Forecast, by Substrate 2020 & 2033
- Table 77: Global Physical Vapor Deposition Coatings Industry Revenue Million Forecast, by Material Type 2020 & 2033
- Table 78: Global Physical Vapor Deposition Coatings Industry Volume Billion Forecast, by Material Type 2020 & 2033
- Table 79: Global Physical Vapor Deposition Coatings Industry Revenue Million Forecast, by End User 2020 & 2033
- Table 80: Global Physical Vapor Deposition Coatings Industry Volume Billion Forecast, by End User 2020 & 2033
- Table 81: Global Physical Vapor Deposition Coatings Industry Revenue Million Forecast, by Country 2020 & 2033
- Table 82: Global Physical Vapor Deposition Coatings Industry Volume Billion Forecast, by Country 2020 & 2033
- Table 83: Brazil Physical Vapor Deposition Coatings Industry Revenue (Million) Forecast, by Application 2020 & 2033
- Table 84: Brazil Physical Vapor Deposition Coatings Industry Volume (Billion) Forecast, by Application 2020 & 2033
- Table 85: Argentina Physical Vapor Deposition Coatings Industry Revenue (Million) Forecast, by Application 2020 & 2033
- Table 86: Argentina Physical Vapor Deposition Coatings Industry Volume (Billion) Forecast, by Application 2020 & 2033
- Table 87: Colombia Physical Vapor Deposition Coatings Industry Revenue (Million) Forecast, by Application 2020 & 2033
- Table 88: Colombia Physical Vapor Deposition Coatings Industry Volume (Billion) Forecast, by Application 2020 & 2033
- Table 89: Rest of South America Physical Vapor Deposition Coatings Industry Revenue (Million) Forecast, by Application 2020 & 2033
- Table 90: Rest of South America Physical Vapor Deposition Coatings Industry Volume (Billion) Forecast, by Application 2020 & 2033
- Table 91: Global Physical Vapor Deposition Coatings Industry Revenue Million Forecast, by Substrate 2020 & 2033
- Table 92: Global Physical Vapor Deposition Coatings Industry Volume Billion Forecast, by Substrate 2020 & 2033
- Table 93: Global Physical Vapor Deposition Coatings Industry Revenue Million Forecast, by Material Type 2020 & 2033
- Table 94: Global Physical Vapor Deposition Coatings Industry Volume Billion Forecast, by Material Type 2020 & 2033
- Table 95: Global Physical Vapor Deposition Coatings Industry Revenue Million Forecast, by End User 2020 & 2033
- Table 96: Global Physical Vapor Deposition Coatings Industry Volume Billion Forecast, by End User 2020 & 2033
- Table 97: Global Physical Vapor Deposition Coatings Industry Revenue Million Forecast, by Country 2020 & 2033
- Table 98: Global Physical Vapor Deposition Coatings Industry Volume Billion Forecast, by Country 2020 & 2033
- Table 99: Saudi Arabia Physical Vapor Deposition Coatings Industry Revenue (Million) Forecast, by Application 2020 & 2033
- Table 100: Saudi Arabia Physical Vapor Deposition Coatings Industry Volume (Billion) Forecast, by Application 2020 & 2033
- Table 101: Nigeria Physical Vapor Deposition Coatings Industry Revenue (Million) Forecast, by Application 2020 & 2033
- Table 102: Nigeria Physical Vapor Deposition Coatings Industry Volume (Billion) Forecast, by Application 2020 & 2033
- Table 103: Qatar Physical Vapor Deposition Coatings Industry Revenue (Million) Forecast, by Application 2020 & 2033
- Table 104: Qatar Physical Vapor Deposition Coatings Industry Volume (Billion) Forecast, by Application 2020 & 2033
- Table 105: Egypt Physical Vapor Deposition Coatings Industry Revenue (Million) Forecast, by Application 2020 & 2033
- Table 106: Egypt Physical Vapor Deposition Coatings Industry Volume (Billion) Forecast, by Application 2020 & 2033
- Table 107: United Arab Emirates Physical Vapor Deposition Coatings Industry Revenue (Million) Forecast, by Application 2020 & 2033
- Table 108: United Arab Emirates Physical Vapor Deposition Coatings Industry Volume (Billion) Forecast, by Application 2020 & 2033
- Table 109: South Africa Physical Vapor Deposition Coatings Industry Revenue (Million) Forecast, by Application 2020 & 2033
- Table 110: South Africa Physical Vapor Deposition Coatings Industry Volume (Billion) Forecast, by Application 2020 & 2033
- Table 111: Rest of Middle East and Africa Physical Vapor Deposition Coatings Industry Revenue (Million) Forecast, by Application 2020 & 2033
- Table 112: Rest of Middle East and Africa Physical Vapor Deposition Coatings Industry Volume (Billion) Forecast, by Application 2020 & 2033
Frequently Asked Questions
1. What is the projected Compound Annual Growth Rate (CAGR) of the Physical Vapor Deposition Coatings Industry?
The projected CAGR is approximately 6.43%.
2. Which companies are prominent players in the Physical Vapor Deposition Coatings Industry?
Key companies in the market include Crystallume PVD, HEF, IHI Corporation, Impact Coatings AB, Inoxcolorz Private Limited, KOLZER SRL, Mitsubishi Materials Corporation, OC Oerlikon Management AG, Red Spot Paint & Varnish Company Inc, Richter Precision Inc, Sputtek Advanced Metallurgical Coatings, Surface Modification Technologies, TOCALO Co Ltd, voestalpine eifeler Group*List Not Exhaustive.
3. What are the main segments of the Physical Vapor Deposition Coatings Industry?
The market segments include Substrate, Material Type, End User.
4. Can you provide details about the market size?
The market size is estimated to be USD 10.46 Million as of 2022.
5. What are some drivers contributing to market growth?
Demand from the Electronics Sector; Increasing Usage in Medical Industry; Other Drivers.
6. What are the notable trends driving market growth?
The Automotive Industry is Expected to Dominate the Market Studied.
7. Are there any restraints impacting market growth?
Demand from the Electronics Sector; Increasing Usage in Medical Industry; Other Drivers.
8. Can you provide examples of recent developments in the market?
April 2022: Impact Coatings announced the establishment of a Chinese subsidiary with headquarters in Shanghai. The opening is expected to disseminate Impact Coatings' market-leading expertise in PVD coatings for hydrogen solutions and increase the availability of coating services solutions to Chinese customers in the hydrogen value chain.January 2022: IHI Ionbond announced its significant investment in decorative coating capacity by purchasing a Hauzer Flexicoat 1500 PVD system. This large-scale coating system has an impressive coating zone of 0.9 m diameter by 1.5 m height. It is a welcome addition to the growing capabilities of the Ionbond component coating facility at Consett County Durham.
9. What pricing options are available for accessing the report?
Pricing options include single-user, multi-user, and enterprise licenses priced at USD 4750, USD 5250, and USD 8750 respectively.
10. Is the market size provided in terms of value or volume?
The market size is provided in terms of value, measured in Million and volume, measured in Billion.
11. Are there any specific market keywords associated with the report?
Yes, the market keyword associated with the report is "Physical Vapor Deposition Coatings Industry," which aids in identifying and referencing the specific market segment covered.
12. How do I determine which pricing option suits my needs best?
The pricing options vary based on user requirements and access needs. Individual users may opt for single-user licenses, while businesses requiring broader access may choose multi-user or enterprise licenses for cost-effective access to the report.
13. Are there any additional resources or data provided in the Physical Vapor Deposition Coatings Industry report?
While the report offers comprehensive insights, it's advisable to review the specific contents or supplementary materials provided to ascertain if additional resources or data are available.
14. How can I stay updated on further developments or reports in the Physical Vapor Deposition Coatings Industry?
To stay informed about further developments, trends, and reports in the Physical Vapor Deposition Coatings Industry, consider subscribing to industry newsletters, following relevant companies and organizations, or regularly checking reputable industry news sources and publications.
Methodology
Step 1 - Identification of Relevant Samples Size from Population Database


Step 2 - Approaches for Defining Global Market Size (Value, Volume* & Price*)

Note*: In applicable scenarios
Step 3 - Data Sources
Primary Research
- Web Analytics
- Survey Reports
- Research Institute
- Latest Research Reports
- Opinion Leaders
Secondary Research
- Annual Reports
- White Paper
- Latest Press Release
- Industry Association
- Paid Database
- Investor Presentations

Step 4 - Data Triangulation
Involves using different sources of information in order to increase the validity of a study
These sources are likely to be stakeholders in a program - participants, other researchers, program staff, other community members, and so on.
Then we put all data in single framework & apply various statistical tools to find out the dynamic on the market.
During the analysis stage, feedback from the stakeholder groups would be compared to determine areas of agreement as well as areas of divergence