

Key Insights
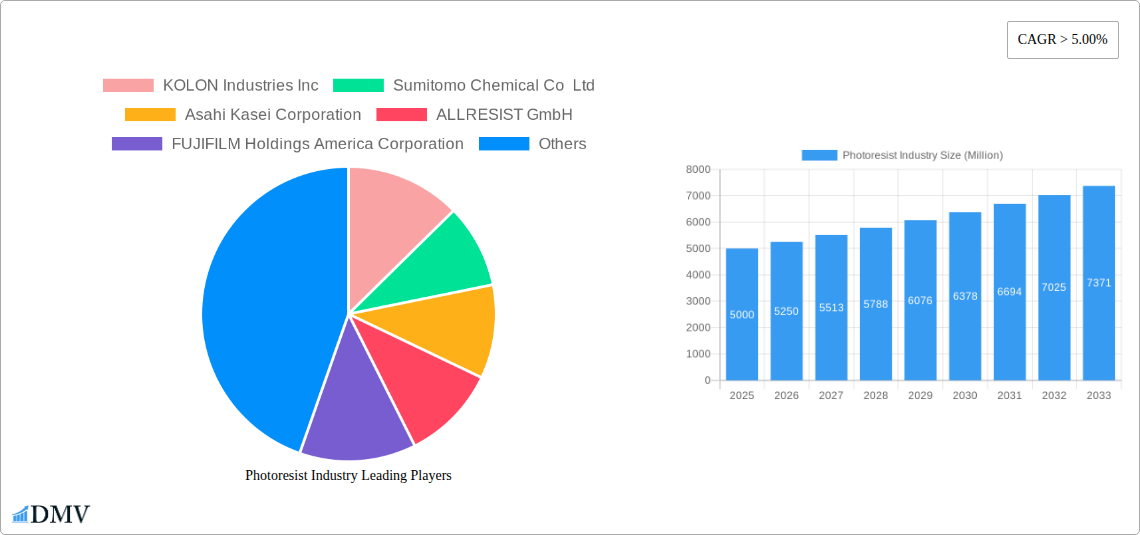
The global photoresist market, valued at approximately $XX million in 2025, is projected to experience robust growth, exceeding a 5% CAGR through 2033. This expansion is driven by several key factors. The escalating demand for advanced semiconductor devices, fueled by the growth of 5G and AI technologies, is a primary catalyst. Furthermore, the increasing adoption of miniaturization techniques in electronics manufacturing necessitates higher-resolution photoresists, boosting market demand. The shift towards advanced lithographic techniques, such as ArF immersion and EUV lithography, is another significant driver, requiring specialized and high-performance photoresist materials. While the market faces potential restraints such as fluctuating raw material prices and stringent regulatory compliance, the overall outlook remains positive, particularly in regions like Asia-Pacific, which houses a significant concentration of semiconductor manufacturing hubs. The market segmentation reveals a strong preference for ArF immersion photoresists in the semiconductor application, driven by their superior resolution and performance. The LCD and PCB segments also contribute significantly to overall market revenue, albeit with a slightly lower growth rate compared to the semiconductor sector. Key players like KOLON Industries Inc., Sumitomo Chemical Co. Ltd., and Asahi Kasei Corporation are actively engaged in research and development to maintain their competitive edge through innovation in material science and process optimization.
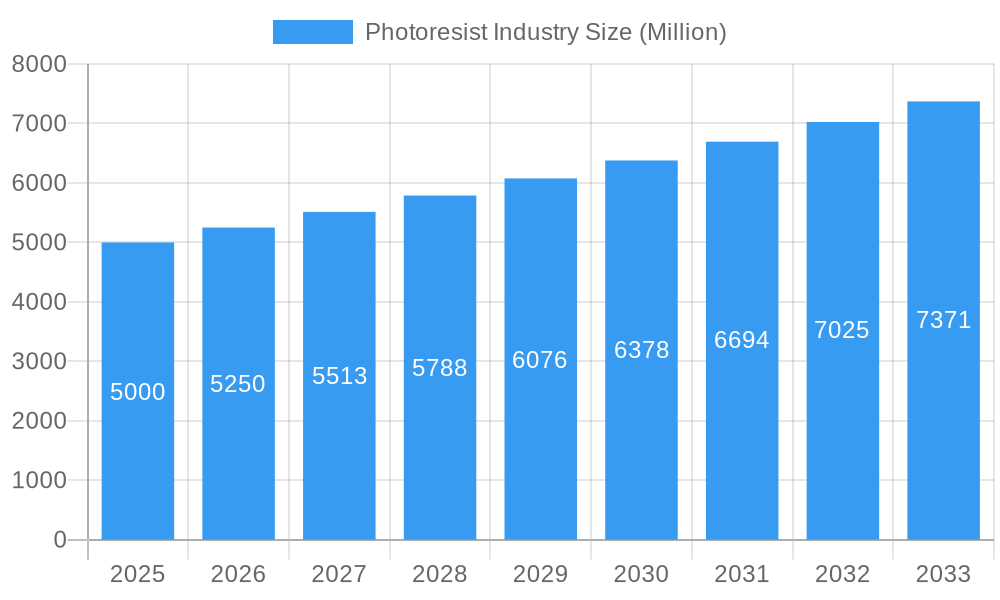
Photoresist Industry Market Size (In Billion)
The competitive landscape is characterized by both established industry giants and specialized niche players. Companies are focusing on strategic partnerships and acquisitions to expand their market reach and product portfolio. The geographical distribution of the market demonstrates a strong concentration in Asia-Pacific, particularly China, Japan, and South Korea, driven by the presence of major semiconductor fabrication facilities. North America and Europe also hold significant market shares, reflecting the strong presence of established electronics and automotive industries. Future growth is anticipated to be fueled by continuous technological advancements, including the development of next-generation photoresist materials for EUV lithography, catering to the ever-increasing demand for smaller, faster, and more energy-efficient electronic devices. The market is also expected to witness a rise in demand driven by the growing packaging industry and the automotive sector's increasing adoption of advanced electronic systems.
Photoresist Industry Company Market Share
Photoresist Industry Market Report: 2019-2033
This comprehensive report provides a detailed analysis of the global photoresist industry, offering invaluable insights for stakeholders seeking to navigate this dynamic market. With a focus on market trends, technological advancements, and key players, this report covers the period from 2019 to 2033, utilizing 2025 as the base and estimated year. The report projects a xx Million market valuation by 2033, driven by increasing demand from key segments. This in-depth analysis encompasses market size, segmentation, competitive landscape, and future growth opportunities, ensuring you have the information needed to make informed strategic decisions.
Photoresist Industry Market Composition & Trends
The global photoresist market, valued at xx Million in 2024, is characterized by a moderately concentrated landscape with several major players holding significant market share. KOLON Industries Inc, Sumitomo Chemical Co Ltd, Asahi Kasei Corporation, and Shin-Etsu Chemical Co Ltd are among the leading companies, each contributing to a complex market share distribution. Innovation is a key driver, with ongoing advancements in ArF immersion and EUV photoresist technologies leading to higher resolution and improved performance. The regulatory landscape, particularly concerning environmental regulations and material safety, significantly influences industry practices. Substitute products, while limited, present ongoing challenges. The end-user profile is dominated by the electricals and electronics industry, with significant contributions from the automotive and packaging sectors. Mergers and acquisitions (M&A) activity has been moderate, with deal values ranging from xx Million to xx Million in recent years, reflecting strategic consolidation within the industry.
- Market Concentration: Moderately concentrated, with a few major players dominating.
- Innovation Catalysts: ArF immersion and EUV photoresist technologies.
- Regulatory Landscape: Stringent environmental and safety regulations.
- Substitute Products: Limited, but represent a persistent challenge.
- End-User Profile: Primarily electricals and electronics, followed by automotive and packaging.
- M&A Activity: Moderate, with deal values between xx Million and xx Million.
Photoresist Industry Industry Evolution
The photoresist industry has experienced consistent growth throughout the historical period (2019-2024), fueled by advancements in semiconductor manufacturing and the rising demand for high-resolution displays and printed circuit boards (PCBs). The market has shown a Compound Annual Growth Rate (CAGR) of xx% during this period. Technological advancements, including the transition from KrF to ArF immersion and the emerging EUV lithography, have been pivotal in driving this growth. Consumer demand for smaller, faster, and more energy-efficient electronics has further accelerated the adoption of advanced photoresist materials. This demand is particularly strong in the semiconductor sector, driving significant investment in R&D and manufacturing capacity. The shift towards advanced packaging technologies, like 3D stacking, is expected to further fuel growth in the coming years, creating new opportunities for specialized photoresist materials. The market is anticipated to continue its growth trajectory, with a projected CAGR of xx% from 2025 to 2033. Market penetration of advanced photoresists, such as ArF immersion and EUV, is expected to increase from xx% in 2024 to xx% by 2033.
Leading Regions, Countries, or Segments in Photoresist Industry
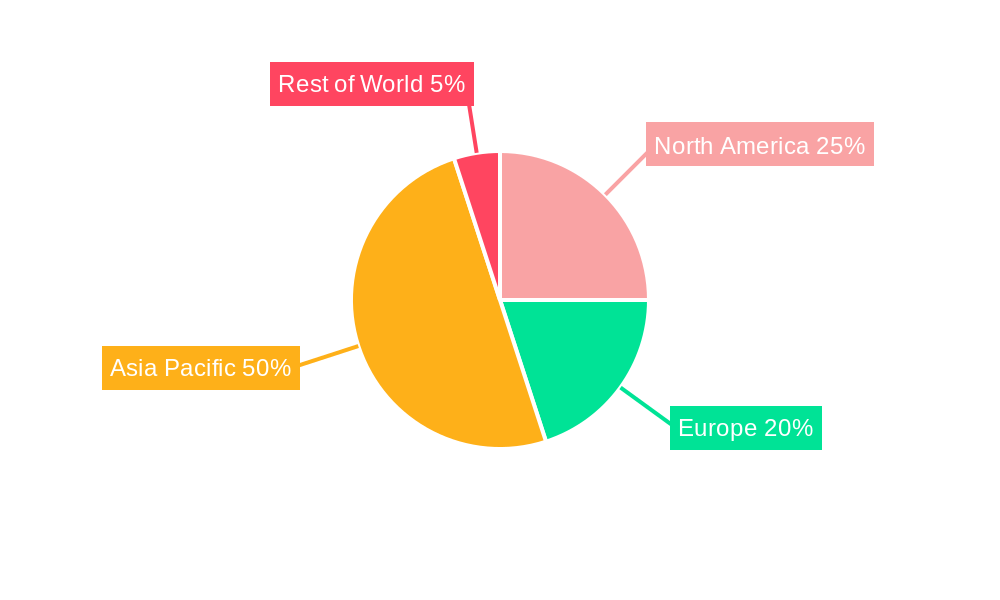
The Asia-Pacific region, particularly East Asia (China, Japan, South Korea, and Taiwan), is the dominant region in the photoresist industry, driven by the concentration of semiconductor and electronics manufacturing. Within this region, semiconductor applications represent the largest segment, followed by LCDs and PCBs. The high concentration of leading manufacturers and significant investments in advanced technology contribute to its dominance.
Key Drivers (Asia-Pacific):
- Massive investments in semiconductor fabrication plants.
- Strong government support for the electronics and semiconductor industries.
- High concentration of major photoresist manufacturers.
Dominance Factors (Semiconductor Applications):
- The relentless pursuit of miniaturization in semiconductor devices.
- The requirement for high-resolution patterning in advanced logic and memory chips.
- Continuous innovation in photolithography techniques.
Photoresist Industry Product Innovations
Recent innovations have focused on enhancing resolution, sensitivity, and performance across various applications. The development of advanced ArF immersion and EUV photoresists allows for the fabrication of smaller and more complex circuit features, enabling higher integration density in semiconductors. New materials are also being developed to address the challenges of next-generation semiconductor packaging, focusing on improved thermal stability, lower moisture absorption, and better adhesion. These innovations often incorporate unique chemical formulations and advanced processing techniques.
Propelling Factors for Photoresist Industry Growth
The photoresist industry's growth is driven by several factors. Technological advancements in semiconductor manufacturing, particularly the move towards smaller and more complex chips, necessitate the development and adoption of advanced photoresist materials. The rising demand for high-resolution displays and PCBs in electronics further fuels market growth. Government incentives and investments in the semiconductor industry, particularly in Asia-Pacific regions, also stimulate the growth of the photoresist sector.
Obstacles in the Photoresist Industry Market
Several challenges hinder market growth. Stringent environmental regulations and increasing raw material costs can increase production expenses, impacting profitability. Supply chain disruptions, particularly concerning specialized chemicals, can lead to production delays and shortages. Intense competition among established players and the emergence of new entrants add to the competitive pressure, necessitating continuous innovation and cost optimization.
Future Opportunities in Photoresist Industry
Significant future opportunities lie in the development of next-generation photoresist materials for EUV lithography and advanced packaging applications. The expanding use of photoresists in emerging technologies like flexible electronics, wearable devices, and advanced sensors presents promising new markets. Sustainable and environmentally friendly photoresist solutions will become increasingly important in the future, presenting opportunities for companies focusing on greener manufacturing practices.
Major Players in the Photoresist Industry Ecosystem
- KOLON Industries Inc
- Sumitomo Chemical Co Ltd
- Asahi Kasei Corporation
- ALLRESIST GmbH
- FUJIFILM Holdings America Corporation
- DuPont
- JSR Corporation
- DJ Microlaminates
- Microchemicals GmbH
- Shin-Etsu Chemical Co Ltd
- TOKYO OHKA KOGYO CO LTD
- *List Not Exhaustive
Key Developments in Photoresist Industry Industry
- December 2022: DuPont launched CYCLOTENE advanced electronics resins, a new photo-imageable dielectric (PID) dry film material for advanced semiconductor packaging.
- October 2022: JSR Corporation acquired JSR Electronic Materials Korea to accelerate semiconductor material production and R&D in South Korea.
- August 2022: JSR Corporation established a subsidiary in Shanghai to expand its semiconductor materials business in China.
Strategic Photoresist Industry Market Forecast
The photoresist market is poised for continued growth, driven by technological advancements, increasing demand from key applications, and strategic investments by major players. The adoption of EUV lithography and the growing need for advanced packaging solutions will shape future market trends. New materials and innovative manufacturing processes will play a crucial role in meeting the demands of the evolving semiconductor and electronics industries, ensuring continued expansion of this dynamic sector.
Photoresist Industry Segmentation
-
1. Type
- 1.1. ArF Immersion
- 1.2. ArF Dry Film
- 1.3. KrF
- 1.4. G-Line & I-line
- 1.5. Other Types
-
2. Application
- 2.1. Semiconductors
- 2.2. Liquid Crystal Displays (LCDs)
- 2.3. Printed Circuit Boards (PCBs)
- 2.4. Other Applications
-
3. End-user Industry
- 3.1. Electricals and Electronics
- 3.2. Automobiles
- 3.3. Packaging
- 3.4. Other End-user Industries
Photoresist Industry Segmentation By Geography
-
1. Asia Pacific
- 1.1. China
- 1.2. India
- 1.3. Japan
- 1.4. South Korea
- 1.5. Rest of Asia Pacific
-
2. North America
- 2.1. United States
- 2.2. Canada
- 2.3. Mexico
-
3. Europe
- 3.1. Germany
- 3.2. United Kingdom
- 3.3. Italy
- 3.4. France
- 3.5. Rest of Europe
-
4. South America
- 4.1. Brazil
- 4.2. Argentina
- 4.3. Rest of South America
-
5. Middle East and Africa
- 5.1. Saudi Arabia
- 5.2. South Africa
- 5.3. Rest of Middle East and Africa
Photoresist Industry Regional Market Share
Geographic Coverage of Photoresist Industry
Photoresist Industry REPORT HIGHLIGHTS
| Aspects | Details |
|---|---|
| Study Period | 2020-2034 |
| Base Year | 2025 |
| Estimated Year | 2026 |
| Forecast Period | 2026-2034 |
| Historical Period | 2020-2025 |
| Growth Rate | CAGR of > 5.00% from 2020-2034 |
| Segmentation |
|
Table of Contents
- 1. Introduction
- 1.1. Research Scope
- 1.2. Market Segmentation
- 1.3. Research Methodology
- 1.4. Definitions and Assumptions
- 2. Executive Summary
- 2.1. Introduction
- 3. Market Dynamics
- 3.1. Introduction
- 3.2. Market Drivers
- 3.2.1. Growing demand from Semiconductor Segment; Other Drivers
- 3.3. Market Restrains
- 3.3.1. Environmental Concerns Related to Photoresist; Other Restraints
- 3.4. Market Trends
- 3.4.1. Semiconductor Segment to Dominate the Market
- 4. Market Factor Analysis
- 4.1. Porters Five Forces
- 4.2. Supply/Value Chain
- 4.3. PESTEL analysis
- 4.4. Market Entropy
- 4.5. Patent/Trademark Analysis
- 5. Global Photoresist Industry Analysis, Insights and Forecast, 2020-2032
- 5.1. Market Analysis, Insights and Forecast - by Type
- 5.1.1. ArF Immersion
- 5.1.2. ArF Dry Film
- 5.1.3. KrF
- 5.1.4. G-Line & I-line
- 5.1.5. Other Types
- 5.2. Market Analysis, Insights and Forecast - by Application
- 5.2.1. Semiconductors
- 5.2.2. Liquid Crystal Displays (LCDs)
- 5.2.3. Printed Circuit Boards (PCBs)
- 5.2.4. Other Applications
- 5.3. Market Analysis, Insights and Forecast - by End-user Industry
- 5.3.1. Electricals and Electronics
- 5.3.2. Automobiles
- 5.3.3. Packaging
- 5.3.4. Other End-user Industries
- 5.4. Market Analysis, Insights and Forecast - by Region
- 5.4.1. Asia Pacific
- 5.4.2. North America
- 5.4.3. Europe
- 5.4.4. South America
- 5.4.5. Middle East and Africa
- 5.1. Market Analysis, Insights and Forecast - by Type
- 6. Asia Pacific Photoresist Industry Analysis, Insights and Forecast, 2020-2032
- 6.1. Market Analysis, Insights and Forecast - by Type
- 6.1.1. ArF Immersion
- 6.1.2. ArF Dry Film
- 6.1.3. KrF
- 6.1.4. G-Line & I-line
- 6.1.5. Other Types
- 6.2. Market Analysis, Insights and Forecast - by Application
- 6.2.1. Semiconductors
- 6.2.2. Liquid Crystal Displays (LCDs)
- 6.2.3. Printed Circuit Boards (PCBs)
- 6.2.4. Other Applications
- 6.3. Market Analysis, Insights and Forecast - by End-user Industry
- 6.3.1. Electricals and Electronics
- 6.3.2. Automobiles
- 6.3.3. Packaging
- 6.3.4. Other End-user Industries
- 6.1. Market Analysis, Insights and Forecast - by Type
- 7. North America Photoresist Industry Analysis, Insights and Forecast, 2020-2032
- 7.1. Market Analysis, Insights and Forecast - by Type
- 7.1.1. ArF Immersion
- 7.1.2. ArF Dry Film
- 7.1.3. KrF
- 7.1.4. G-Line & I-line
- 7.1.5. Other Types
- 7.2. Market Analysis, Insights and Forecast - by Application
- 7.2.1. Semiconductors
- 7.2.2. Liquid Crystal Displays (LCDs)
- 7.2.3. Printed Circuit Boards (PCBs)
- 7.2.4. Other Applications
- 7.3. Market Analysis, Insights and Forecast - by End-user Industry
- 7.3.1. Electricals and Electronics
- 7.3.2. Automobiles
- 7.3.3. Packaging
- 7.3.4. Other End-user Industries
- 7.1. Market Analysis, Insights and Forecast - by Type
- 8. Europe Photoresist Industry Analysis, Insights and Forecast, 2020-2032
- 8.1. Market Analysis, Insights and Forecast - by Type
- 8.1.1. ArF Immersion
- 8.1.2. ArF Dry Film
- 8.1.3. KrF
- 8.1.4. G-Line & I-line
- 8.1.5. Other Types
- 8.2. Market Analysis, Insights and Forecast - by Application
- 8.2.1. Semiconductors
- 8.2.2. Liquid Crystal Displays (LCDs)
- 8.2.3. Printed Circuit Boards (PCBs)
- 8.2.4. Other Applications
- 8.3. Market Analysis, Insights and Forecast - by End-user Industry
- 8.3.1. Electricals and Electronics
- 8.3.2. Automobiles
- 8.3.3. Packaging
- 8.3.4. Other End-user Industries
- 8.1. Market Analysis, Insights and Forecast - by Type
- 9. South America Photoresist Industry Analysis, Insights and Forecast, 2020-2032
- 9.1. Market Analysis, Insights and Forecast - by Type
- 9.1.1. ArF Immersion
- 9.1.2. ArF Dry Film
- 9.1.3. KrF
- 9.1.4. G-Line & I-line
- 9.1.5. Other Types
- 9.2. Market Analysis, Insights and Forecast - by Application
- 9.2.1. Semiconductors
- 9.2.2. Liquid Crystal Displays (LCDs)
- 9.2.3. Printed Circuit Boards (PCBs)
- 9.2.4. Other Applications
- 9.3. Market Analysis, Insights and Forecast - by End-user Industry
- 9.3.1. Electricals and Electronics
- 9.3.2. Automobiles
- 9.3.3. Packaging
- 9.3.4. Other End-user Industries
- 9.1. Market Analysis, Insights and Forecast - by Type
- 10. Middle East and Africa Photoresist Industry Analysis, Insights and Forecast, 2020-2032
- 10.1. Market Analysis, Insights and Forecast - by Type
- 10.1.1. ArF Immersion
- 10.1.2. ArF Dry Film
- 10.1.3. KrF
- 10.1.4. G-Line & I-line
- 10.1.5. Other Types
- 10.2. Market Analysis, Insights and Forecast - by Application
- 10.2.1. Semiconductors
- 10.2.2. Liquid Crystal Displays (LCDs)
- 10.2.3. Printed Circuit Boards (PCBs)
- 10.2.4. Other Applications
- 10.3. Market Analysis, Insights and Forecast - by End-user Industry
- 10.3.1. Electricals and Electronics
- 10.3.2. Automobiles
- 10.3.3. Packaging
- 10.3.4. Other End-user Industries
- 10.1. Market Analysis, Insights and Forecast - by Type
- 11. Competitive Analysis
- 11.1. Global Market Share Analysis 2025
- 11.2. Company Profiles
- 11.2.1 KOLON Industries Inc
- 11.2.1.1. Overview
- 11.2.1.2. Products
- 11.2.1.3. SWOT Analysis
- 11.2.1.4. Recent Developments
- 11.2.1.5. Financials (Based on Availability)
- 11.2.2 Sumitomo Chemical Co Ltd
- 11.2.2.1. Overview
- 11.2.2.2. Products
- 11.2.2.3. SWOT Analysis
- 11.2.2.4. Recent Developments
- 11.2.2.5. Financials (Based on Availability)
- 11.2.3 Asahi Kasei Corporation
- 11.2.3.1. Overview
- 11.2.3.2. Products
- 11.2.3.3. SWOT Analysis
- 11.2.3.4. Recent Developments
- 11.2.3.5. Financials (Based on Availability)
- 11.2.4 ALLRESIST GmbH
- 11.2.4.1. Overview
- 11.2.4.2. Products
- 11.2.4.3. SWOT Analysis
- 11.2.4.4. Recent Developments
- 11.2.4.5. Financials (Based on Availability)
- 11.2.5 FUJIFILM Holdings America Corporation
- 11.2.5.1. Overview
- 11.2.5.2. Products
- 11.2.5.3. SWOT Analysis
- 11.2.5.4. Recent Developments
- 11.2.5.5. Financials (Based on Availability)
- 11.2.6 DuPont
- 11.2.6.1. Overview
- 11.2.6.2. Products
- 11.2.6.3. SWOT Analysis
- 11.2.6.4. Recent Developments
- 11.2.6.5. Financials (Based on Availability)
- 11.2.7 JSR Corporation
- 11.2.7.1. Overview
- 11.2.7.2. Products
- 11.2.7.3. SWOT Analysis
- 11.2.7.4. Recent Developments
- 11.2.7.5. Financials (Based on Availability)
- 11.2.8 DJ Microlaminates
- 11.2.8.1. Overview
- 11.2.8.2. Products
- 11.2.8.3. SWOT Analysis
- 11.2.8.4. Recent Developments
- 11.2.8.5. Financials (Based on Availability)
- 11.2.9 Microchemicals GmbH
- 11.2.9.1. Overview
- 11.2.9.2. Products
- 11.2.9.3. SWOT Analysis
- 11.2.9.4. Recent Developments
- 11.2.9.5. Financials (Based on Availability)
- 11.2.10 Shin-Etsu Chemical Co Ltd
- 11.2.10.1. Overview
- 11.2.10.2. Products
- 11.2.10.3. SWOT Analysis
- 11.2.10.4. Recent Developments
- 11.2.10.5. Financials (Based on Availability)
- 11.2.11 TOKYO OHKA KOGYO CO LTD *List Not Exhaustive
- 11.2.11.1. Overview
- 11.2.11.2. Products
- 11.2.11.3. SWOT Analysis
- 11.2.11.4. Recent Developments
- 11.2.11.5. Financials (Based on Availability)
- 11.2.1 KOLON Industries Inc
List of Figures
- Figure 1: Global Photoresist Industry Revenue Breakdown (Million, %) by Region 2025 & 2033
- Figure 2: Asia Pacific Photoresist Industry Revenue (Million), by Type 2025 & 2033
- Figure 3: Asia Pacific Photoresist Industry Revenue Share (%), by Type 2025 & 2033
- Figure 4: Asia Pacific Photoresist Industry Revenue (Million), by Application 2025 & 2033
- Figure 5: Asia Pacific Photoresist Industry Revenue Share (%), by Application 2025 & 2033
- Figure 6: Asia Pacific Photoresist Industry Revenue (Million), by End-user Industry 2025 & 2033
- Figure 7: Asia Pacific Photoresist Industry Revenue Share (%), by End-user Industry 2025 & 2033
- Figure 8: Asia Pacific Photoresist Industry Revenue (Million), by Country 2025 & 2033
- Figure 9: Asia Pacific Photoresist Industry Revenue Share (%), by Country 2025 & 2033
- Figure 10: North America Photoresist Industry Revenue (Million), by Type 2025 & 2033
- Figure 11: North America Photoresist Industry Revenue Share (%), by Type 2025 & 2033
- Figure 12: North America Photoresist Industry Revenue (Million), by Application 2025 & 2033
- Figure 13: North America Photoresist Industry Revenue Share (%), by Application 2025 & 2033
- Figure 14: North America Photoresist Industry Revenue (Million), by End-user Industry 2025 & 2033
- Figure 15: North America Photoresist Industry Revenue Share (%), by End-user Industry 2025 & 2033
- Figure 16: North America Photoresist Industry Revenue (Million), by Country 2025 & 2033
- Figure 17: North America Photoresist Industry Revenue Share (%), by Country 2025 & 2033
- Figure 18: Europe Photoresist Industry Revenue (Million), by Type 2025 & 2033
- Figure 19: Europe Photoresist Industry Revenue Share (%), by Type 2025 & 2033
- Figure 20: Europe Photoresist Industry Revenue (Million), by Application 2025 & 2033
- Figure 21: Europe Photoresist Industry Revenue Share (%), by Application 2025 & 2033
- Figure 22: Europe Photoresist Industry Revenue (Million), by End-user Industry 2025 & 2033
- Figure 23: Europe Photoresist Industry Revenue Share (%), by End-user Industry 2025 & 2033
- Figure 24: Europe Photoresist Industry Revenue (Million), by Country 2025 & 2033
- Figure 25: Europe Photoresist Industry Revenue Share (%), by Country 2025 & 2033
- Figure 26: South America Photoresist Industry Revenue (Million), by Type 2025 & 2033
- Figure 27: South America Photoresist Industry Revenue Share (%), by Type 2025 & 2033
- Figure 28: South America Photoresist Industry Revenue (Million), by Application 2025 & 2033
- Figure 29: South America Photoresist Industry Revenue Share (%), by Application 2025 & 2033
- Figure 30: South America Photoresist Industry Revenue (Million), by End-user Industry 2025 & 2033
- Figure 31: South America Photoresist Industry Revenue Share (%), by End-user Industry 2025 & 2033
- Figure 32: South America Photoresist Industry Revenue (Million), by Country 2025 & 2033
- Figure 33: South America Photoresist Industry Revenue Share (%), by Country 2025 & 2033
- Figure 34: Middle East and Africa Photoresist Industry Revenue (Million), by Type 2025 & 2033
- Figure 35: Middle East and Africa Photoresist Industry Revenue Share (%), by Type 2025 & 2033
- Figure 36: Middle East and Africa Photoresist Industry Revenue (Million), by Application 2025 & 2033
- Figure 37: Middle East and Africa Photoresist Industry Revenue Share (%), by Application 2025 & 2033
- Figure 38: Middle East and Africa Photoresist Industry Revenue (Million), by End-user Industry 2025 & 2033
- Figure 39: Middle East and Africa Photoresist Industry Revenue Share (%), by End-user Industry 2025 & 2033
- Figure 40: Middle East and Africa Photoresist Industry Revenue (Million), by Country 2025 & 2033
- Figure 41: Middle East and Africa Photoresist Industry Revenue Share (%), by Country 2025 & 2033
List of Tables
- Table 1: Global Photoresist Industry Revenue Million Forecast, by Type 2020 & 2033
- Table 2: Global Photoresist Industry Revenue Million Forecast, by Application 2020 & 2033
- Table 3: Global Photoresist Industry Revenue Million Forecast, by End-user Industry 2020 & 2033
- Table 4: Global Photoresist Industry Revenue Million Forecast, by Region 2020 & 2033
- Table 5: Global Photoresist Industry Revenue Million Forecast, by Type 2020 & 2033
- Table 6: Global Photoresist Industry Revenue Million Forecast, by Application 2020 & 2033
- Table 7: Global Photoresist Industry Revenue Million Forecast, by End-user Industry 2020 & 2033
- Table 8: Global Photoresist Industry Revenue Million Forecast, by Country 2020 & 2033
- Table 9: China Photoresist Industry Revenue (Million) Forecast, by Application 2020 & 2033
- Table 10: India Photoresist Industry Revenue (Million) Forecast, by Application 2020 & 2033
- Table 11: Japan Photoresist Industry Revenue (Million) Forecast, by Application 2020 & 2033
- Table 12: South Korea Photoresist Industry Revenue (Million) Forecast, by Application 2020 & 2033
- Table 13: Rest of Asia Pacific Photoresist Industry Revenue (Million) Forecast, by Application 2020 & 2033
- Table 14: Global Photoresist Industry Revenue Million Forecast, by Type 2020 & 2033
- Table 15: Global Photoresist Industry Revenue Million Forecast, by Application 2020 & 2033
- Table 16: Global Photoresist Industry Revenue Million Forecast, by End-user Industry 2020 & 2033
- Table 17: Global Photoresist Industry Revenue Million Forecast, by Country 2020 & 2033
- Table 18: United States Photoresist Industry Revenue (Million) Forecast, by Application 2020 & 2033
- Table 19: Canada Photoresist Industry Revenue (Million) Forecast, by Application 2020 & 2033
- Table 20: Mexico Photoresist Industry Revenue (Million) Forecast, by Application 2020 & 2033
- Table 21: Global Photoresist Industry Revenue Million Forecast, by Type 2020 & 2033
- Table 22: Global Photoresist Industry Revenue Million Forecast, by Application 2020 & 2033
- Table 23: Global Photoresist Industry Revenue Million Forecast, by End-user Industry 2020 & 2033
- Table 24: Global Photoresist Industry Revenue Million Forecast, by Country 2020 & 2033
- Table 25: Germany Photoresist Industry Revenue (Million) Forecast, by Application 2020 & 2033
- Table 26: United Kingdom Photoresist Industry Revenue (Million) Forecast, by Application 2020 & 2033
- Table 27: Italy Photoresist Industry Revenue (Million) Forecast, by Application 2020 & 2033
- Table 28: France Photoresist Industry Revenue (Million) Forecast, by Application 2020 & 2033
- Table 29: Rest of Europe Photoresist Industry Revenue (Million) Forecast, by Application 2020 & 2033
- Table 30: Global Photoresist Industry Revenue Million Forecast, by Type 2020 & 2033
- Table 31: Global Photoresist Industry Revenue Million Forecast, by Application 2020 & 2033
- Table 32: Global Photoresist Industry Revenue Million Forecast, by End-user Industry 2020 & 2033
- Table 33: Global Photoresist Industry Revenue Million Forecast, by Country 2020 & 2033
- Table 34: Brazil Photoresist Industry Revenue (Million) Forecast, by Application 2020 & 2033
- Table 35: Argentina Photoresist Industry Revenue (Million) Forecast, by Application 2020 & 2033
- Table 36: Rest of South America Photoresist Industry Revenue (Million) Forecast, by Application 2020 & 2033
- Table 37: Global Photoresist Industry Revenue Million Forecast, by Type 2020 & 2033
- Table 38: Global Photoresist Industry Revenue Million Forecast, by Application 2020 & 2033
- Table 39: Global Photoresist Industry Revenue Million Forecast, by End-user Industry 2020 & 2033
- Table 40: Global Photoresist Industry Revenue Million Forecast, by Country 2020 & 2033
- Table 41: Saudi Arabia Photoresist Industry Revenue (Million) Forecast, by Application 2020 & 2033
- Table 42: South Africa Photoresist Industry Revenue (Million) Forecast, by Application 2020 & 2033
- Table 43: Rest of Middle East and Africa Photoresist Industry Revenue (Million) Forecast, by Application 2020 & 2033
Frequently Asked Questions
1. What is the projected Compound Annual Growth Rate (CAGR) of the Photoresist Industry?
The projected CAGR is approximately > 5.00%.
2. Which companies are prominent players in the Photoresist Industry?
Key companies in the market include KOLON Industries Inc, Sumitomo Chemical Co Ltd, Asahi Kasei Corporation, ALLRESIST GmbH, FUJIFILM Holdings America Corporation, DuPont, JSR Corporation, DJ Microlaminates, Microchemicals GmbH, Shin-Etsu Chemical Co Ltd, TOKYO OHKA KOGYO CO LTD *List Not Exhaustive.
3. What are the main segments of the Photoresist Industry?
The market segments include Type, Application, End-user Industry .
4. Can you provide details about the market size?
The market size is estimated to be USD XX Million as of 2022.
5. What are some drivers contributing to market growth?
Growing demand from Semiconductor Segment; Other Drivers.
6. What are the notable trends driving market growth?
Semiconductor Segment to Dominate the Market.
7. Are there any restraints impacting market growth?
Environmental Concerns Related to Photoresist; Other Restraints.
8. Can you provide examples of recent developments in the market?
December 2022: DuPont launched CYCLOTENE advanced electronics resins, a new photo-imageable dielectric (PID) dry film material that can be used in advanced semiconductor packaging applications. In order to get high functionality, performance, and reliability from these new packaging technologies, which offer higher levels of integration, shorter interconnect paths, and more I/Os, you need reliable dielectric materials with good resolution, low moisture uptake, and superior thermal stability.
9. What pricing options are available for accessing the report?
Pricing options include single-user, multi-user, and enterprise licenses priced at USD 4750, USD 5250, and USD 8750 respectively.
10. Is the market size provided in terms of value or volume?
The market size is provided in terms of value, measured in Million.
11. Are there any specific market keywords associated with the report?
Yes, the market keyword associated with the report is "Photoresist Industry," which aids in identifying and referencing the specific market segment covered.
12. How do I determine which pricing option suits my needs best?
The pricing options vary based on user requirements and access needs. Individual users may opt for single-user licenses, while businesses requiring broader access may choose multi-user or enterprise licenses for cost-effective access to the report.
13. Are there any additional resources or data provided in the Photoresist Industry report?
While the report offers comprehensive insights, it's advisable to review the specific contents or supplementary materials provided to ascertain if additional resources or data are available.
14. How can I stay updated on further developments or reports in the Photoresist Industry?
To stay informed about further developments, trends, and reports in the Photoresist Industry, consider subscribing to industry newsletters, following relevant companies and organizations, or regularly checking reputable industry news sources and publications.
Methodology
Step 1 - Identification of Relevant Samples Size from Population Database


Step 2 - Approaches for Defining Global Market Size (Value, Volume* & Price*)

Note*: In applicable scenarios
Step 3 - Data Sources
Primary Research
- Web Analytics
- Survey Reports
- Research Institute
- Latest Research Reports
- Opinion Leaders
Secondary Research
- Annual Reports
- White Paper
- Latest Press Release
- Industry Association
- Paid Database
- Investor Presentations

Step 4 - Data Triangulation
Involves using different sources of information in order to increase the validity of a study
These sources are likely to be stakeholders in a program - participants, other researchers, program staff, other community members, and so on.
Then we put all data in single framework & apply various statistical tools to find out the dynamic on the market.
During the analysis stage, feedback from the stakeholder groups would be compared to determine areas of agreement as well as areas of divergence