

Key Insights
The Platinum Group Metals (PGM) market, encompassing platinum, palladium, rhodium, iridium, ruthenium, and osmium, is projected for robust expansion. Forecasted at a CAGR of 3.31% from 2024, the market is valued at $41.59 billion. Key growth drivers include the automotive sector's increasing demand for autocatalysts driven by stringent global emissions regulations, and advancements in electronics, particularly within electric vehicles and sophisticated technologies. Emerging applications in fuel cells, chemical processing, and medical sectors also contribute to market growth. The Asia-Pacific region, led by China and India, is a significant market contributor due to rapid industrialization. Autocatalysts remain the primary application, followed by electronics and jewelry. Leading PGM market players include Anglo American Platinum, Implats, Norilsk Nickel, and Johnson Matthey. Ongoing research into novel PGM applications, such as water treatment and sensor technology, presents substantial future growth potential.

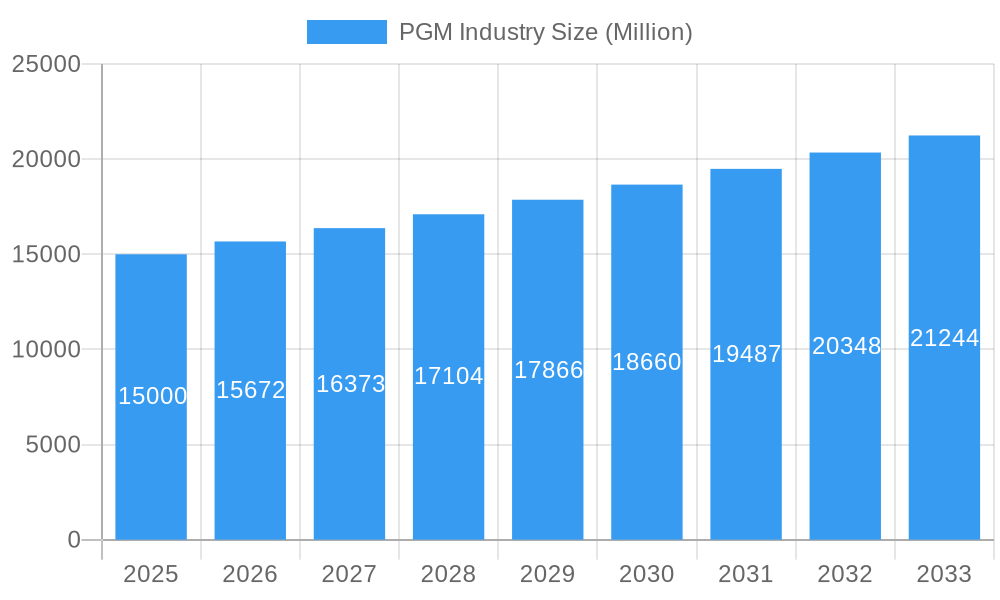
PGM Industry Market Size (In Billion)
The PGM market demonstrates resilience due to its diverse applications. However, challenges persist, including raw material price volatility and supply chain complexities. Sustainable sourcing and responsible mining practices are paramount for industry stakeholders and regulatory compliance. The long-term PGM market outlook is favorable, supported by technological innovation and evolving environmental mandates. Growth in emerging economies, particularly in Asia-Pacific, will further accelerate market expansion. Strategic collaborations and technological advancements will be crucial for companies to maintain competitiveness in this dynamic market.
PGM Industry Company Market Share
PGM Industry Market Report: 2019-2033
This comprehensive report provides an in-depth analysis of the Platinum Group Metals (PGM) industry, offering a detailed forecast from 2025 to 2033 and incorporating historical data from 2019 to 2024. The report meticulously examines market trends, leading players, technological advancements, and future growth prospects, presenting valuable insights for stakeholders across the PGM value chain. With a focus on key segments like Platinum, Palladium, and Rhodium, and applications ranging from autocatalysts to fuel cells, this report is an essential resource for strategic decision-making. The total market value is projected to reach xx Million by 2033.
PGM Industry Market Composition & Trends
This section analyzes the PGM market's competitive landscape, encompassing market concentration, innovation drivers, regulatory frameworks, substitute materials, end-user analysis, and significant M&A activities. The report delves into market share distribution among key players, including Anglo American Platinum Limited, Implats Platinum Limited, Vale, Norilsk Nickel, African Rainbow Minerals Limited, GLENCORE, Northam Platinum Holdings Limited, Johnson Matthey, Sibanye-Stillwater, and Platinum Group Metals Ltd. The analysis reveals a moderately concentrated market with ongoing consolidation.
- Market Share Distribution (2024): Anglo American Platinum: xx%; Implats: xx%; Norilsk Nickel: xx%; Sibanye-Stillwater: xx%; Others: xx%. (These are estimated values)
- M&A Deal Value (2019-2024): Total M&A activity reached approximately xx Million, driven by strategic acquisitions aiming to secure resources and expand market reach.
- Innovation Catalysts: Growing demand for electric vehicles (EVs) and fuel cells is driving innovation in PGM extraction, refining, and application technologies.
- Regulatory Landscape: Stringent environmental regulations are influencing PGM production processes and driving the adoption of sustainable practices.
- Substitute Products: The limited availability of suitable substitutes for PGMs in key applications ensures continued demand.
PGM Industry Evolution
This section provides a comprehensive overview of the PGM industry's evolution, tracing its growth trajectory, technological breakthroughs, and evolving consumer preferences. The report analyzes the historical growth rates (2019-2024) and projects future growth rates (2025-2033), considering factors such as increasing demand from automotive, electronics, and industrial sectors. The impact of technological advancements in PGM recycling and the shift towards cleaner energy solutions are also thoroughly explored. Analysis incorporates data on PGM adoption metrics across various sectors. For instance, the penetration of PGMs in autocatalysts and fuel cells is projected to increase significantly by 2033, driven by stricter emission norms and the rising popularity of EVs and hydrogen-powered vehicles.
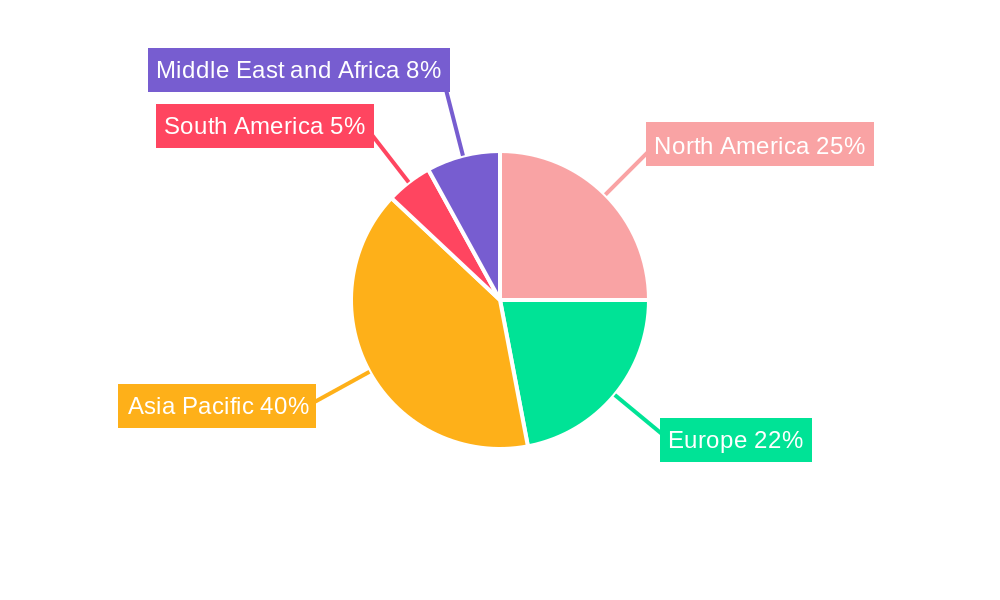
Leading Regions, Countries, or Segments in PGM Industry
This section identifies the dominant regions, countries, and PGM segments based on metal type (Platinum, Palladium, Rhodium, Iridium, Ruthenium, Osmium) and application (Auto Catalysts, Electrical and Electronics, Fuel Cells, Glass, Ceramics, and Pigments, Jewellery, Medical (Dental and Pharmaceuticals), Chemical Industry, Other Applications). South Africa and Russia traditionally dominate PGM production. However, the increasing demand from growing economies and technological advancements in various application sectors are reshaping the market landscape.
Key Drivers for Dominant Segments:
- Auto Catalysts: Stringent emission regulations globally drive robust demand.
- Electrical & Electronics: Growth in the electronics industry fuels the demand for PGMs in various components.
- South Africa: Significant PGM reserves and established mining infrastructure.
- Russia: Large PGM reserves and significant production capacity.
In-depth Analysis: The dominance of specific regions and segments is attributed to factors such as resource availability, government policies, manufacturing capabilities, and technological innovation within each region and application.
PGM Industry Product Innovations
Recent years have witnessed significant product innovations within the PGM industry. Manufacturers are focusing on developing advanced materials and technologies to enhance the performance and applications of PGMs, including the development of more efficient catalysts, advanced alloys, and improved recycling processes. These innovations improve the efficiency and durability of PGMs in various applications, leading to cost reductions and improved environmental performance. Unique selling propositions focus on sustainability and performance enhancement.
Propelling Factors for PGM Industry Growth
Several factors are driving the growth of the PGM industry. The increasing demand for PGMs from the automotive sector, particularly for catalytic converters in vehicles, is a major growth driver. The expanding electronics and jewelry industries also contribute to the rising demand for PGMs. Furthermore, the development of fuel cells and other emerging applications is expected to fuel future growth. Government regulations on emissions are another factor driving increased adoption.
Obstacles in the PGM Industry Market
The PGM industry faces several challenges, including price volatility, supply chain disruptions, and environmental regulations. These factors can impact the profitability and sustainability of the industry. The concentration of PGM reserves in a few regions also presents geopolitical risks. Competitive pressures among producers are also intensifying.
Future Opportunities in PGM Industry
Future opportunities for the PGM industry include the expansion of applications in fuel cells, water treatment, and other emerging technologies. The growing demand for environmentally friendly technologies and the need for sustainable resource management are also creating new opportunities. Recycled PGMs are also becoming increasingly important and are driving innovation in recycling technologies.
Major Players in the PGM Industry Ecosystem
- ANGLO AMERICAN PLATINUM LIMITED
- Implats Platinum Limited
- Vale
- Norilsk Nickel
- African Rainbow Minerals Limited
- GLENCORE
- Northam Platinum Holdings Limited
- Johnson Matthey
- Sibanye-Stillwater
- Platinum Group Metals Ltd
Key Developments in PGM Industry
November 2023: Sibanye-Stillwater's acquisition of Reldan significantly expands its recycling capabilities, boosting its access to secondary PGM sources and enhancing its sustainability profile. This move is expected to increase the company's market share in the recycled PGM market.
October 2023: Anglo American's collaboration with BMW and Sasol accelerates the development and adoption of hydrogen fuel-cell electric vehicles (FCEVs), boosting demand for PGMs used in these vehicles. This collaboration positions Anglo American as a key player in the growing hydrogen economy.
Strategic PGM Industry Market Forecast
The PGM market is poised for significant growth in the coming years, driven by increasing demand from the automotive, electronics, and fuel cell industries. Technological advancements and rising environmental awareness are likely to accelerate this growth. The focus on sustainable practices and the development of innovative recycling technologies will shape the industry's future. The overall market is expected to experience robust growth, exceeding xx Million by 2033.
PGM Industry Segmentation
-
1. Metal Type
- 1.1. Platinum
- 1.2. Palladium
- 1.3. Rhodium
- 1.4. Iridium
- 1.5. Ruthenium
- 1.6. Osmium
-
2. Application
- 2.1. Auto Catalysts
- 2.2. Electrical and Electronics
- 2.3. Fuel Cells
- 2.4. Glass, Ceramics, and Pigments
- 2.5. Jewellery
- 2.6. Medical (Dental and Pharmaceuticals)
- 2.7. Chemical Industry
- 2.8. Other Ap
PGM Industry Segmentation By Geography
-
1. Asia Pacific
- 1.1. China
- 1.2. India
- 1.3. Japan
- 1.4. South Korea
- 1.5. ASEAN Countries
- 1.6. Rest of Asia Pacific
-
2. North America
- 2.1. United States
- 2.2. Canada
- 2.3. Mexico
-
3. Europe
- 3.1. Germany
- 3.2. United Kingdom
- 3.3. Italy
- 3.4. France
- 3.5. Rest of Europe
-
4. South America
- 4.1. Brazil
- 4.2. Argentina
- 4.3. Rest of South America
-
5. Middle East and Africa
- 5.1. Saudi Arabia
- 5.2. South Africa
- 5.3. Rest of Middle East and Africa
PGM Industry Regional Market Share
Geographic Coverage of PGM Industry
PGM Industry REPORT HIGHLIGHTS
| Aspects | Details |
|---|---|
| Study Period | 2020-2034 |
| Base Year | 2025 |
| Estimated Year | 2026 |
| Forecast Period | 2026-2034 |
| Historical Period | 2020-2025 |
| Growth Rate | CAGR of 3.31% from 2020-2034 |
| Segmentation |
|
Table of Contents
- 1. Introduction
- 1.1. Research Scope
- 1.2. Market Segmentation
- 1.3. Research Objective
- 1.4. Definitions and Assumptions
- 2. Executive Summary
- 2.1. Market Snapshot
- 3. Market Dynamics
- 3.1. Market Drivers
- 3.2. Market Restrains
- 3.3. Market Trends
- 3.4. Market Opportunities
- 4. Market Factor Analysis
- 4.1. Porters Five Forces
- 4.1.1. Bargaining Power of Suppliers
- 4.1.2. Bargaining Power of Buyers
- 4.1.3. Threat of New Entrants
- 4.1.4. Threat of Substitutes
- 4.1.5. Competitive Rivalry
- 4.2. PESTEL analysis
- 4.3. BCG Analysis
- 4.3.1. Stars (High Growth, High Market Share)
- 4.3.2. Cash Cows (Low Growth, High Market Share)
- 4.3.3. Question Mark (High Growth, Low Market Share)
- 4.3.4. Dogs (Low Growth, Low Market Share)
- 4.4. Ansoff Matrix Analysis
- 4.5. Supply Chain Analysis
- 4.6. Regulatory Landscape
- 4.7. Current Market Potential and Opportunity Assessment (TAM–SAM–SOM Framework)
- 4.8. DMV Analyst Note
- 4.1. Porters Five Forces
- 5. Market Analysis, Insights and Forecast 2021-2033
- 5.1. Market Analysis, Insights and Forecast - by Metal Type
- 5.1.1. Platinum
- 5.1.2. Palladium
- 5.1.3. Rhodium
- 5.1.4. Iridium
- 5.1.5. Ruthenium
- 5.1.6. Osmium
- 5.2. Market Analysis, Insights and Forecast - by Application
- 5.2.1. Auto Catalysts
- 5.2.2. Electrical and Electronics
- 5.2.3. Fuel Cells
- 5.2.4. Glass, Ceramics, and Pigments
- 5.2.5. Jewellery
- 5.2.6. Medical (Dental and Pharmaceuticals)
- 5.2.7. Chemical Industry
- 5.2.8. Other Ap
- 5.3. Market Analysis, Insights and Forecast - by Region
- 5.3.1. Asia Pacific
- 5.3.2. North America
- 5.3.3. Europe
- 5.3.4. South America
- 5.3.5. Middle East and Africa
- 5.1. Market Analysis, Insights and Forecast - by Metal Type
- 6. Global PGM Industry Analysis, Insights and Forecast, 2021-2033
- 6.1. Market Analysis, Insights and Forecast - by Metal Type
- 6.1.1. Platinum
- 6.1.2. Palladium
- 6.1.3. Rhodium
- 6.1.4. Iridium
- 6.1.5. Ruthenium
- 6.1.6. Osmium
- 6.2. Market Analysis, Insights and Forecast - by Application
- 6.2.1. Auto Catalysts
- 6.2.2. Electrical and Electronics
- 6.2.3. Fuel Cells
- 6.2.4. Glass, Ceramics, and Pigments
- 6.2.5. Jewellery
- 6.2.6. Medical (Dental and Pharmaceuticals)
- 6.2.7. Chemical Industry
- 6.2.8. Other Ap
- 6.1. Market Analysis, Insights and Forecast - by Metal Type
- 7. Asia Pacific PGM Industry Analysis, Insights and Forecast, 2020-2032
- 7.1. Market Analysis, Insights and Forecast - by Metal Type
- 7.1.1. Platinum
- 7.1.2. Palladium
- 7.1.3. Rhodium
- 7.1.4. Iridium
- 7.1.5. Ruthenium
- 7.1.6. Osmium
- 7.2. Market Analysis, Insights and Forecast - by Application
- 7.2.1. Auto Catalysts
- 7.2.2. Electrical and Electronics
- 7.2.3. Fuel Cells
- 7.2.4. Glass, Ceramics, and Pigments
- 7.2.5. Jewellery
- 7.2.6. Medical (Dental and Pharmaceuticals)
- 7.2.7. Chemical Industry
- 7.2.8. Other Ap
- 7.1. Market Analysis, Insights and Forecast - by Metal Type
- 8. North America PGM Industry Analysis, Insights and Forecast, 2020-2032
- 8.1. Market Analysis, Insights and Forecast - by Metal Type
- 8.1.1. Platinum
- 8.1.2. Palladium
- 8.1.3. Rhodium
- 8.1.4. Iridium
- 8.1.5. Ruthenium
- 8.1.6. Osmium
- 8.2. Market Analysis, Insights and Forecast - by Application
- 8.2.1. Auto Catalysts
- 8.2.2. Electrical and Electronics
- 8.2.3. Fuel Cells
- 8.2.4. Glass, Ceramics, and Pigments
- 8.2.5. Jewellery
- 8.2.6. Medical (Dental and Pharmaceuticals)
- 8.2.7. Chemical Industry
- 8.2.8. Other Ap
- 8.1. Market Analysis, Insights and Forecast - by Metal Type
- 9. Europe PGM Industry Analysis, Insights and Forecast, 2020-2032
- 9.1. Market Analysis, Insights and Forecast - by Metal Type
- 9.1.1. Platinum
- 9.1.2. Palladium
- 9.1.3. Rhodium
- 9.1.4. Iridium
- 9.1.5. Ruthenium
- 9.1.6. Osmium
- 9.2. Market Analysis, Insights and Forecast - by Application
- 9.2.1. Auto Catalysts
- 9.2.2. Electrical and Electronics
- 9.2.3. Fuel Cells
- 9.2.4. Glass, Ceramics, and Pigments
- 9.2.5. Jewellery
- 9.2.6. Medical (Dental and Pharmaceuticals)
- 9.2.7. Chemical Industry
- 9.2.8. Other Ap
- 9.1. Market Analysis, Insights and Forecast - by Metal Type
- 10. South America PGM Industry Analysis, Insights and Forecast, 2020-2032
- 10.1. Market Analysis, Insights and Forecast - by Metal Type
- 10.1.1. Platinum
- 10.1.2. Palladium
- 10.1.3. Rhodium
- 10.1.4. Iridium
- 10.1.5. Ruthenium
- 10.1.6. Osmium
- 10.2. Market Analysis, Insights and Forecast - by Application
- 10.2.1. Auto Catalysts
- 10.2.2. Electrical and Electronics
- 10.2.3. Fuel Cells
- 10.2.4. Glass, Ceramics, and Pigments
- 10.2.5. Jewellery
- 10.2.6. Medical (Dental and Pharmaceuticals)
- 10.2.7. Chemical Industry
- 10.2.8. Other Ap
- 10.1. Market Analysis, Insights and Forecast - by Metal Type
- 11. Middle East and Africa PGM Industry Analysis, Insights and Forecast, 2020-2032
- 11.1. Market Analysis, Insights and Forecast - by Metal Type
- 11.1.1. Platinum
- 11.1.2. Palladium
- 11.1.3. Rhodium
- 11.1.4. Iridium
- 11.1.5. Ruthenium
- 11.1.6. Osmium
- 11.2. Market Analysis, Insights and Forecast - by Application
- 11.2.1. Auto Catalysts
- 11.2.2. Electrical and Electronics
- 11.2.3. Fuel Cells
- 11.2.4. Glass, Ceramics, and Pigments
- 11.2.5. Jewellery
- 11.2.6. Medical (Dental and Pharmaceuticals)
- 11.2.7. Chemical Industry
- 11.2.8. Other Ap
- 11.1. Market Analysis, Insights and Forecast - by Metal Type
- 12. Competitive Analysis
- 12.1. Company Profiles
- 12.1.1 ANGLO AMERICAN PLATINUM LIMITED
- 12.1.1.1. Company Overview
- 12.1.1.2. Products
- 12.1.1.3. Company Financials
- 12.1.1.4. SWOT Analysis
- 12.1.2 Implats Platinum Limited
- 12.1.2.1. Company Overview
- 12.1.2.2. Products
- 12.1.2.3. Company Financials
- 12.1.2.4. SWOT Analysis
- 12.1.3 Vale*List Not Exhaustive
- 12.1.3.1. Company Overview
- 12.1.3.2. Products
- 12.1.3.3. Company Financials
- 12.1.3.4. SWOT Analysis
- 12.1.4 Norilsk Nickel
- 12.1.4.1. Company Overview
- 12.1.4.2. Products
- 12.1.4.3. Company Financials
- 12.1.4.4. SWOT Analysis
- 12.1.5 African Rainbow Minerals Limited
- 12.1.5.1. Company Overview
- 12.1.5.2. Products
- 12.1.5.3. Company Financials
- 12.1.5.4. SWOT Analysis
- 12.1.6 GLENCORE
- 12.1.6.1. Company Overview
- 12.1.6.2. Products
- 12.1.6.3. Company Financials
- 12.1.6.4. SWOT Analysis
- 12.1.7 Northam Platinum Holdings Limited
- 12.1.7.1. Company Overview
- 12.1.7.2. Products
- 12.1.7.3. Company Financials
- 12.1.7.4. SWOT Analysis
- 12.1.8 Johnson Matthey
- 12.1.8.1. Company Overview
- 12.1.8.2. Products
- 12.1.8.3. Company Financials
- 12.1.8.4. SWOT Analysis
- 12.1.9 Sibanye-Stillwater
- 12.1.9.1. Company Overview
- 12.1.9.2. Products
- 12.1.9.3. Company Financials
- 12.1.9.4. SWOT Analysis
- 12.1.10 Platinum Group Metals Ltd
- 12.1.10.1. Company Overview
- 12.1.10.2. Products
- 12.1.10.3. Company Financials
- 12.1.10.4. SWOT Analysis
- 12.1.1 ANGLO AMERICAN PLATINUM LIMITED
- 12.2. Market Entropy
- 12.2.1 Company's Key Areas Served
- 12.2.2 Recent Developments
- 12.3. Company Market Share Analysis 2025
- 12.3.1 Top 5 Companies Market Share Analysis
- 12.3.2 Top 3 Companies Market Share Analysis
- 12.4. List of Potential Customers
- 13. Research Methodology
List of Figures
- Figure 1: Global PGM Industry Revenue Breakdown (billion, %) by Region 2025 & 2033
- Figure 2: Global PGM Industry Volume Breakdown (tons, %) by Region 2025 & 2033
- Figure 3: Asia Pacific PGM Industry Revenue (billion), by Metal Type 2025 & 2033
- Figure 4: Asia Pacific PGM Industry Volume (tons), by Metal Type 2025 & 2033
- Figure 5: Asia Pacific PGM Industry Revenue Share (%), by Metal Type 2025 & 2033
- Figure 6: Asia Pacific PGM Industry Volume Share (%), by Metal Type 2025 & 2033
- Figure 7: Asia Pacific PGM Industry Revenue (billion), by Application 2025 & 2033
- Figure 8: Asia Pacific PGM Industry Volume (tons), by Application 2025 & 2033
- Figure 9: Asia Pacific PGM Industry Revenue Share (%), by Application 2025 & 2033
- Figure 10: Asia Pacific PGM Industry Volume Share (%), by Application 2025 & 2033
- Figure 11: Asia Pacific PGM Industry Revenue (billion), by Country 2025 & 2033
- Figure 12: Asia Pacific PGM Industry Volume (tons), by Country 2025 & 2033
- Figure 13: Asia Pacific PGM Industry Revenue Share (%), by Country 2025 & 2033
- Figure 14: Asia Pacific PGM Industry Volume Share (%), by Country 2025 & 2033
- Figure 15: North America PGM Industry Revenue (billion), by Metal Type 2025 & 2033
- Figure 16: North America PGM Industry Volume (tons), by Metal Type 2025 & 2033
- Figure 17: North America PGM Industry Revenue Share (%), by Metal Type 2025 & 2033
- Figure 18: North America PGM Industry Volume Share (%), by Metal Type 2025 & 2033
- Figure 19: North America PGM Industry Revenue (billion), by Application 2025 & 2033
- Figure 20: North America PGM Industry Volume (tons), by Application 2025 & 2033
- Figure 21: North America PGM Industry Revenue Share (%), by Application 2025 & 2033
- Figure 22: North America PGM Industry Volume Share (%), by Application 2025 & 2033
- Figure 23: North America PGM Industry Revenue (billion), by Country 2025 & 2033
- Figure 24: North America PGM Industry Volume (tons), by Country 2025 & 2033
- Figure 25: North America PGM Industry Revenue Share (%), by Country 2025 & 2033
- Figure 26: North America PGM Industry Volume Share (%), by Country 2025 & 2033
- Figure 27: Europe PGM Industry Revenue (billion), by Metal Type 2025 & 2033
- Figure 28: Europe PGM Industry Volume (tons), by Metal Type 2025 & 2033
- Figure 29: Europe PGM Industry Revenue Share (%), by Metal Type 2025 & 2033
- Figure 30: Europe PGM Industry Volume Share (%), by Metal Type 2025 & 2033
- Figure 31: Europe PGM Industry Revenue (billion), by Application 2025 & 2033
- Figure 32: Europe PGM Industry Volume (tons), by Application 2025 & 2033
- Figure 33: Europe PGM Industry Revenue Share (%), by Application 2025 & 2033
- Figure 34: Europe PGM Industry Volume Share (%), by Application 2025 & 2033
- Figure 35: Europe PGM Industry Revenue (billion), by Country 2025 & 2033
- Figure 36: Europe PGM Industry Volume (tons), by Country 2025 & 2033
- Figure 37: Europe PGM Industry Revenue Share (%), by Country 2025 & 2033
- Figure 38: Europe PGM Industry Volume Share (%), by Country 2025 & 2033
- Figure 39: South America PGM Industry Revenue (billion), by Metal Type 2025 & 2033
- Figure 40: South America PGM Industry Volume (tons), by Metal Type 2025 & 2033
- Figure 41: South America PGM Industry Revenue Share (%), by Metal Type 2025 & 2033
- Figure 42: South America PGM Industry Volume Share (%), by Metal Type 2025 & 2033
- Figure 43: South America PGM Industry Revenue (billion), by Application 2025 & 2033
- Figure 44: South America PGM Industry Volume (tons), by Application 2025 & 2033
- Figure 45: South America PGM Industry Revenue Share (%), by Application 2025 & 2033
- Figure 46: South America PGM Industry Volume Share (%), by Application 2025 & 2033
- Figure 47: South America PGM Industry Revenue (billion), by Country 2025 & 2033
- Figure 48: South America PGM Industry Volume (tons), by Country 2025 & 2033
- Figure 49: South America PGM Industry Revenue Share (%), by Country 2025 & 2033
- Figure 50: South America PGM Industry Volume Share (%), by Country 2025 & 2033
- Figure 51: Middle East and Africa PGM Industry Revenue (billion), by Metal Type 2025 & 2033
- Figure 52: Middle East and Africa PGM Industry Volume (tons), by Metal Type 2025 & 2033
- Figure 53: Middle East and Africa PGM Industry Revenue Share (%), by Metal Type 2025 & 2033
- Figure 54: Middle East and Africa PGM Industry Volume Share (%), by Metal Type 2025 & 2033
- Figure 55: Middle East and Africa PGM Industry Revenue (billion), by Application 2025 & 2033
- Figure 56: Middle East and Africa PGM Industry Volume (tons), by Application 2025 & 2033
- Figure 57: Middle East and Africa PGM Industry Revenue Share (%), by Application 2025 & 2033
- Figure 58: Middle East and Africa PGM Industry Volume Share (%), by Application 2025 & 2033
- Figure 59: Middle East and Africa PGM Industry Revenue (billion), by Country 2025 & 2033
- Figure 60: Middle East and Africa PGM Industry Volume (tons), by Country 2025 & 2033
- Figure 61: Middle East and Africa PGM Industry Revenue Share (%), by Country 2025 & 2033
- Figure 62: Middle East and Africa PGM Industry Volume Share (%), by Country 2025 & 2033
List of Tables
- Table 1: Global PGM Industry Revenue billion Forecast, by Metal Type 2020 & 2033
- Table 2: Global PGM Industry Volume tons Forecast, by Metal Type 2020 & 2033
- Table 3: Global PGM Industry Revenue billion Forecast, by Application 2020 & 2033
- Table 4: Global PGM Industry Volume tons Forecast, by Application 2020 & 2033
- Table 5: Global PGM Industry Revenue billion Forecast, by Region 2020 & 2033
- Table 6: Global PGM Industry Volume tons Forecast, by Region 2020 & 2033
- Table 7: Global PGM Industry Revenue billion Forecast, by Metal Type 2020 & 2033
- Table 8: Global PGM Industry Volume tons Forecast, by Metal Type 2020 & 2033
- Table 9: Global PGM Industry Revenue billion Forecast, by Application 2020 & 2033
- Table 10: Global PGM Industry Volume tons Forecast, by Application 2020 & 2033
- Table 11: Global PGM Industry Revenue billion Forecast, by Country 2020 & 2033
- Table 12: Global PGM Industry Volume tons Forecast, by Country 2020 & 2033
- Table 13: China PGM Industry Revenue (billion) Forecast, by Application 2020 & 2033
- Table 14: China PGM Industry Volume (tons) Forecast, by Application 2020 & 2033
- Table 15: India PGM Industry Revenue (billion) Forecast, by Application 2020 & 2033
- Table 16: India PGM Industry Volume (tons) Forecast, by Application 2020 & 2033
- Table 17: Japan PGM Industry Revenue (billion) Forecast, by Application 2020 & 2033
- Table 18: Japan PGM Industry Volume (tons) Forecast, by Application 2020 & 2033
- Table 19: South Korea PGM Industry Revenue (billion) Forecast, by Application 2020 & 2033
- Table 20: South Korea PGM Industry Volume (tons) Forecast, by Application 2020 & 2033
- Table 21: ASEAN Countries PGM Industry Revenue (billion) Forecast, by Application 2020 & 2033
- Table 22: ASEAN Countries PGM Industry Volume (tons) Forecast, by Application 2020 & 2033
- Table 23: Rest of Asia Pacific PGM Industry Revenue (billion) Forecast, by Application 2020 & 2033
- Table 24: Rest of Asia Pacific PGM Industry Volume (tons) Forecast, by Application 2020 & 2033
- Table 25: Global PGM Industry Revenue billion Forecast, by Metal Type 2020 & 2033
- Table 26: Global PGM Industry Volume tons Forecast, by Metal Type 2020 & 2033
- Table 27: Global PGM Industry Revenue billion Forecast, by Application 2020 & 2033
- Table 28: Global PGM Industry Volume tons Forecast, by Application 2020 & 2033
- Table 29: Global PGM Industry Revenue billion Forecast, by Country 2020 & 2033
- Table 30: Global PGM Industry Volume tons Forecast, by Country 2020 & 2033
- Table 31: United States PGM Industry Revenue (billion) Forecast, by Application 2020 & 2033
- Table 32: United States PGM Industry Volume (tons) Forecast, by Application 2020 & 2033
- Table 33: Canada PGM Industry Revenue (billion) Forecast, by Application 2020 & 2033
- Table 34: Canada PGM Industry Volume (tons) Forecast, by Application 2020 & 2033
- Table 35: Mexico PGM Industry Revenue (billion) Forecast, by Application 2020 & 2033
- Table 36: Mexico PGM Industry Volume (tons) Forecast, by Application 2020 & 2033
- Table 37: Global PGM Industry Revenue billion Forecast, by Metal Type 2020 & 2033
- Table 38: Global PGM Industry Volume tons Forecast, by Metal Type 2020 & 2033
- Table 39: Global PGM Industry Revenue billion Forecast, by Application 2020 & 2033
- Table 40: Global PGM Industry Volume tons Forecast, by Application 2020 & 2033
- Table 41: Global PGM Industry Revenue billion Forecast, by Country 2020 & 2033
- Table 42: Global PGM Industry Volume tons Forecast, by Country 2020 & 2033
- Table 43: Germany PGM Industry Revenue (billion) Forecast, by Application 2020 & 2033
- Table 44: Germany PGM Industry Volume (tons) Forecast, by Application 2020 & 2033
- Table 45: United Kingdom PGM Industry Revenue (billion) Forecast, by Application 2020 & 2033
- Table 46: United Kingdom PGM Industry Volume (tons) Forecast, by Application 2020 & 2033
- Table 47: Italy PGM Industry Revenue (billion) Forecast, by Application 2020 & 2033
- Table 48: Italy PGM Industry Volume (tons) Forecast, by Application 2020 & 2033
- Table 49: France PGM Industry Revenue (billion) Forecast, by Application 2020 & 2033
- Table 50: France PGM Industry Volume (tons) Forecast, by Application 2020 & 2033
- Table 51: Rest of Europe PGM Industry Revenue (billion) Forecast, by Application 2020 & 2033
- Table 52: Rest of Europe PGM Industry Volume (tons) Forecast, by Application 2020 & 2033
- Table 53: Global PGM Industry Revenue billion Forecast, by Metal Type 2020 & 2033
- Table 54: Global PGM Industry Volume tons Forecast, by Metal Type 2020 & 2033
- Table 55: Global PGM Industry Revenue billion Forecast, by Application 2020 & 2033
- Table 56: Global PGM Industry Volume tons Forecast, by Application 2020 & 2033
- Table 57: Global PGM Industry Revenue billion Forecast, by Country 2020 & 2033
- Table 58: Global PGM Industry Volume tons Forecast, by Country 2020 & 2033
- Table 59: Brazil PGM Industry Revenue (billion) Forecast, by Application 2020 & 2033
- Table 60: Brazil PGM Industry Volume (tons) Forecast, by Application 2020 & 2033
- Table 61: Argentina PGM Industry Revenue (billion) Forecast, by Application 2020 & 2033
- Table 62: Argentina PGM Industry Volume (tons) Forecast, by Application 2020 & 2033
- Table 63: Rest of South America PGM Industry Revenue (billion) Forecast, by Application 2020 & 2033
- Table 64: Rest of South America PGM Industry Volume (tons) Forecast, by Application 2020 & 2033
- Table 65: Global PGM Industry Revenue billion Forecast, by Metal Type 2020 & 2033
- Table 66: Global PGM Industry Volume tons Forecast, by Metal Type 2020 & 2033
- Table 67: Global PGM Industry Revenue billion Forecast, by Application 2020 & 2033
- Table 68: Global PGM Industry Volume tons Forecast, by Application 2020 & 2033
- Table 69: Global PGM Industry Revenue billion Forecast, by Country 2020 & 2033
- Table 70: Global PGM Industry Volume tons Forecast, by Country 2020 & 2033
- Table 71: Saudi Arabia PGM Industry Revenue (billion) Forecast, by Application 2020 & 2033
- Table 72: Saudi Arabia PGM Industry Volume (tons) Forecast, by Application 2020 & 2033
- Table 73: South Africa PGM Industry Revenue (billion) Forecast, by Application 2020 & 2033
- Table 74: South Africa PGM Industry Volume (tons) Forecast, by Application 2020 & 2033
- Table 75: Rest of Middle East and Africa PGM Industry Revenue (billion) Forecast, by Application 2020 & 2033
- Table 76: Rest of Middle East and Africa PGM Industry Volume (tons) Forecast, by Application 2020 & 2033
Frequently Asked Questions
1. What is the projected Compound Annual Growth Rate (CAGR) of the PGM Industry?
The projected CAGR is approximately 3.31%.
2. Which companies are prominent players in the PGM Industry?
Key companies in the market include ANGLO AMERICAN PLATINUM LIMITED, Implats Platinum Limited, Vale*List Not Exhaustive, Norilsk Nickel, African Rainbow Minerals Limited, GLENCORE, Northam Platinum Holdings Limited, Johnson Matthey, Sibanye-Stillwater, Platinum Group Metals Ltd.
3. What are the main segments of the PGM Industry?
The market segments include Metal Type, Application.
4. Can you provide details about the market size?
The market size is estimated to be USD 41.59 billion as of 2022.
5. What are some drivers contributing to market growth?
Growing Demand for Catalytic Converters from the Automotive Industry; Increasing Demand for Platinum. Palladium. and Ruthenium from the Electronics Industry; Growing Jewelry Consumption in Asia-Pacific Countries.
6. What are the notable trends driving market growth?
Autocatalysts Segment to Dominate the Market.
7. Are there any restraints impacting market growth?
High Costs Involved in Production and Maintenance; Other Restraints.
8. Can you provide examples of recent developments in the market?
November 2023: Sibanye-Stillwater agreed to acquire Reldan, a metal recycler based in the United States. Reldan is a Pennsylvania-based recycling group that reprocesses various waste streams, including industrial and electronic waste, to recycle green precious metals such as platinum and palladium.
9. What pricing options are available for accessing the report?
Pricing options include single-user, multi-user, and enterprise licenses priced at USD 4750, USD 5250, and USD 8750 respectively.
10. Is the market size provided in terms of value or volume?
The market size is provided in terms of value, measured in billion and volume, measured in tons.
11. Are there any specific market keywords associated with the report?
Yes, the market keyword associated with the report is "PGM Industry," which aids in identifying and referencing the specific market segment covered.
12. How do I determine which pricing option suits my needs best?
The pricing options vary based on user requirements and access needs. Individual users may opt for single-user licenses, while businesses requiring broader access may choose multi-user or enterprise licenses for cost-effective access to the report.
13. Are there any additional resources or data provided in the PGM Industry report?
While the report offers comprehensive insights, it's advisable to review the specific contents or supplementary materials provided to ascertain if additional resources or data are available.
14. How can I stay updated on further developments or reports in the PGM Industry?
To stay informed about further developments, trends, and reports in the PGM Industry, consider subscribing to industry newsletters, following relevant companies and organizations, or regularly checking reputable industry news sources and publications.
Methodology
Step 1 - Identification of Relevant Samples Size from Population Database


Step 2 - Approaches for Defining Global Market Size (Value, Volume* & Price*)

Note*: In applicable scenarios
Step 3 - Data Sources
Primary Research
- Web Analytics
- Survey Reports
- Research Institute
- Latest Research Reports
- Opinion Leaders
Secondary Research
- Annual Reports
- White Paper
- Latest Press Release
- Industry Association
- Paid Database
- Investor Presentations

Step 4 - Data Triangulation
Involves using different sources of information in order to increase the validity of a study
These sources are likely to be stakeholders in a program - participants, other researchers, program staff, other community members, and so on.
Then we put all data in single framework & apply various statistical tools to find out the dynamic on the market.
During the analysis stage, feedback from the stakeholder groups would be compared to determine areas of agreement as well as areas of divergence