

Key Insights
The global perlite market is projected for significant expansion, reaching an estimated market size of 2.45 billion by the base year 2025. The market is expected to grow at a Compound Annual Growth Rate (CAGR) of 5.78% through 2033. This robust growth is driven by increasing demand across key sectors, including construction for insulation and fireproofing, and horticulture for superior soil conditioning. The adoption of perlite in advanced filtration for beverages and industrial liquids, alongside its use in lightweight aggregates for concrete and as functional fillers in paints and plastics, further solidifies its market position as a versatile industrial mineral.
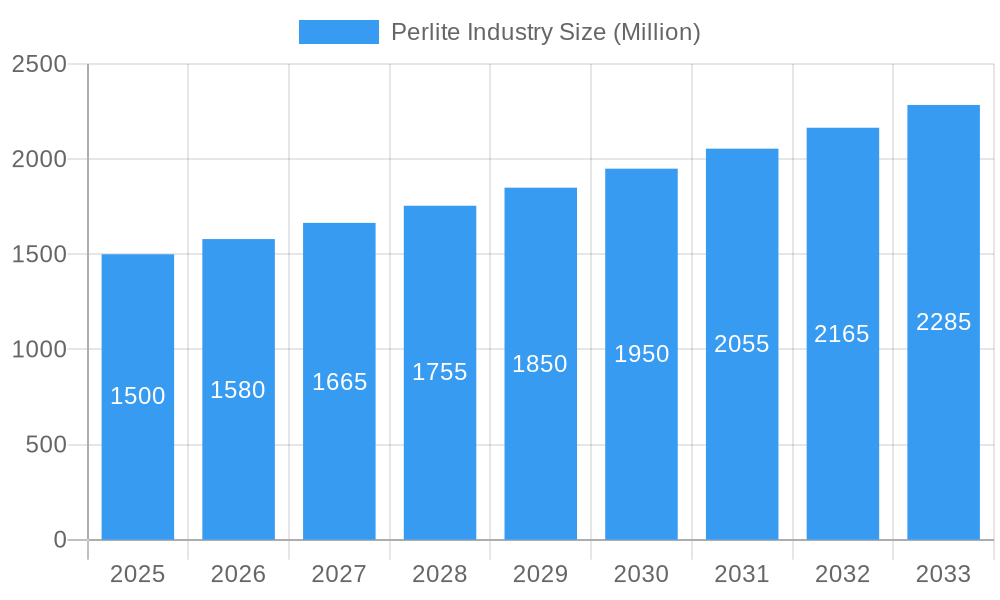
Perlite Industry Market Size (In Billion)
Key growth catalysts include the heightened focus on energy efficiency in construction, boosting demand for perlite-based insulation. Sustainable agriculture practices and the need for improved soil health are also driving the demand for agro-perlite. While raw material availability and transportation costs present potential challenges, advancements in processing techniques and the discovery of new perlite deposits are mitigating these factors. The Asia Pacific region, particularly China and India, is anticipated to lead growth due to rapid industrialization and infrastructure development. North America and Europe represent substantial markets, driven by stringent building regulations and mature industrial sectors that value perlite's thermal and acoustic insulation properties.
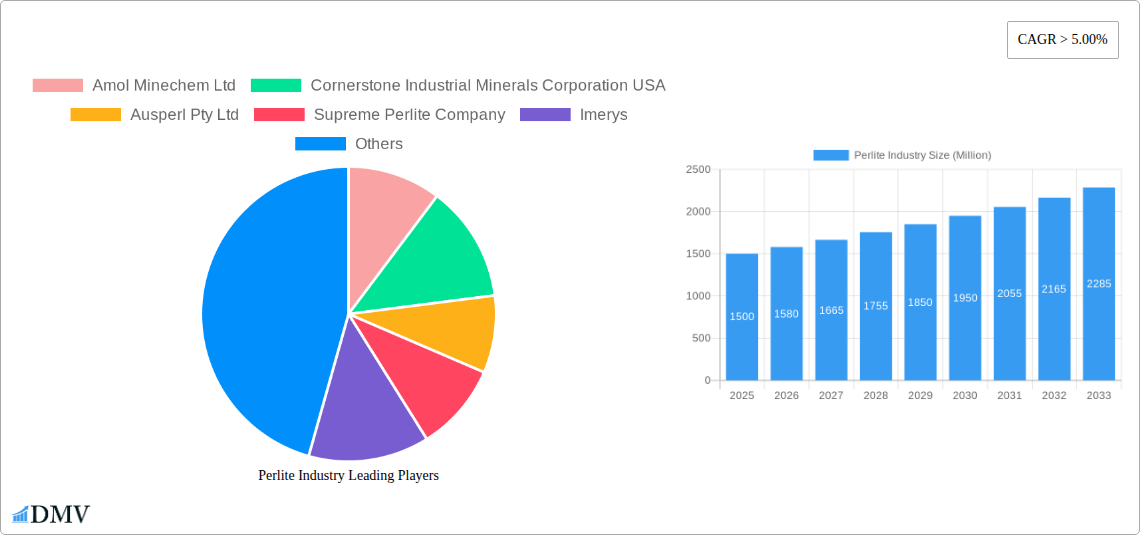
Perlite Industry Company Market Share
Perlite Industry Market Composition & Trends
The global perlite industry is characterized by a moderately concentrated market structure, with key players strategically investing in expanding production capacities and diversifying applications. Innovation catalysts are primarily driven by the demand for sustainable and lightweight materials across various sectors, from construction to agriculture. Regulatory landscapes are evolving, with a growing emphasis on environmental compliance and material safety standards influencing production processes and product development. While direct substitutes for perlite's unique properties are limited, the industry faces competition from alternative lightweight aggregates and insulating materials. End-user profiles span a broad spectrum, including construction firms seeking enhanced thermal insulation and fire-proofing solutions, agricultural enterprises utilizing agro-perlite for improved soil aeration and water retention, and industrial manufacturers employing perlite in filtration and as fillers. Mergers and acquisitions (M&A) activities, though not consistently high in value, indicate strategic consolidation and a drive for vertical integration. For instance, recent M&A activities point towards a market value shift by XXX Million within the last fiscal year. The market share distribution is largely dominated by expanded perlite, accounting for an estimated XX% of the total market revenue, followed by agro-perlite and other specialized product types. The growing awareness of perlite's recyclability and low environmental impact further solidifies its market position.
Perlite Industry Industry Evolution
The perlite industry has undergone a significant evolutionary trajectory, marked by consistent growth and adaptation to diverse market demands. From its nascent stages, perlite's unique characteristics—lightweight nature, excellent thermal insulation, fire resistance, and inertness—positioned it as a valuable material across numerous applications. The historical period from 2019 to 2024 witnessed a steady CAGR of approximately XX%, driven by increasing construction activities globally and a growing preference for energy-efficient building materials. Technological advancements have played a pivotal role in this evolution. Innovations in perlite processing, such as improved expansion techniques and micronization, have led to the development of finer grades suitable for specialized applications like cosmetics and plastics. The agricultural sector has also seen significant advancements, with the development of tailored agro-perlite formulations enhancing crop yields and reducing water usage. Consumer demand has shifted considerably, with a heightened awareness of sustainability and eco-friendly products favoring perlite over traditional materials. The forecast period from 2025 to 2033 is projected to experience a robust CAGR of XX%, propelled by stringent building codes mandating higher insulation standards, the burgeoning demand for lightweight construction materials, and the expanding use of perlite in horticulture and hydroponics. The estimated market size for 2025 is projected to reach XXX Million. Furthermore, the industry is witnessing a greater integration of perlite into advanced composites and innovative solutions, such as perlite-enhanced concrete and plaster, further expanding its application horizon. The base year of 2025 serves as a crucial benchmark for evaluating future market performance and strategic planning within the perlite ecosystem.
Leading Regions, Countries, or Segments in Perlite Industry
The dominance within the perlite industry is multifaceted, with specific regions, countries, and product segments exhibiting significant leadership. Among the Product Types, Expanded Perlite consistently commands the largest market share, estimated at XX% of the global market revenue for 2025. This is attributed to its widespread application in construction for insulation, fire-proofing, and lightweight concrete, areas experiencing robust growth. For instance, the construction sector's demand for expanded perlite is projected to grow at a CAGR of XX% during the forecast period.
Within the Application segments, Insulation stands out as a primary driver of perlite demand, accounting for an estimated XX% of the total application market. Key drivers for this dominance include:
- Stringent Building Codes: Many countries have implemented stricter energy efficiency standards, mandating the use of superior insulating materials like perlite in residential and commercial buildings.
- Demand for Lightweight Materials: The construction industry's push for lighter structures to reduce foundation costs and improve seismic resistance directly benefits expanded perlite.
- Growing Green Building Initiatives: Perlite's natural origin, recyclability, and contribution to energy savings align perfectly with sustainable construction practices.
Geographically, North America has historically been a leading region due to its well-established construction industry and significant perlite reserves. The United States, in particular, is a major consumer and producer, with extensive mining operations and a strong manufacturing base for perlite-based products. The region's robust demand for construction materials, coupled with ongoing infrastructure development projects, fuels this leadership.
However, Asia-Pacific is emerging as a significant growth powerhouse, driven by rapid urbanization, a burgeoning construction sector in countries like China and India, and increasing awareness of energy-efficient building solutions. The CAGR for perlite consumption in the Asia-Pacific region is anticipated to be around XX% from 2025 to 2033. Key drivers in this region include:
- Rapid Urbanization and Infrastructure Development: Extensive new construction projects necessitate large volumes of building materials, including perlite.
- Government Initiatives for Sustainable Construction: Many APAC governments are promoting green building practices, indirectly boosting perlite adoption.
- Growing Demand for Agro-Perlite: The increasing focus on improving agricultural productivity and water management in this region is a significant driver for agro-perlite.
In terms of specific countries, the United States and China are anticipated to be major contributors to global perlite market growth due to their substantial industrial and construction sectors.
Perlite Industry Product Innovations
Product innovation in the perlite industry is focused on enhancing performance and expanding application frontiers. Recent advancements include the development of ultra-fine perlite grades for high-performance fillers in paints and coatings, offering improved rheology and scratch resistance. In agriculture, novel agro-perlite formulations with slow-release nutrient coatings are emerging, optimizing fertilizer efficiency and reducing environmental runoff. For fire-proofing applications, advanced perlite composites are demonstrating superior thermal insulation properties at elevated temperatures. Furthermore, research is exploring the use of perlite in advanced insulation systems for renewable energy technologies, showcasing its versatility.
Propelling Factors for Perlite Industry Growth
The perlite industry's growth is propelled by several key factors. Firstly, the increasing global demand for lightweight and sustainable construction materials directly fuels the consumption of expanded perlite for insulation and fire-proofing, driven by stringent energy efficiency regulations. Secondly, advancements in agricultural practices, such as hydroponics and improved soil conditioning, are boosting the demand for agro-perlite. Thirdly, technological innovations are enabling new applications for perlite, such as in advanced filtration systems and as a functional filler in plastics and coatings. The inherent recyclability and low environmental impact of perlite further align with growing eco-consciousness and green initiatives. The projected market growth is further supported by an estimated XX% increase in perlite production capacity in key regions.
Obstacles in the Perlite Industry Market
Despite its growth potential, the perlite industry faces several obstacles. Fluctuations in raw material prices and energy costs for the expansion process can impact profit margins. Supply chain disruptions, exacerbated by logistical challenges and geopolitical instability, can affect the availability and timely delivery of perlite products. Regulatory hurdles related to mining permits and environmental impact assessments can create delays and increase operational costs. Furthermore, while perlite offers unique advantages, it faces competition from alternative lightweight aggregates and insulating materials, requiring continuous innovation and competitive pricing strategies to maintain market share. The cost of specialized processing for niche applications can also be a barrier to wider adoption.
Future Opportunities in Perlite Industry
Emerging opportunities in the perlite industry are diverse and promising. The increasing focus on sustainable building practices presents significant potential for perlite-based insulation and fire-proofing materials. The booming global demand for organic food and advanced horticultural techniques is creating a robust market for specialized agro-perlite. Furthermore, the exploration of perlite in novel applications, such as advanced filtration media for water treatment and as a functional additive in high-performance composites, offers significant growth avenues. The development of perlite-based materials for thermal energy storage and in the electronics industry also represents emerging frontiers. The market is expected to see an increase of XX Million in new application-driven demand by 2030.
Major Players in the Perlite Industry Ecosystem
- Amol Minechem Ltd
- Cornerstone Industrial Minerals Corporation USA
- Ausperl Pty Ltd
- Supreme Perlite Company
- Imerys
- Termolita
- Profiltra BV
- Midwest Perlite
- Carolina Perlite Co Inc
- Azer Perlite Corporation
- Blue Pacific Minerals
- Omya AG
- Mianeh Prlite Expanding Co Ltd
- Saudi Perlite Industries
- Bergama Mining Perlite
Key Developments in Perlite Industry Industry
- February 2023: Titan Cement acquired a share in Aegean Perlites, which operates perlite and pozzolan quarries on the island of Yali. This strategic move allows Titan to invest in direct access to pozzolan reserves, aiming to increase its volume of pozzolan-based cementitious products with a lower clinker factor. This acquisition is aligned with Titan's target to reduce CO2 emissions by 35% by 2030 and increase the share of green products in its portfolio.
- April 2022: Silica Holdings, Inc. announced price increases for most of its non-contracted diatomaceous earth, perlite, and cellulose products. This decision was driven by ongoing inflationary pressures on raw materials, packaging, labor, logistics, and maintenance expenses, impacting sectors such as food and beverage filtration, renewable diesel, catalysts, and coatings.
Strategic Perlite Industry Market Forecast
The strategic forecast for the perlite industry indicates sustained and robust growth, driven by the increasing global emphasis on sustainable materials and energy efficiency. The construction sector, propelled by regulatory mandates for enhanced insulation and fire-proofing, will continue to be a primary demand driver. Concurrently, the agricultural sector's embrace of perlite for soil improvement and water management in hydroponic and organic farming practices will offer significant expansion opportunities. Innovations in processing and product development are expected to unlock new, high-value applications in filtration, advanced composites, and other niche industrial segments. The market is poised for a cumulative growth of XX% from 2025 to 2033, with key players investing strategically in capacity expansion and technological advancements to capitalize on these evolving market dynamics, projecting a market size exceeding XXX Million by 2033.
Perlite Industry Segmentation
-
1. Product Type
- 1.1. Expanded Perlite
- 1.2. Agro-perlite
- 1.3. Vapex
- 1.4. Other Product Types
-
2. Application
- 2.1. Fillers
- 2.2. Fire-proofing
- 2.3. Insulation
- 2.4. Filtration
- 2.5. Abrasives
- 2.6. Other Applications
Perlite Industry Segmentation By Geography
-
1. Asia Pacific
- 1.1. China
- 1.2. India
- 1.3. Japan
- 1.4. South Korea
- 1.5. Rest of Asia Pacific
-
2. North America
- 2.1. United States
- 2.2. Canada
- 2.3. Mexico
- 2.4. Rest of North America
-
3. Europe
- 3.1. Germany
- 3.2. United Kingdom
- 3.3. France
- 3.4. Italy
- 3.5. Russia
- 3.6. Rest of Europe
-
4. South America
- 4.1. Brazil
- 4.2. Argentina
- 4.3. Rest of South America
-
5. Middle East and Africa
- 5.1. Saudi Arabia
- 5.2. South Africa
- 5.3. UAE
- 5.4. Rest of Middle East and Africa
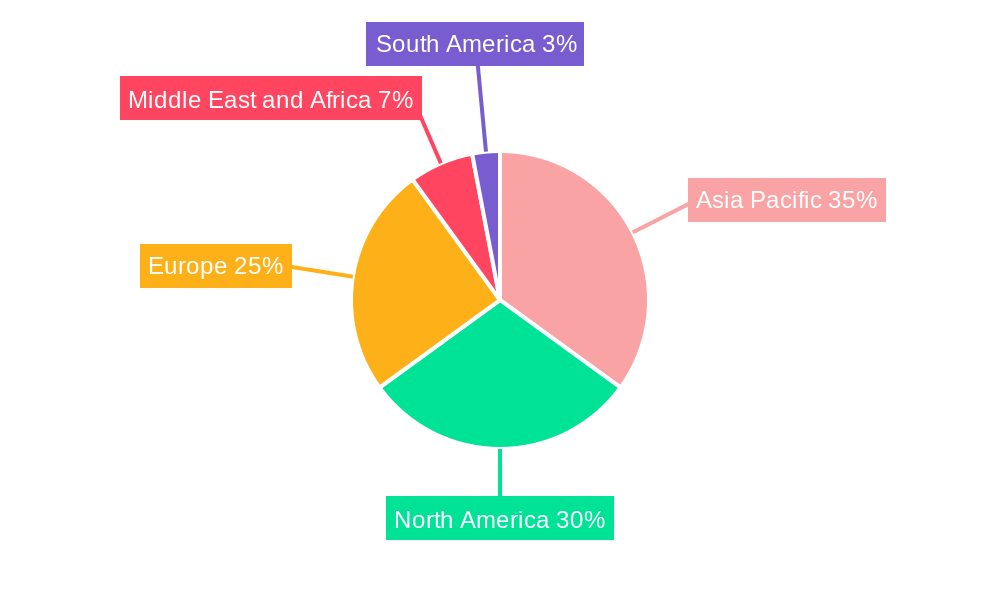
Perlite Industry Regional Market Share
Geographic Coverage of Perlite Industry
Perlite Industry REPORT HIGHLIGHTS
| Aspects | Details |
|---|---|
| Study Period | 2020-2034 |
| Base Year | 2025 |
| Estimated Year | 2026 |
| Forecast Period | 2026-2034 |
| Historical Period | 2020-2025 |
| Growth Rate | CAGR of 5.78% from 2020-2034 |
| Segmentation |
|
Table of Contents
- 1. Introduction
- 1.1. Research Scope
- 1.2. Market Segmentation
- 1.3. Research Objective
- 1.4. Definitions and Assumptions
- 2. Executive Summary
- 2.1. Market Snapshot
- 3. Market Dynamics
- 3.1. Market Drivers
- 3.2. Market Restrains
- 3.3. Market Trends
- 3.4. Market Opportunities
- 4. Market Factor Analysis
- 4.1. Porters Five Forces
- 4.1.1. Bargaining Power of Suppliers
- 4.1.2. Bargaining Power of Buyers
- 4.1.3. Threat of New Entrants
- 4.1.4. Threat of Substitutes
- 4.1.5. Competitive Rivalry
- 4.2. PESTEL analysis
- 4.3. BCG Analysis
- 4.3.1. Stars (High Growth, High Market Share)
- 4.3.2. Cash Cows (Low Growth, High Market Share)
- 4.3.3. Question Mark (High Growth, Low Market Share)
- 4.3.4. Dogs (Low Growth, Low Market Share)
- 4.4. Ansoff Matrix Analysis
- 4.5. Supply Chain Analysis
- 4.6. Regulatory Landscape
- 4.7. Current Market Potential and Opportunity Assessment (TAM–SAM–SOM Framework)
- 4.8. DMV Analyst Note
- 4.1. Porters Five Forces
- 5. Market Analysis, Insights and Forecast 2021-2033
- 5.1. Market Analysis, Insights and Forecast - by Product Type
- 5.1.1. Expanded Perlite
- 5.1.2. Agro-perlite
- 5.1.3. Vapex
- 5.1.4. Other Product Types
- 5.2. Market Analysis, Insights and Forecast - by Application
- 5.2.1. Fillers
- 5.2.2. Fire-proofing
- 5.2.3. Insulation
- 5.2.4. Filtration
- 5.2.5. Abrasives
- 5.2.6. Other Applications
- 5.3. Market Analysis, Insights and Forecast - by Region
- 5.3.1. Asia Pacific
- 5.3.2. North America
- 5.3.3. Europe
- 5.3.4. South America
- 5.3.5. Middle East and Africa
- 5.1. Market Analysis, Insights and Forecast - by Product Type
- 6. Global Perlite Industry Analysis, Insights and Forecast, 2021-2033
- 6.1. Market Analysis, Insights and Forecast - by Product Type
- 6.1.1. Expanded Perlite
- 6.1.2. Agro-perlite
- 6.1.3. Vapex
- 6.1.4. Other Product Types
- 6.2. Market Analysis, Insights and Forecast - by Application
- 6.2.1. Fillers
- 6.2.2. Fire-proofing
- 6.2.3. Insulation
- 6.2.4. Filtration
- 6.2.5. Abrasives
- 6.2.6. Other Applications
- 6.1. Market Analysis, Insights and Forecast - by Product Type
- 7. Asia Pacific Perlite Industry Analysis, Insights and Forecast, 2020-2032
- 7.1. Market Analysis, Insights and Forecast - by Product Type
- 7.1.1. Expanded Perlite
- 7.1.2. Agro-perlite
- 7.1.3. Vapex
- 7.1.4. Other Product Types
- 7.2. Market Analysis, Insights and Forecast - by Application
- 7.2.1. Fillers
- 7.2.2. Fire-proofing
- 7.2.3. Insulation
- 7.2.4. Filtration
- 7.2.5. Abrasives
- 7.2.6. Other Applications
- 7.1. Market Analysis, Insights and Forecast - by Product Type
- 8. North America Perlite Industry Analysis, Insights and Forecast, 2020-2032
- 8.1. Market Analysis, Insights and Forecast - by Product Type
- 8.1.1. Expanded Perlite
- 8.1.2. Agro-perlite
- 8.1.3. Vapex
- 8.1.4. Other Product Types
- 8.2. Market Analysis, Insights and Forecast - by Application
- 8.2.1. Fillers
- 8.2.2. Fire-proofing
- 8.2.3. Insulation
- 8.2.4. Filtration
- 8.2.5. Abrasives
- 8.2.6. Other Applications
- 8.1. Market Analysis, Insights and Forecast - by Product Type
- 9. Europe Perlite Industry Analysis, Insights and Forecast, 2020-2032
- 9.1. Market Analysis, Insights and Forecast - by Product Type
- 9.1.1. Expanded Perlite
- 9.1.2. Agro-perlite
- 9.1.3. Vapex
- 9.1.4. Other Product Types
- 9.2. Market Analysis, Insights and Forecast - by Application
- 9.2.1. Fillers
- 9.2.2. Fire-proofing
- 9.2.3. Insulation
- 9.2.4. Filtration
- 9.2.5. Abrasives
- 9.2.6. Other Applications
- 9.1. Market Analysis, Insights and Forecast - by Product Type
- 10. South America Perlite Industry Analysis, Insights and Forecast, 2020-2032
- 10.1. Market Analysis, Insights and Forecast - by Product Type
- 10.1.1. Expanded Perlite
- 10.1.2. Agro-perlite
- 10.1.3. Vapex
- 10.1.4. Other Product Types
- 10.2. Market Analysis, Insights and Forecast - by Application
- 10.2.1. Fillers
- 10.2.2. Fire-proofing
- 10.2.3. Insulation
- 10.2.4. Filtration
- 10.2.5. Abrasives
- 10.2.6. Other Applications
- 10.1. Market Analysis, Insights and Forecast - by Product Type
- 11. Middle East and Africa Perlite Industry Analysis, Insights and Forecast, 2020-2032
- 11.1. Market Analysis, Insights and Forecast - by Product Type
- 11.1.1. Expanded Perlite
- 11.1.2. Agro-perlite
- 11.1.3. Vapex
- 11.1.4. Other Product Types
- 11.2. Market Analysis, Insights and Forecast - by Application
- 11.2.1. Fillers
- 11.2.2. Fire-proofing
- 11.2.3. Insulation
- 11.2.4. Filtration
- 11.2.5. Abrasives
- 11.2.6. Other Applications
- 11.1. Market Analysis, Insights and Forecast - by Product Type
- 12. Competitive Analysis
- 12.1. Company Profiles
- 12.1.1 Amol Minechem Ltd
- 12.1.1.1. Company Overview
- 12.1.1.2. Products
- 12.1.1.3. Company Financials
- 12.1.1.4. SWOT Analysis
- 12.1.2 Cornerstone Industrial Minerals Corporation USA
- 12.1.2.1. Company Overview
- 12.1.2.2. Products
- 12.1.2.3. Company Financials
- 12.1.2.4. SWOT Analysis
- 12.1.3 Ausperl Pty Ltd
- 12.1.3.1. Company Overview
- 12.1.3.2. Products
- 12.1.3.3. Company Financials
- 12.1.3.4. SWOT Analysis
- 12.1.4 Supreme Perlite Company
- 12.1.4.1. Company Overview
- 12.1.4.2. Products
- 12.1.4.3. Company Financials
- 12.1.4.4. SWOT Analysis
- 12.1.5 Imerys
- 12.1.5.1. Company Overview
- 12.1.5.2. Products
- 12.1.5.3. Company Financials
- 12.1.5.4. SWOT Analysis
- 12.1.6 Termolita
- 12.1.6.1. Company Overview
- 12.1.6.2. Products
- 12.1.6.3. Company Financials
- 12.1.6.4. SWOT Analysis
- 12.1.7 Profiltra BV
- 12.1.7.1. Company Overview
- 12.1.7.2. Products
- 12.1.7.3. Company Financials
- 12.1.7.4. SWOT Analysis
- 12.1.8 Midwest Perlite
- 12.1.8.1. Company Overview
- 12.1.8.2. Products
- 12.1.8.3. Company Financials
- 12.1.8.4. SWOT Analysis
- 12.1.9 Carolina Perlite Co Inc
- 12.1.9.1. Company Overview
- 12.1.9.2. Products
- 12.1.9.3. Company Financials
- 12.1.9.4. SWOT Analysis
- 12.1.10 Azer Perlite Corporation
- 12.1.10.1. Company Overview
- 12.1.10.2. Products
- 12.1.10.3. Company Financials
- 12.1.10.4. SWOT Analysis
- 12.1.11 Blue Pacific Minerals
- 12.1.11.1. Company Overview
- 12.1.11.2. Products
- 12.1.11.3. Company Financials
- 12.1.11.4. SWOT Analysis
- 12.1.12 Omya AG
- 12.1.12.1. Company Overview
- 12.1.12.2. Products
- 12.1.12.3. Company Financials
- 12.1.12.4. SWOT Analysis
- 12.1.13 Mianeh Prlite Expanding Co Ltd
- 12.1.13.1. Company Overview
- 12.1.13.2. Products
- 12.1.13.3. Company Financials
- 12.1.13.4. SWOT Analysis
- 12.1.14 Saudi Perlite Industries
- 12.1.14.1. Company Overview
- 12.1.14.2. Products
- 12.1.14.3. Company Financials
- 12.1.14.4. SWOT Analysis
- 12.1.15 Bergama Mining Perlite
- 12.1.15.1. Company Overview
- 12.1.15.2. Products
- 12.1.15.3. Company Financials
- 12.1.15.4. SWOT Analysis
- 12.1.1 Amol Minechem Ltd
- 12.2. Market Entropy
- 12.2.1 Company's Key Areas Served
- 12.2.2 Recent Developments
- 12.3. Company Market Share Analysis 2025
- 12.3.1 Top 5 Companies Market Share Analysis
- 12.3.2 Top 3 Companies Market Share Analysis
- 12.4. List of Potential Customers
- 13. Research Methodology
List of Figures
- Figure 1: Global Perlite Industry Revenue Breakdown (billion, %) by Region 2025 & 2033
- Figure 2: Global Perlite Industry Volume Breakdown (K Tons, %) by Region 2025 & 2033
- Figure 3: Asia Pacific Perlite Industry Revenue (billion), by Product Type 2025 & 2033
- Figure 4: Asia Pacific Perlite Industry Volume (K Tons), by Product Type 2025 & 2033
- Figure 5: Asia Pacific Perlite Industry Revenue Share (%), by Product Type 2025 & 2033
- Figure 6: Asia Pacific Perlite Industry Volume Share (%), by Product Type 2025 & 2033
- Figure 7: Asia Pacific Perlite Industry Revenue (billion), by Application 2025 & 2033
- Figure 8: Asia Pacific Perlite Industry Volume (K Tons), by Application 2025 & 2033
- Figure 9: Asia Pacific Perlite Industry Revenue Share (%), by Application 2025 & 2033
- Figure 10: Asia Pacific Perlite Industry Volume Share (%), by Application 2025 & 2033
- Figure 11: Asia Pacific Perlite Industry Revenue (billion), by Country 2025 & 2033
- Figure 12: Asia Pacific Perlite Industry Volume (K Tons), by Country 2025 & 2033
- Figure 13: Asia Pacific Perlite Industry Revenue Share (%), by Country 2025 & 2033
- Figure 14: Asia Pacific Perlite Industry Volume Share (%), by Country 2025 & 2033
- Figure 15: North America Perlite Industry Revenue (billion), by Product Type 2025 & 2033
- Figure 16: North America Perlite Industry Volume (K Tons), by Product Type 2025 & 2033
- Figure 17: North America Perlite Industry Revenue Share (%), by Product Type 2025 & 2033
- Figure 18: North America Perlite Industry Volume Share (%), by Product Type 2025 & 2033
- Figure 19: North America Perlite Industry Revenue (billion), by Application 2025 & 2033
- Figure 20: North America Perlite Industry Volume (K Tons), by Application 2025 & 2033
- Figure 21: North America Perlite Industry Revenue Share (%), by Application 2025 & 2033
- Figure 22: North America Perlite Industry Volume Share (%), by Application 2025 & 2033
- Figure 23: North America Perlite Industry Revenue (billion), by Country 2025 & 2033
- Figure 24: North America Perlite Industry Volume (K Tons), by Country 2025 & 2033
- Figure 25: North America Perlite Industry Revenue Share (%), by Country 2025 & 2033
- Figure 26: North America Perlite Industry Volume Share (%), by Country 2025 & 2033
- Figure 27: Europe Perlite Industry Revenue (billion), by Product Type 2025 & 2033
- Figure 28: Europe Perlite Industry Volume (K Tons), by Product Type 2025 & 2033
- Figure 29: Europe Perlite Industry Revenue Share (%), by Product Type 2025 & 2033
- Figure 30: Europe Perlite Industry Volume Share (%), by Product Type 2025 & 2033
- Figure 31: Europe Perlite Industry Revenue (billion), by Application 2025 & 2033
- Figure 32: Europe Perlite Industry Volume (K Tons), by Application 2025 & 2033
- Figure 33: Europe Perlite Industry Revenue Share (%), by Application 2025 & 2033
- Figure 34: Europe Perlite Industry Volume Share (%), by Application 2025 & 2033
- Figure 35: Europe Perlite Industry Revenue (billion), by Country 2025 & 2033
- Figure 36: Europe Perlite Industry Volume (K Tons), by Country 2025 & 2033
- Figure 37: Europe Perlite Industry Revenue Share (%), by Country 2025 & 2033
- Figure 38: Europe Perlite Industry Volume Share (%), by Country 2025 & 2033
- Figure 39: South America Perlite Industry Revenue (billion), by Product Type 2025 & 2033
- Figure 40: South America Perlite Industry Volume (K Tons), by Product Type 2025 & 2033
- Figure 41: South America Perlite Industry Revenue Share (%), by Product Type 2025 & 2033
- Figure 42: South America Perlite Industry Volume Share (%), by Product Type 2025 & 2033
- Figure 43: South America Perlite Industry Revenue (billion), by Application 2025 & 2033
- Figure 44: South America Perlite Industry Volume (K Tons), by Application 2025 & 2033
- Figure 45: South America Perlite Industry Revenue Share (%), by Application 2025 & 2033
- Figure 46: South America Perlite Industry Volume Share (%), by Application 2025 & 2033
- Figure 47: South America Perlite Industry Revenue (billion), by Country 2025 & 2033
- Figure 48: South America Perlite Industry Volume (K Tons), by Country 2025 & 2033
- Figure 49: South America Perlite Industry Revenue Share (%), by Country 2025 & 2033
- Figure 50: South America Perlite Industry Volume Share (%), by Country 2025 & 2033
- Figure 51: Middle East and Africa Perlite Industry Revenue (billion), by Product Type 2025 & 2033
- Figure 52: Middle East and Africa Perlite Industry Volume (K Tons), by Product Type 2025 & 2033
- Figure 53: Middle East and Africa Perlite Industry Revenue Share (%), by Product Type 2025 & 2033
- Figure 54: Middle East and Africa Perlite Industry Volume Share (%), by Product Type 2025 & 2033
- Figure 55: Middle East and Africa Perlite Industry Revenue (billion), by Application 2025 & 2033
- Figure 56: Middle East and Africa Perlite Industry Volume (K Tons), by Application 2025 & 2033
- Figure 57: Middle East and Africa Perlite Industry Revenue Share (%), by Application 2025 & 2033
- Figure 58: Middle East and Africa Perlite Industry Volume Share (%), by Application 2025 & 2033
- Figure 59: Middle East and Africa Perlite Industry Revenue (billion), by Country 2025 & 2033
- Figure 60: Middle East and Africa Perlite Industry Volume (K Tons), by Country 2025 & 2033
- Figure 61: Middle East and Africa Perlite Industry Revenue Share (%), by Country 2025 & 2033
- Figure 62: Middle East and Africa Perlite Industry Volume Share (%), by Country 2025 & 2033
List of Tables
- Table 1: Global Perlite Industry Revenue billion Forecast, by Product Type 2020 & 2033
- Table 2: Global Perlite Industry Volume K Tons Forecast, by Product Type 2020 & 2033
- Table 3: Global Perlite Industry Revenue billion Forecast, by Application 2020 & 2033
- Table 4: Global Perlite Industry Volume K Tons Forecast, by Application 2020 & 2033
- Table 5: Global Perlite Industry Revenue billion Forecast, by Region 2020 & 2033
- Table 6: Global Perlite Industry Volume K Tons Forecast, by Region 2020 & 2033
- Table 7: Global Perlite Industry Revenue billion Forecast, by Product Type 2020 & 2033
- Table 8: Global Perlite Industry Volume K Tons Forecast, by Product Type 2020 & 2033
- Table 9: Global Perlite Industry Revenue billion Forecast, by Application 2020 & 2033
- Table 10: Global Perlite Industry Volume K Tons Forecast, by Application 2020 & 2033
- Table 11: Global Perlite Industry Revenue billion Forecast, by Country 2020 & 2033
- Table 12: Global Perlite Industry Volume K Tons Forecast, by Country 2020 & 2033
- Table 13: China Perlite Industry Revenue (billion) Forecast, by Application 2020 & 2033
- Table 14: China Perlite Industry Volume (K Tons) Forecast, by Application 2020 & 2033
- Table 15: India Perlite Industry Revenue (billion) Forecast, by Application 2020 & 2033
- Table 16: India Perlite Industry Volume (K Tons) Forecast, by Application 2020 & 2033
- Table 17: Japan Perlite Industry Revenue (billion) Forecast, by Application 2020 & 2033
- Table 18: Japan Perlite Industry Volume (K Tons) Forecast, by Application 2020 & 2033
- Table 19: South Korea Perlite Industry Revenue (billion) Forecast, by Application 2020 & 2033
- Table 20: South Korea Perlite Industry Volume (K Tons) Forecast, by Application 2020 & 2033
- Table 21: Rest of Asia Pacific Perlite Industry Revenue (billion) Forecast, by Application 2020 & 2033
- Table 22: Rest of Asia Pacific Perlite Industry Volume (K Tons) Forecast, by Application 2020 & 2033
- Table 23: Global Perlite Industry Revenue billion Forecast, by Product Type 2020 & 2033
- Table 24: Global Perlite Industry Volume K Tons Forecast, by Product Type 2020 & 2033
- Table 25: Global Perlite Industry Revenue billion Forecast, by Application 2020 & 2033
- Table 26: Global Perlite Industry Volume K Tons Forecast, by Application 2020 & 2033
- Table 27: Global Perlite Industry Revenue billion Forecast, by Country 2020 & 2033
- Table 28: Global Perlite Industry Volume K Tons Forecast, by Country 2020 & 2033
- Table 29: United States Perlite Industry Revenue (billion) Forecast, by Application 2020 & 2033
- Table 30: United States Perlite Industry Volume (K Tons) Forecast, by Application 2020 & 2033
- Table 31: Canada Perlite Industry Revenue (billion) Forecast, by Application 2020 & 2033
- Table 32: Canada Perlite Industry Volume (K Tons) Forecast, by Application 2020 & 2033
- Table 33: Mexico Perlite Industry Revenue (billion) Forecast, by Application 2020 & 2033
- Table 34: Mexico Perlite Industry Volume (K Tons) Forecast, by Application 2020 & 2033
- Table 35: Rest of North America Perlite Industry Revenue (billion) Forecast, by Application 2020 & 2033
- Table 36: Rest of North America Perlite Industry Volume (K Tons) Forecast, by Application 2020 & 2033
- Table 37: Global Perlite Industry Revenue billion Forecast, by Product Type 2020 & 2033
- Table 38: Global Perlite Industry Volume K Tons Forecast, by Product Type 2020 & 2033
- Table 39: Global Perlite Industry Revenue billion Forecast, by Application 2020 & 2033
- Table 40: Global Perlite Industry Volume K Tons Forecast, by Application 2020 & 2033
- Table 41: Global Perlite Industry Revenue billion Forecast, by Country 2020 & 2033
- Table 42: Global Perlite Industry Volume K Tons Forecast, by Country 2020 & 2033
- Table 43: Germany Perlite Industry Revenue (billion) Forecast, by Application 2020 & 2033
- Table 44: Germany Perlite Industry Volume (K Tons) Forecast, by Application 2020 & 2033
- Table 45: United Kingdom Perlite Industry Revenue (billion) Forecast, by Application 2020 & 2033
- Table 46: United Kingdom Perlite Industry Volume (K Tons) Forecast, by Application 2020 & 2033
- Table 47: France Perlite Industry Revenue (billion) Forecast, by Application 2020 & 2033
- Table 48: France Perlite Industry Volume (K Tons) Forecast, by Application 2020 & 2033
- Table 49: Italy Perlite Industry Revenue (billion) Forecast, by Application 2020 & 2033
- Table 50: Italy Perlite Industry Volume (K Tons) Forecast, by Application 2020 & 2033
- Table 51: Russia Perlite Industry Revenue (billion) Forecast, by Application 2020 & 2033
- Table 52: Russia Perlite Industry Volume (K Tons) Forecast, by Application 2020 & 2033
- Table 53: Rest of Europe Perlite Industry Revenue (billion) Forecast, by Application 2020 & 2033
- Table 54: Rest of Europe Perlite Industry Volume (K Tons) Forecast, by Application 2020 & 2033
- Table 55: Global Perlite Industry Revenue billion Forecast, by Product Type 2020 & 2033
- Table 56: Global Perlite Industry Volume K Tons Forecast, by Product Type 2020 & 2033
- Table 57: Global Perlite Industry Revenue billion Forecast, by Application 2020 & 2033
- Table 58: Global Perlite Industry Volume K Tons Forecast, by Application 2020 & 2033
- Table 59: Global Perlite Industry Revenue billion Forecast, by Country 2020 & 2033
- Table 60: Global Perlite Industry Volume K Tons Forecast, by Country 2020 & 2033
- Table 61: Brazil Perlite Industry Revenue (billion) Forecast, by Application 2020 & 2033
- Table 62: Brazil Perlite Industry Volume (K Tons) Forecast, by Application 2020 & 2033
- Table 63: Argentina Perlite Industry Revenue (billion) Forecast, by Application 2020 & 2033
- Table 64: Argentina Perlite Industry Volume (K Tons) Forecast, by Application 2020 & 2033
- Table 65: Rest of South America Perlite Industry Revenue (billion) Forecast, by Application 2020 & 2033
- Table 66: Rest of South America Perlite Industry Volume (K Tons) Forecast, by Application 2020 & 2033
- Table 67: Global Perlite Industry Revenue billion Forecast, by Product Type 2020 & 2033
- Table 68: Global Perlite Industry Volume K Tons Forecast, by Product Type 2020 & 2033
- Table 69: Global Perlite Industry Revenue billion Forecast, by Application 2020 & 2033
- Table 70: Global Perlite Industry Volume K Tons Forecast, by Application 2020 & 2033
- Table 71: Global Perlite Industry Revenue billion Forecast, by Country 2020 & 2033
- Table 72: Global Perlite Industry Volume K Tons Forecast, by Country 2020 & 2033
- Table 73: Saudi Arabia Perlite Industry Revenue (billion) Forecast, by Application 2020 & 2033
- Table 74: Saudi Arabia Perlite Industry Volume (K Tons) Forecast, by Application 2020 & 2033
- Table 75: South Africa Perlite Industry Revenue (billion) Forecast, by Application 2020 & 2033
- Table 76: South Africa Perlite Industry Volume (K Tons) Forecast, by Application 2020 & 2033
- Table 77: UAE Perlite Industry Revenue (billion) Forecast, by Application 2020 & 2033
- Table 78: UAE Perlite Industry Volume (K Tons) Forecast, by Application 2020 & 2033
- Table 79: Rest of Middle East and Africa Perlite Industry Revenue (billion) Forecast, by Application 2020 & 2033
- Table 80: Rest of Middle East and Africa Perlite Industry Volume (K Tons) Forecast, by Application 2020 & 2033
Frequently Asked Questions
1. What is the projected Compound Annual Growth Rate (CAGR) of the Perlite Industry?
The projected CAGR is approximately 5.78%.
2. Which companies are prominent players in the Perlite Industry?
Key companies in the market include Amol Minechem Ltd, Cornerstone Industrial Minerals Corporation USA, Ausperl Pty Ltd, Supreme Perlite Company, Imerys, Termolita, Profiltra BV, Midwest Perlite, Carolina Perlite Co Inc, Azer Perlite Corporation, Blue Pacific Minerals, Omya AG, Mianeh Prlite Expanding Co Ltd, Saudi Perlite Industries, Bergama Mining Perlite.
3. What are the main segments of the Perlite Industry?
The market segments include Product Type, Application.
4. Can you provide details about the market size?
The market size is estimated to be USD 2.45 billion as of 2022.
5. What are some drivers contributing to market growth?
Surge in Demand in the Agricultural and Construction Industries; Increasing Usage in the Metallurgical Industry; Other Drivers.
6. What are the notable trends driving market growth?
Increasing Demand from Construction Sector.
7. Are there any restraints impacting market growth?
Availability of Substitutes; Health Problems Due to Prolonged Exposure; Other Restraints.
8. Can you provide examples of recent developments in the market?
February 2023: Titan Cement acquired a share in Aegean Perlites. The company operates perlite and pozzolan quarries on the island of Yali. It also has access to port facilities. Titan Group says it is investing in direct access to pozzolan reserves to increase its volume of pozzolan-based cementitious products with a lower clinker factor. The deal is connected to Titan's target to reduce its CO2 emissions by 35% by 2030, compared to 1990 levels, and increase the share of green products in its portfolio to over 50%.
9. What pricing options are available for accessing the report?
Pricing options include single-user, multi-user, and enterprise licenses priced at USD 4750, USD 5250, and USD 8750 respectively.
10. Is the market size provided in terms of value or volume?
The market size is provided in terms of value, measured in billion and volume, measured in K Tons.
11. Are there any specific market keywords associated with the report?
Yes, the market keyword associated with the report is "Perlite Industry," which aids in identifying and referencing the specific market segment covered.
12. How do I determine which pricing option suits my needs best?
The pricing options vary based on user requirements and access needs. Individual users may opt for single-user licenses, while businesses requiring broader access may choose multi-user or enterprise licenses for cost-effective access to the report.
13. Are there any additional resources or data provided in the Perlite Industry report?
While the report offers comprehensive insights, it's advisable to review the specific contents or supplementary materials provided to ascertain if additional resources or data are available.
14. How can I stay updated on further developments or reports in the Perlite Industry?
To stay informed about further developments, trends, and reports in the Perlite Industry, consider subscribing to industry newsletters, following relevant companies and organizations, or regularly checking reputable industry news sources and publications.
Methodology
Step 1 - Identification of Relevant Samples Size from Population Database


Step 2 - Approaches for Defining Global Market Size (Value, Volume* & Price*)

Note*: In applicable scenarios
Step 3 - Data Sources
Primary Research
- Web Analytics
- Survey Reports
- Research Institute
- Latest Research Reports
- Opinion Leaders
Secondary Research
- Annual Reports
- White Paper
- Latest Press Release
- Industry Association
- Paid Database
- Investor Presentations

Step 4 - Data Triangulation
Involves using different sources of information in order to increase the validity of a study
These sources are likely to be stakeholders in a program - participants, other researchers, program staff, other community members, and so on.
Then we put all data in single framework & apply various statistical tools to find out the dynamic on the market.
During the analysis stage, feedback from the stakeholder groups would be compared to determine areas of agreement as well as areas of divergence