

Key Insights
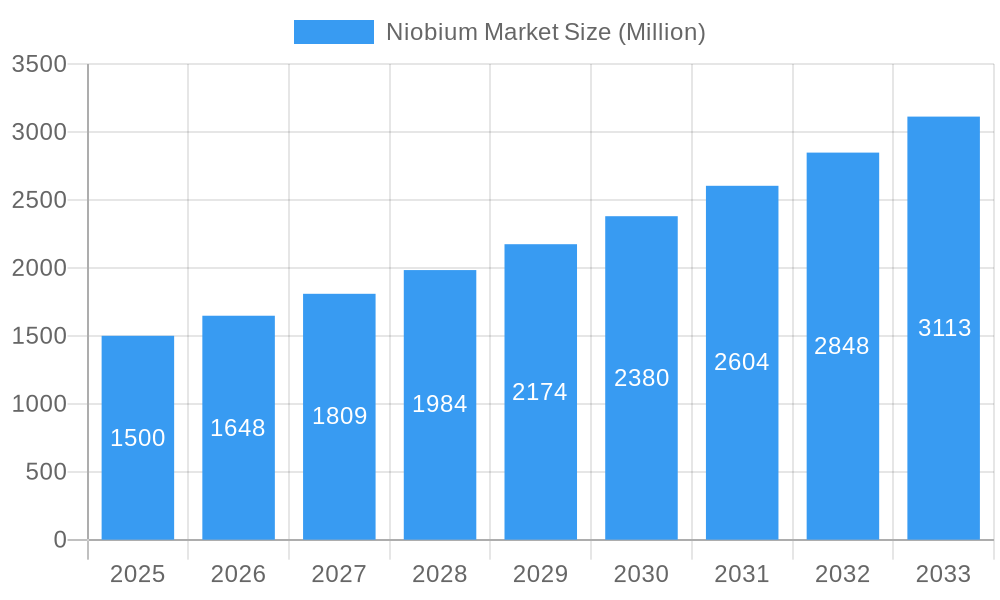
The global niobium market, valued at approximately $1409 million in 2025, is projected to achieve a compound annual growth rate (CAGR) of 3.9% from 2025 to 2033. Key growth drivers include escalating demand for high-strength, lightweight materials in the automotive and aerospace sectors, particularly niobium-containing alloys for superalloys and high-performance steel. The expanding renewable energy sector, driven by the adoption of superconducting magnets in wind turbines and energy storage, also fuels market expansion. Niobium-enhanced steel in construction for infrastructure projects presents further opportunities. Potential restraints, such as price volatility due to raw material availability and geopolitical factors, are offset by a positive market outlook, especially in the Asia-Pacific region, propelled by robust industrial growth and infrastructure development in China and India. Market segmentation indicates significant growth potential across applications like superalloys, superconducting magnets, and batteries, with Ferroniobium and Niobium Oxide holding substantial shares within the type segment.
Niobium Market Market Size (In Billion)
Niobium's diverse applications, from high-strength steel in construction and automotive to specialized alloys in aerospace and superconducting magnets in renewable energy, ensure market resilience. Technological advancements, particularly in battery technology, will likely shape future growth. The Asia-Pacific region leads market concentration due to its industrial strength and infrastructure investments, with North America and Europe contributing significantly through established industries and R&D. Intense competition among key players, including CBMM and NioCorp Development Ltd, is expected to foster innovation and market expansion. The ongoing emphasis on sustainability and the demand for high-performance materials will solidify niobium's critical role across various sectors throughout the forecast period.
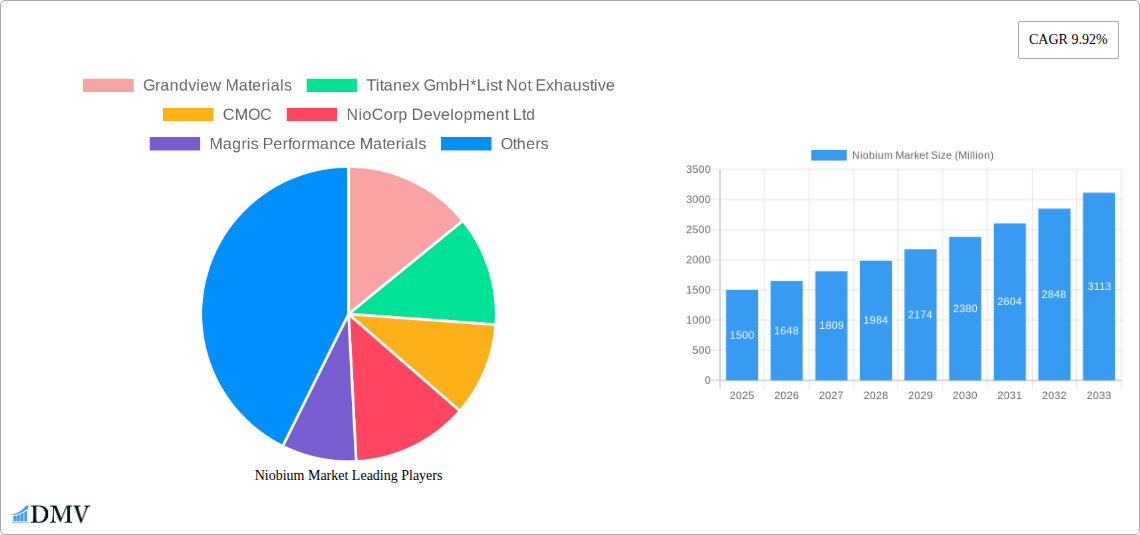
Niobium Market Company Market Share
Niobium Market: A Comprehensive Report (2019-2033)
This insightful report provides a detailed analysis of the Niobium market, encompassing its current state, future trajectory, and key players. Covering the period from 2019 to 2033, with a focus on 2025, this study offers invaluable insights for stakeholders seeking to understand and capitalize on opportunities within this dynamic market. From market segmentation and competitive landscape to technological advancements and growth drivers, this report equips you with the knowledge necessary to make informed strategic decisions. The total market value is projected to reach xx Million by 2033.
Niobium Market Composition & Trends
This section delves into the intricate structure of the Niobium market, examining key aspects influencing its evolution. We analyze market concentration, revealing the market share distribution amongst leading players, including CBMM, Grandview Materials, Titanex GmbH, CMOC, NioCorp Development Ltd, Magris Performance Materials, Changsha South Tantalum Niobium Co Ltd, Admat Inc, and Australian Strategic Materials Ltd. The report quantifies the impact of mergers and acquisitions (M&A) activities, providing insights into deal values and their influence on market dynamics. We also explore innovation catalysts, regulatory landscapes shaping the industry, and the role of substitute products in shaping market competition. End-user profiles are analyzed to pinpoint key demand drivers across diverse sectors.
- Market Concentration: The market exhibits a [High/Medium/Low - Choose one based on your data] level of concentration, with the top 5 players holding approximately xx% of the market share in 2024.
- M&A Activity: Significant M&A activity was observed during the historical period, with deal values totaling approximately xx Million. The acquisition of Telex Metals by Kymera International in January 2022 exemplifies the strategic consolidation within the sector.
- Innovation Catalysts: Advancements in materials science and the rising demand for high-performance alloys are driving innovation within the niobium market.
- Regulatory Landscape: Government regulations concerning mining and environmental protection significantly impact niobium production and trade. Variations in regulations across different regions impact market dynamics.
- Substitute Products: While few direct substitutes exist, alternative materials like other high-strength alloys pose indirect competition.
Niobium Market Industry Evolution
This section meticulously traces the evolution of the Niobium market, illuminating its growth trajectory, technological shifts, and evolving consumer preferences. Using a blend of qualitative and quantitative analysis, we reveal the market’s growth rate from 2019 to 2024 and project its expansion from 2025 to 2033. The report incorporates data points, such as adoption metrics of new niobium applications in various industries, to paint a comprehensive picture of market development. This includes a detailed assessment of technological breakthroughs, market penetration rates of specific niobium products and the changing demands of key end-user industries. Analysis incorporates factors driving market expansion such as electrification in the automotive sector and the growing demand for specialized alloys in high-tech applications.
Leading Regions, Countries, or Segments in Niobium Market
This section identifies the leading regions, countries, and segments within the Niobium market based on occurrence (Carbonatites and Associates, Columbite-Tantalite), type (Ferroniobium, Niobium Oxide, Niobium Metal, Vacuum-Grade Niobium Alloys), application (Steel, Super Alloys, Superconducting Magnets and Capacitors, Batteries, Other Applications), and end-user industry (Construction, Automotive and Shipbuilding, Aerospace and Defense, Oil and Gas, Other End-user Industries).
- Key Drivers:
- Significant investments in mining and processing facilities.
- Favorable government policies and incentives promoting the use of niobium in strategic sectors.
- Growing demand for high-performance materials in various industries.
- Dominance Factors: [Insert detailed paragraph analyzing factors such as geographic distribution of resources, production capabilities, and market access for the leading segment/region/country]. For example, Brazil's dominance in niobium production is rooted in its significant reserves and established processing infrastructure.
Niobium Market Product Innovations
Recent years have witnessed significant advancements in niobium-based products, leading to enhanced performance and expanded applications. Innovations include the development of novel alloys with improved strength-to-weight ratios, tailored compositions for specific applications (such as high-temperature superconductors), and advanced processing techniques that reduce costs and improve quality. These innovations expand niobium's use in high-demand sectors such as aerospace, automotive, and electronics, opening new avenues for market growth. The unique selling propositions of these innovations include increased durability, enhanced efficiency, and superior performance compared to existing materials.
Propelling Factors for Niobium Market Growth
Several key factors are driving the expansion of the Niobium market. Technological advancements, particularly in materials science and the development of high-performance alloys, are fueling demand across various sectors. Economic growth in developing nations, coupled with the rising adoption of niobium in infrastructure projects and the automotive industry, is another major driver. Furthermore, supportive government policies promoting the use of sustainable and high-performance materials are significantly contributing to market growth. The increasing demand for electric vehicles (EVs), where niobium enhances battery performance, is a crucial growth driver.
Obstacles in the Niobium Market
Despite its growth potential, the Niobium market faces several challenges. Regulatory hurdles related to mining and environmental concerns can impede production and market expansion. Supply chain disruptions, particularly in raw material sourcing, can impact the availability and price of niobium products. Intense competition among existing players and the entry of new competitors also present challenges to market stability and profitability. These factors can lead to price fluctuations and limit the growth potential of individual companies.
Future Opportunities in Niobium Market
The Niobium market presents numerous promising opportunities. The growing adoption of niobium in emerging technologies, such as advanced batteries and high-temperature superconductors, opens new avenues for market expansion. The exploration of new applications in various sectors, combined with advancements in processing and manufacturing techniques, will further enhance niobium’s market penetration. Increased demand from the renewable energy sector and the development of innovative alloys with enhanced properties can significantly bolster market growth in the coming years.
Major Players in the Niobium Market Ecosystem
- Grandview Materials
- Titanex GmbH
- CMOC
- NioCorp Development Ltd
- Magris Performance Materials
- Changsha South Tantalum Niobium Co Ltd
- Admat Inc
- Australian Strategic Materials Ltd
- CBMM
Key Developments in Niobium Market Industry
- December 2022: CBMM announced an USD 80 Million investment to expand its niobium oxide capacity from 500 tons to 3,000 tons by 2024, aiming for 40,000 tons by 2030. This signifies a major expansion in production capacity, impacting market supply and potentially reducing prices.
- March 2022: CBMM's partnership with Horwin Brasil, focusing on niobium-enhanced lithium-ion batteries for electric motorcycles, highlights the growing application of niobium in the burgeoning electric vehicle sector. This strategic move positions CBMM for significant growth in the EV market.
- January 2022: Kymera International's acquisition of Telex Metals expanded its reach into tantalum and niobium materials, creating a larger and more integrated player in the market. This consolidation impacts market competition and potentially enhances the supply chain.
Strategic Niobium Market Forecast
The Niobium market is poised for significant growth driven by technological advancements, increasing demand from various sectors (particularly automotive and renewable energy), and supportive government policies. The expansion of production capacity by key players, coupled with the development of new applications, will further propel market expansion. The forecast period (2025-2033) anticipates robust growth, exceeding the historical growth rate, indicating substantial opportunities for stakeholders. This presents significant potential for investment and innovation within the industry.
Niobium Market Segmentation
-
1. Occurrence
- 1.1. Carbonatites and Associates
- 1.2. Columbite-Tantalite
-
2. Type
- 2.1. Ferroniobium
- 2.2. Niobium Oxide
- 2.3. Niobium Metal
- 2.4. Vacuum-Grade Niobium Alloys
-
3. Application
- 3.1. Steel
- 3.2. Super Alloys
- 3.3. Superconducting Magnets and Capacitors
- 3.4. Batteries
- 3.5. Other Applications
-
4. End-user Industry
- 4.1. Construction
- 4.2. Automotive and Shipbuilding
- 4.3. Aerospace and Defense
- 4.4. Oil and Gas
- 4.5. Other End-user Industries
Niobium Market Segmentation By Geography
-
1. Asia Pacific
- 1.1. China
- 1.2. India
- 1.3. Japan
- 1.4. South Korea
- 1.5. Rest of Asia Pacific
-
2. North America
- 2.1. United States
- 2.2. Canada
- 2.3. Mexico
-
3. Europe
- 3.1. Germany
- 3.2. United Kingdom
- 3.3. Russia
- 3.4. Italy
- 3.5. Rest of Europe
-
4. South America
- 4.1. Brazil
- 4.2. Argentina
- 4.3. Rest of South America
-
5. Middle East and Africa
- 5.1. Saudi Arabia
- 5.2. South Africa
- 5.3. Rest of Middle East and Africa
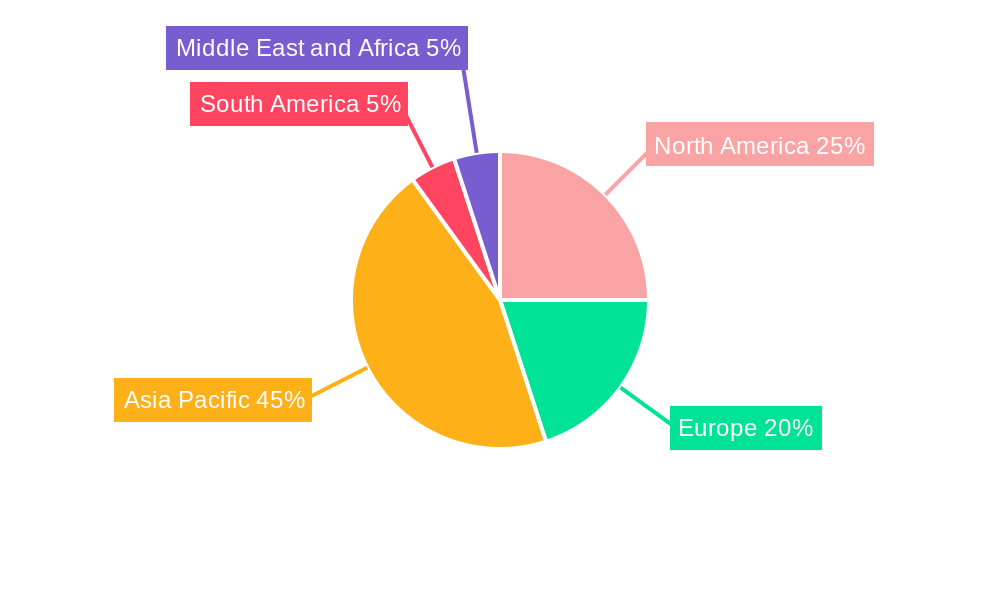
Niobium Market Regional Market Share
Geographic Coverage of Niobium Market
Niobium Market REPORT HIGHLIGHTS
| Aspects | Details |
|---|---|
| Study Period | 2020-2034 |
| Base Year | 2025 |
| Estimated Year | 2026 |
| Forecast Period | 2026-2034 |
| Historical Period | 2020-2025 |
| Growth Rate | CAGR of 3.9% from 2020-2034 |
| Segmentation |
|
Table of Contents
- 1. Introduction
- 1.1. Research Scope
- 1.2. Market Segmentation
- 1.3. Research Objective
- 1.4. Definitions and Assumptions
- 2. Executive Summary
- 2.1. Market Snapshot
- 3. Market Dynamics
- 3.1. Market Drivers
- 3.2. Market Restrains
- 3.3. Market Trends
- 3.4. Market Opportunities
- 4. Market Factor Analysis
- 4.1. Porters Five Forces
- 4.1.1. Bargaining Power of Suppliers
- 4.1.2. Bargaining Power of Buyers
- 4.1.3. Threat of New Entrants
- 4.1.4. Threat of Substitutes
- 4.1.5. Competitive Rivalry
- 4.2. PESTEL analysis
- 4.3. BCG Analysis
- 4.3.1. Stars (High Growth, High Market Share)
- 4.3.2. Cash Cows (Low Growth, High Market Share)
- 4.3.3. Question Mark (High Growth, Low Market Share)
- 4.3.4. Dogs (Low Growth, Low Market Share)
- 4.4. Ansoff Matrix Analysis
- 4.5. Supply Chain Analysis
- 4.6. Regulatory Landscape
- 4.7. Current Market Potential and Opportunity Assessment (TAM–SAM–SOM Framework)
- 4.8. DMV Analyst Note
- 4.1. Porters Five Forces
- 5. Market Analysis, Insights and Forecast 2021-2033
- 5.1. Market Analysis, Insights and Forecast - by Occurrence
- 5.1.1. Carbonatites and Associates
- 5.1.2. Columbite-Tantalite
- 5.2. Market Analysis, Insights and Forecast - by Type
- 5.2.1. Ferroniobium
- 5.2.2. Niobium Oxide
- 5.2.3. Niobium Metal
- 5.2.4. Vacuum-Grade Niobium Alloys
- 5.3. Market Analysis, Insights and Forecast - by Application
- 5.3.1. Steel
- 5.3.2. Super Alloys
- 5.3.3. Superconducting Magnets and Capacitors
- 5.3.4. Batteries
- 5.3.5. Other Applications
- 5.4. Market Analysis, Insights and Forecast - by End-user Industry
- 5.4.1. Construction
- 5.4.2. Automotive and Shipbuilding
- 5.4.3. Aerospace and Defense
- 5.4.4. Oil and Gas
- 5.4.5. Other End-user Industries
- 5.5. Market Analysis, Insights and Forecast - by Region
- 5.5.1. Asia Pacific
- 5.5.2. North America
- 5.5.3. Europe
- 5.5.4. South America
- 5.5.5. Middle East and Africa
- 5.1. Market Analysis, Insights and Forecast - by Occurrence
- 6. Global Niobium Market Analysis, Insights and Forecast, 2021-2033
- 6.1. Market Analysis, Insights and Forecast - by Occurrence
- 6.1.1. Carbonatites and Associates
- 6.1.2. Columbite-Tantalite
- 6.2. Market Analysis, Insights and Forecast - by Type
- 6.2.1. Ferroniobium
- 6.2.2. Niobium Oxide
- 6.2.3. Niobium Metal
- 6.2.4. Vacuum-Grade Niobium Alloys
- 6.3. Market Analysis, Insights and Forecast - by Application
- 6.3.1. Steel
- 6.3.2. Super Alloys
- 6.3.3. Superconducting Magnets and Capacitors
- 6.3.4. Batteries
- 6.3.5. Other Applications
- 6.4. Market Analysis, Insights and Forecast - by End-user Industry
- 6.4.1. Construction
- 6.4.2. Automotive and Shipbuilding
- 6.4.3. Aerospace and Defense
- 6.4.4. Oil and Gas
- 6.4.5. Other End-user Industries
- 6.1. Market Analysis, Insights and Forecast - by Occurrence
- 7. Asia Pacific Niobium Market Analysis, Insights and Forecast, 2020-2032
- 7.1. Market Analysis, Insights and Forecast - by Occurrence
- 7.1.1. Carbonatites and Associates
- 7.1.2. Columbite-Tantalite
- 7.2. Market Analysis, Insights and Forecast - by Type
- 7.2.1. Ferroniobium
- 7.2.2. Niobium Oxide
- 7.2.3. Niobium Metal
- 7.2.4. Vacuum-Grade Niobium Alloys
- 7.3. Market Analysis, Insights and Forecast - by Application
- 7.3.1. Steel
- 7.3.2. Super Alloys
- 7.3.3. Superconducting Magnets and Capacitors
- 7.3.4. Batteries
- 7.3.5. Other Applications
- 7.4. Market Analysis, Insights and Forecast - by End-user Industry
- 7.4.1. Construction
- 7.4.2. Automotive and Shipbuilding
- 7.4.3. Aerospace and Defense
- 7.4.4. Oil and Gas
- 7.4.5. Other End-user Industries
- 7.1. Market Analysis, Insights and Forecast - by Occurrence
- 8. North America Niobium Market Analysis, Insights and Forecast, 2020-2032
- 8.1. Market Analysis, Insights and Forecast - by Occurrence
- 8.1.1. Carbonatites and Associates
- 8.1.2. Columbite-Tantalite
- 8.2. Market Analysis, Insights and Forecast - by Type
- 8.2.1. Ferroniobium
- 8.2.2. Niobium Oxide
- 8.2.3. Niobium Metal
- 8.2.4. Vacuum-Grade Niobium Alloys
- 8.3. Market Analysis, Insights and Forecast - by Application
- 8.3.1. Steel
- 8.3.2. Super Alloys
- 8.3.3. Superconducting Magnets and Capacitors
- 8.3.4. Batteries
- 8.3.5. Other Applications
- 8.4. Market Analysis, Insights and Forecast - by End-user Industry
- 8.4.1. Construction
- 8.4.2. Automotive and Shipbuilding
- 8.4.3. Aerospace and Defense
- 8.4.4. Oil and Gas
- 8.4.5. Other End-user Industries
- 8.1. Market Analysis, Insights and Forecast - by Occurrence
- 9. Europe Niobium Market Analysis, Insights and Forecast, 2020-2032
- 9.1. Market Analysis, Insights and Forecast - by Occurrence
- 9.1.1. Carbonatites and Associates
- 9.1.2. Columbite-Tantalite
- 9.2. Market Analysis, Insights and Forecast - by Type
- 9.2.1. Ferroniobium
- 9.2.2. Niobium Oxide
- 9.2.3. Niobium Metal
- 9.2.4. Vacuum-Grade Niobium Alloys
- 9.3. Market Analysis, Insights and Forecast - by Application
- 9.3.1. Steel
- 9.3.2. Super Alloys
- 9.3.3. Superconducting Magnets and Capacitors
- 9.3.4. Batteries
- 9.3.5. Other Applications
- 9.4. Market Analysis, Insights and Forecast - by End-user Industry
- 9.4.1. Construction
- 9.4.2. Automotive and Shipbuilding
- 9.4.3. Aerospace and Defense
- 9.4.4. Oil and Gas
- 9.4.5. Other End-user Industries
- 9.1. Market Analysis, Insights and Forecast - by Occurrence
- 10. South America Niobium Market Analysis, Insights and Forecast, 2020-2032
- 10.1. Market Analysis, Insights and Forecast - by Occurrence
- 10.1.1. Carbonatites and Associates
- 10.1.2. Columbite-Tantalite
- 10.2. Market Analysis, Insights and Forecast - by Type
- 10.2.1. Ferroniobium
- 10.2.2. Niobium Oxide
- 10.2.3. Niobium Metal
- 10.2.4. Vacuum-Grade Niobium Alloys
- 10.3. Market Analysis, Insights and Forecast - by Application
- 10.3.1. Steel
- 10.3.2. Super Alloys
- 10.3.3. Superconducting Magnets and Capacitors
- 10.3.4. Batteries
- 10.3.5. Other Applications
- 10.4. Market Analysis, Insights and Forecast - by End-user Industry
- 10.4.1. Construction
- 10.4.2. Automotive and Shipbuilding
- 10.4.3. Aerospace and Defense
- 10.4.4. Oil and Gas
- 10.4.5. Other End-user Industries
- 10.1. Market Analysis, Insights and Forecast - by Occurrence
- 11. Middle East and Africa Niobium Market Analysis, Insights and Forecast, 2020-2032
- 11.1. Market Analysis, Insights and Forecast - by Occurrence
- 11.1.1. Carbonatites and Associates
- 11.1.2. Columbite-Tantalite
- 11.2. Market Analysis, Insights and Forecast - by Type
- 11.2.1. Ferroniobium
- 11.2.2. Niobium Oxide
- 11.2.3. Niobium Metal
- 11.2.4. Vacuum-Grade Niobium Alloys
- 11.3. Market Analysis, Insights and Forecast - by Application
- 11.3.1. Steel
- 11.3.2. Super Alloys
- 11.3.3. Superconducting Magnets and Capacitors
- 11.3.4. Batteries
- 11.3.5. Other Applications
- 11.4. Market Analysis, Insights and Forecast - by End-user Industry
- 11.4.1. Construction
- 11.4.2. Automotive and Shipbuilding
- 11.4.3. Aerospace and Defense
- 11.4.4. Oil and Gas
- 11.4.5. Other End-user Industries
- 11.1. Market Analysis, Insights and Forecast - by Occurrence
- 12. Competitive Analysis
- 12.1. Company Profiles
- 12.1.1 Grandview Materials
- 12.1.1.1. Company Overview
- 12.1.1.2. Products
- 12.1.1.3. Company Financials
- 12.1.1.4. SWOT Analysis
- 12.1.2 Titanex GmbH*List Not Exhaustive
- 12.1.2.1. Company Overview
- 12.1.2.2. Products
- 12.1.2.3. Company Financials
- 12.1.2.4. SWOT Analysis
- 12.1.3 CMOC
- 12.1.3.1. Company Overview
- 12.1.3.2. Products
- 12.1.3.3. Company Financials
- 12.1.3.4. SWOT Analysis
- 12.1.4 NioCorp Development Ltd
- 12.1.4.1. Company Overview
- 12.1.4.2. Products
- 12.1.4.3. Company Financials
- 12.1.4.4. SWOT Analysis
- 12.1.5 Magris Performance Materials
- 12.1.5.1. Company Overview
- 12.1.5.2. Products
- 12.1.5.3. Company Financials
- 12.1.5.4. SWOT Analysis
- 12.1.6 Changsha South Tantalum Niobium Co Ltd
- 12.1.6.1. Company Overview
- 12.1.6.2. Products
- 12.1.6.3. Company Financials
- 12.1.6.4. SWOT Analysis
- 12.1.7 Admat Inc
- 12.1.7.1. Company Overview
- 12.1.7.2. Products
- 12.1.7.3. Company Financials
- 12.1.7.4. SWOT Analysis
- 12.1.8 Australian Strategic Materials Ltd
- 12.1.8.1. Company Overview
- 12.1.8.2. Products
- 12.1.8.3. Company Financials
- 12.1.8.4. SWOT Analysis
- 12.1.9 CBMM
- 12.1.9.1. Company Overview
- 12.1.9.2. Products
- 12.1.9.3. Company Financials
- 12.1.9.4. SWOT Analysis
- 12.1.1 Grandview Materials
- 12.2. Market Entropy
- 12.2.1 Company's Key Areas Served
- 12.2.2 Recent Developments
- 12.3. Company Market Share Analysis 2025
- 12.3.1 Top 5 Companies Market Share Analysis
- 12.3.2 Top 3 Companies Market Share Analysis
- 12.4. List of Potential Customers
- 13. Research Methodology
List of Figures
- Figure 1: Global Niobium Market Revenue Breakdown (million, %) by Region 2025 & 2033
- Figure 2: Global Niobium Market Volume Breakdown (kilotons, %) by Region 2025 & 2033
- Figure 3: Asia Pacific Niobium Market Revenue (million), by Occurrence 2025 & 2033
- Figure 4: Asia Pacific Niobium Market Volume (kilotons), by Occurrence 2025 & 2033
- Figure 5: Asia Pacific Niobium Market Revenue Share (%), by Occurrence 2025 & 2033
- Figure 6: Asia Pacific Niobium Market Volume Share (%), by Occurrence 2025 & 2033
- Figure 7: Asia Pacific Niobium Market Revenue (million), by Type 2025 & 2033
- Figure 8: Asia Pacific Niobium Market Volume (kilotons), by Type 2025 & 2033
- Figure 9: Asia Pacific Niobium Market Revenue Share (%), by Type 2025 & 2033
- Figure 10: Asia Pacific Niobium Market Volume Share (%), by Type 2025 & 2033
- Figure 11: Asia Pacific Niobium Market Revenue (million), by Application 2025 & 2033
- Figure 12: Asia Pacific Niobium Market Volume (kilotons), by Application 2025 & 2033
- Figure 13: Asia Pacific Niobium Market Revenue Share (%), by Application 2025 & 2033
- Figure 14: Asia Pacific Niobium Market Volume Share (%), by Application 2025 & 2033
- Figure 15: Asia Pacific Niobium Market Revenue (million), by End-user Industry 2025 & 2033
- Figure 16: Asia Pacific Niobium Market Volume (kilotons), by End-user Industry 2025 & 2033
- Figure 17: Asia Pacific Niobium Market Revenue Share (%), by End-user Industry 2025 & 2033
- Figure 18: Asia Pacific Niobium Market Volume Share (%), by End-user Industry 2025 & 2033
- Figure 19: Asia Pacific Niobium Market Revenue (million), by Country 2025 & 2033
- Figure 20: Asia Pacific Niobium Market Volume (kilotons), by Country 2025 & 2033
- Figure 21: Asia Pacific Niobium Market Revenue Share (%), by Country 2025 & 2033
- Figure 22: Asia Pacific Niobium Market Volume Share (%), by Country 2025 & 2033
- Figure 23: North America Niobium Market Revenue (million), by Occurrence 2025 & 2033
- Figure 24: North America Niobium Market Volume (kilotons), by Occurrence 2025 & 2033
- Figure 25: North America Niobium Market Revenue Share (%), by Occurrence 2025 & 2033
- Figure 26: North America Niobium Market Volume Share (%), by Occurrence 2025 & 2033
- Figure 27: North America Niobium Market Revenue (million), by Type 2025 & 2033
- Figure 28: North America Niobium Market Volume (kilotons), by Type 2025 & 2033
- Figure 29: North America Niobium Market Revenue Share (%), by Type 2025 & 2033
- Figure 30: North America Niobium Market Volume Share (%), by Type 2025 & 2033
- Figure 31: North America Niobium Market Revenue (million), by Application 2025 & 2033
- Figure 32: North America Niobium Market Volume (kilotons), by Application 2025 & 2033
- Figure 33: North America Niobium Market Revenue Share (%), by Application 2025 & 2033
- Figure 34: North America Niobium Market Volume Share (%), by Application 2025 & 2033
- Figure 35: North America Niobium Market Revenue (million), by End-user Industry 2025 & 2033
- Figure 36: North America Niobium Market Volume (kilotons), by End-user Industry 2025 & 2033
- Figure 37: North America Niobium Market Revenue Share (%), by End-user Industry 2025 & 2033
- Figure 38: North America Niobium Market Volume Share (%), by End-user Industry 2025 & 2033
- Figure 39: North America Niobium Market Revenue (million), by Country 2025 & 2033
- Figure 40: North America Niobium Market Volume (kilotons), by Country 2025 & 2033
- Figure 41: North America Niobium Market Revenue Share (%), by Country 2025 & 2033
- Figure 42: North America Niobium Market Volume Share (%), by Country 2025 & 2033
- Figure 43: Europe Niobium Market Revenue (million), by Occurrence 2025 & 2033
- Figure 44: Europe Niobium Market Volume (kilotons), by Occurrence 2025 & 2033
- Figure 45: Europe Niobium Market Revenue Share (%), by Occurrence 2025 & 2033
- Figure 46: Europe Niobium Market Volume Share (%), by Occurrence 2025 & 2033
- Figure 47: Europe Niobium Market Revenue (million), by Type 2025 & 2033
- Figure 48: Europe Niobium Market Volume (kilotons), by Type 2025 & 2033
- Figure 49: Europe Niobium Market Revenue Share (%), by Type 2025 & 2033
- Figure 50: Europe Niobium Market Volume Share (%), by Type 2025 & 2033
- Figure 51: Europe Niobium Market Revenue (million), by Application 2025 & 2033
- Figure 52: Europe Niobium Market Volume (kilotons), by Application 2025 & 2033
- Figure 53: Europe Niobium Market Revenue Share (%), by Application 2025 & 2033
- Figure 54: Europe Niobium Market Volume Share (%), by Application 2025 & 2033
- Figure 55: Europe Niobium Market Revenue (million), by End-user Industry 2025 & 2033
- Figure 56: Europe Niobium Market Volume (kilotons), by End-user Industry 2025 & 2033
- Figure 57: Europe Niobium Market Revenue Share (%), by End-user Industry 2025 & 2033
- Figure 58: Europe Niobium Market Volume Share (%), by End-user Industry 2025 & 2033
- Figure 59: Europe Niobium Market Revenue (million), by Country 2025 & 2033
- Figure 60: Europe Niobium Market Volume (kilotons), by Country 2025 & 2033
- Figure 61: Europe Niobium Market Revenue Share (%), by Country 2025 & 2033
- Figure 62: Europe Niobium Market Volume Share (%), by Country 2025 & 2033
- Figure 63: South America Niobium Market Revenue (million), by Occurrence 2025 & 2033
- Figure 64: South America Niobium Market Volume (kilotons), by Occurrence 2025 & 2033
- Figure 65: South America Niobium Market Revenue Share (%), by Occurrence 2025 & 2033
- Figure 66: South America Niobium Market Volume Share (%), by Occurrence 2025 & 2033
- Figure 67: South America Niobium Market Revenue (million), by Type 2025 & 2033
- Figure 68: South America Niobium Market Volume (kilotons), by Type 2025 & 2033
- Figure 69: South America Niobium Market Revenue Share (%), by Type 2025 & 2033
- Figure 70: South America Niobium Market Volume Share (%), by Type 2025 & 2033
- Figure 71: South America Niobium Market Revenue (million), by Application 2025 & 2033
- Figure 72: South America Niobium Market Volume (kilotons), by Application 2025 & 2033
- Figure 73: South America Niobium Market Revenue Share (%), by Application 2025 & 2033
- Figure 74: South America Niobium Market Volume Share (%), by Application 2025 & 2033
- Figure 75: South America Niobium Market Revenue (million), by End-user Industry 2025 & 2033
- Figure 76: South America Niobium Market Volume (kilotons), by End-user Industry 2025 & 2033
- Figure 77: South America Niobium Market Revenue Share (%), by End-user Industry 2025 & 2033
- Figure 78: South America Niobium Market Volume Share (%), by End-user Industry 2025 & 2033
- Figure 79: South America Niobium Market Revenue (million), by Country 2025 & 2033
- Figure 80: South America Niobium Market Volume (kilotons), by Country 2025 & 2033
- Figure 81: South America Niobium Market Revenue Share (%), by Country 2025 & 2033
- Figure 82: South America Niobium Market Volume Share (%), by Country 2025 & 2033
- Figure 83: Middle East and Africa Niobium Market Revenue (million), by Occurrence 2025 & 2033
- Figure 84: Middle East and Africa Niobium Market Volume (kilotons), by Occurrence 2025 & 2033
- Figure 85: Middle East and Africa Niobium Market Revenue Share (%), by Occurrence 2025 & 2033
- Figure 86: Middle East and Africa Niobium Market Volume Share (%), by Occurrence 2025 & 2033
- Figure 87: Middle East and Africa Niobium Market Revenue (million), by Type 2025 & 2033
- Figure 88: Middle East and Africa Niobium Market Volume (kilotons), by Type 2025 & 2033
- Figure 89: Middle East and Africa Niobium Market Revenue Share (%), by Type 2025 & 2033
- Figure 90: Middle East and Africa Niobium Market Volume Share (%), by Type 2025 & 2033
- Figure 91: Middle East and Africa Niobium Market Revenue (million), by Application 2025 & 2033
- Figure 92: Middle East and Africa Niobium Market Volume (kilotons), by Application 2025 & 2033
- Figure 93: Middle East and Africa Niobium Market Revenue Share (%), by Application 2025 & 2033
- Figure 94: Middle East and Africa Niobium Market Volume Share (%), by Application 2025 & 2033
- Figure 95: Middle East and Africa Niobium Market Revenue (million), by End-user Industry 2025 & 2033
- Figure 96: Middle East and Africa Niobium Market Volume (kilotons), by End-user Industry 2025 & 2033
- Figure 97: Middle East and Africa Niobium Market Revenue Share (%), by End-user Industry 2025 & 2033
- Figure 98: Middle East and Africa Niobium Market Volume Share (%), by End-user Industry 2025 & 2033
- Figure 99: Middle East and Africa Niobium Market Revenue (million), by Country 2025 & 2033
- Figure 100: Middle East and Africa Niobium Market Volume (kilotons), by Country 2025 & 2033
- Figure 101: Middle East and Africa Niobium Market Revenue Share (%), by Country 2025 & 2033
- Figure 102: Middle East and Africa Niobium Market Volume Share (%), by Country 2025 & 2033
List of Tables
- Table 1: Global Niobium Market Revenue million Forecast, by Occurrence 2020 & 2033
- Table 2: Global Niobium Market Volume kilotons Forecast, by Occurrence 2020 & 2033
- Table 3: Global Niobium Market Revenue million Forecast, by Type 2020 & 2033
- Table 4: Global Niobium Market Volume kilotons Forecast, by Type 2020 & 2033
- Table 5: Global Niobium Market Revenue million Forecast, by Application 2020 & 2033
- Table 6: Global Niobium Market Volume kilotons Forecast, by Application 2020 & 2033
- Table 7: Global Niobium Market Revenue million Forecast, by End-user Industry 2020 & 2033
- Table 8: Global Niobium Market Volume kilotons Forecast, by End-user Industry 2020 & 2033
- Table 9: Global Niobium Market Revenue million Forecast, by Region 2020 & 2033
- Table 10: Global Niobium Market Volume kilotons Forecast, by Region 2020 & 2033
- Table 11: Global Niobium Market Revenue million Forecast, by Occurrence 2020 & 2033
- Table 12: Global Niobium Market Volume kilotons Forecast, by Occurrence 2020 & 2033
- Table 13: Global Niobium Market Revenue million Forecast, by Type 2020 & 2033
- Table 14: Global Niobium Market Volume kilotons Forecast, by Type 2020 & 2033
- Table 15: Global Niobium Market Revenue million Forecast, by Application 2020 & 2033
- Table 16: Global Niobium Market Volume kilotons Forecast, by Application 2020 & 2033
- Table 17: Global Niobium Market Revenue million Forecast, by End-user Industry 2020 & 2033
- Table 18: Global Niobium Market Volume kilotons Forecast, by End-user Industry 2020 & 2033
- Table 19: Global Niobium Market Revenue million Forecast, by Country 2020 & 2033
- Table 20: Global Niobium Market Volume kilotons Forecast, by Country 2020 & 2033
- Table 21: China Niobium Market Revenue (million) Forecast, by Application 2020 & 2033
- Table 22: China Niobium Market Volume (kilotons) Forecast, by Application 2020 & 2033
- Table 23: India Niobium Market Revenue (million) Forecast, by Application 2020 & 2033
- Table 24: India Niobium Market Volume (kilotons) Forecast, by Application 2020 & 2033
- Table 25: Japan Niobium Market Revenue (million) Forecast, by Application 2020 & 2033
- Table 26: Japan Niobium Market Volume (kilotons) Forecast, by Application 2020 & 2033
- Table 27: South Korea Niobium Market Revenue (million) Forecast, by Application 2020 & 2033
- Table 28: South Korea Niobium Market Volume (kilotons) Forecast, by Application 2020 & 2033
- Table 29: Rest of Asia Pacific Niobium Market Revenue (million) Forecast, by Application 2020 & 2033
- Table 30: Rest of Asia Pacific Niobium Market Volume (kilotons) Forecast, by Application 2020 & 2033
- Table 31: Global Niobium Market Revenue million Forecast, by Occurrence 2020 & 2033
- Table 32: Global Niobium Market Volume kilotons Forecast, by Occurrence 2020 & 2033
- Table 33: Global Niobium Market Revenue million Forecast, by Type 2020 & 2033
- Table 34: Global Niobium Market Volume kilotons Forecast, by Type 2020 & 2033
- Table 35: Global Niobium Market Revenue million Forecast, by Application 2020 & 2033
- Table 36: Global Niobium Market Volume kilotons Forecast, by Application 2020 & 2033
- Table 37: Global Niobium Market Revenue million Forecast, by End-user Industry 2020 & 2033
- Table 38: Global Niobium Market Volume kilotons Forecast, by End-user Industry 2020 & 2033
- Table 39: Global Niobium Market Revenue million Forecast, by Country 2020 & 2033
- Table 40: Global Niobium Market Volume kilotons Forecast, by Country 2020 & 2033
- Table 41: United States Niobium Market Revenue (million) Forecast, by Application 2020 & 2033
- Table 42: United States Niobium Market Volume (kilotons) Forecast, by Application 2020 & 2033
- Table 43: Canada Niobium Market Revenue (million) Forecast, by Application 2020 & 2033
- Table 44: Canada Niobium Market Volume (kilotons) Forecast, by Application 2020 & 2033
- Table 45: Mexico Niobium Market Revenue (million) Forecast, by Application 2020 & 2033
- Table 46: Mexico Niobium Market Volume (kilotons) Forecast, by Application 2020 & 2033
- Table 47: Global Niobium Market Revenue million Forecast, by Occurrence 2020 & 2033
- Table 48: Global Niobium Market Volume kilotons Forecast, by Occurrence 2020 & 2033
- Table 49: Global Niobium Market Revenue million Forecast, by Type 2020 & 2033
- Table 50: Global Niobium Market Volume kilotons Forecast, by Type 2020 & 2033
- Table 51: Global Niobium Market Revenue million Forecast, by Application 2020 & 2033
- Table 52: Global Niobium Market Volume kilotons Forecast, by Application 2020 & 2033
- Table 53: Global Niobium Market Revenue million Forecast, by End-user Industry 2020 & 2033
- Table 54: Global Niobium Market Volume kilotons Forecast, by End-user Industry 2020 & 2033
- Table 55: Global Niobium Market Revenue million Forecast, by Country 2020 & 2033
- Table 56: Global Niobium Market Volume kilotons Forecast, by Country 2020 & 2033
- Table 57: Germany Niobium Market Revenue (million) Forecast, by Application 2020 & 2033
- Table 58: Germany Niobium Market Volume (kilotons) Forecast, by Application 2020 & 2033
- Table 59: United Kingdom Niobium Market Revenue (million) Forecast, by Application 2020 & 2033
- Table 60: United Kingdom Niobium Market Volume (kilotons) Forecast, by Application 2020 & 2033
- Table 61: Russia Niobium Market Revenue (million) Forecast, by Application 2020 & 2033
- Table 62: Russia Niobium Market Volume (kilotons) Forecast, by Application 2020 & 2033
- Table 63: Italy Niobium Market Revenue (million) Forecast, by Application 2020 & 2033
- Table 64: Italy Niobium Market Volume (kilotons) Forecast, by Application 2020 & 2033
- Table 65: Rest of Europe Niobium Market Revenue (million) Forecast, by Application 2020 & 2033
- Table 66: Rest of Europe Niobium Market Volume (kilotons) Forecast, by Application 2020 & 2033
- Table 67: Global Niobium Market Revenue million Forecast, by Occurrence 2020 & 2033
- Table 68: Global Niobium Market Volume kilotons Forecast, by Occurrence 2020 & 2033
- Table 69: Global Niobium Market Revenue million Forecast, by Type 2020 & 2033
- Table 70: Global Niobium Market Volume kilotons Forecast, by Type 2020 & 2033
- Table 71: Global Niobium Market Revenue million Forecast, by Application 2020 & 2033
- Table 72: Global Niobium Market Volume kilotons Forecast, by Application 2020 & 2033
- Table 73: Global Niobium Market Revenue million Forecast, by End-user Industry 2020 & 2033
- Table 74: Global Niobium Market Volume kilotons Forecast, by End-user Industry 2020 & 2033
- Table 75: Global Niobium Market Revenue million Forecast, by Country 2020 & 2033
- Table 76: Global Niobium Market Volume kilotons Forecast, by Country 2020 & 2033
- Table 77: Brazil Niobium Market Revenue (million) Forecast, by Application 2020 & 2033
- Table 78: Brazil Niobium Market Volume (kilotons) Forecast, by Application 2020 & 2033
- Table 79: Argentina Niobium Market Revenue (million) Forecast, by Application 2020 & 2033
- Table 80: Argentina Niobium Market Volume (kilotons) Forecast, by Application 2020 & 2033
- Table 81: Rest of South America Niobium Market Revenue (million) Forecast, by Application 2020 & 2033
- Table 82: Rest of South America Niobium Market Volume (kilotons) Forecast, by Application 2020 & 2033
- Table 83: Global Niobium Market Revenue million Forecast, by Occurrence 2020 & 2033
- Table 84: Global Niobium Market Volume kilotons Forecast, by Occurrence 2020 & 2033
- Table 85: Global Niobium Market Revenue million Forecast, by Type 2020 & 2033
- Table 86: Global Niobium Market Volume kilotons Forecast, by Type 2020 & 2033
- Table 87: Global Niobium Market Revenue million Forecast, by Application 2020 & 2033
- Table 88: Global Niobium Market Volume kilotons Forecast, by Application 2020 & 2033
- Table 89: Global Niobium Market Revenue million Forecast, by End-user Industry 2020 & 2033
- Table 90: Global Niobium Market Volume kilotons Forecast, by End-user Industry 2020 & 2033
- Table 91: Global Niobium Market Revenue million Forecast, by Country 2020 & 2033
- Table 92: Global Niobium Market Volume kilotons Forecast, by Country 2020 & 2033
- Table 93: Saudi Arabia Niobium Market Revenue (million) Forecast, by Application 2020 & 2033
- Table 94: Saudi Arabia Niobium Market Volume (kilotons) Forecast, by Application 2020 & 2033
- Table 95: South Africa Niobium Market Revenue (million) Forecast, by Application 2020 & 2033
- Table 96: South Africa Niobium Market Volume (kilotons) Forecast, by Application 2020 & 2033
- Table 97: Rest of Middle East and Africa Niobium Market Revenue (million) Forecast, by Application 2020 & 2033
- Table 98: Rest of Middle East and Africa Niobium Market Volume (kilotons) Forecast, by Application 2020 & 2033
Frequently Asked Questions
1. What is the projected Compound Annual Growth Rate (CAGR) of the Niobium Market?
The projected CAGR is approximately 3.9%.
2. Which companies are prominent players in the Niobium Market?
Key companies in the market include Grandview Materials, Titanex GmbH*List Not Exhaustive, CMOC, NioCorp Development Ltd, Magris Performance Materials, Changsha South Tantalum Niobium Co Ltd, Admat Inc, Australian Strategic Materials Ltd, CBMM.
3. What are the main segments of the Niobium Market?
The market segments include Occurrence, Type, Application, End-user Industry.
4. Can you provide details about the market size?
The market size is estimated to be USD 1409 million as of 2022.
5. What are some drivers contributing to market growth?
Accelerating Usage in Structural Steel; Growing Demand for Lighter-Weight and More Fuel-Efficient Vehicles.
6. What are the notable trends driving market growth?
Construction Sector to Dominate the Market.
7. Are there any restraints impacting market growth?
Limited Supply Sources; Concerns About Health Issues on Acute Exposure.
8. Can you provide examples of recent developments in the market?
December 2022: CBMM announced a significant investment of USD 80 million to expand its niobium oxide capacity from 500 tons to 3,000 tons by 2024. Collaborating with Echion Technologies, CBMM plans to establish a niobium oxide facility at its Araxá plant in Minas Gerais, Brazil, aligning with its goal of achieving a niobium oxide capacity of 40,000 tons by 2030.
9. What pricing options are available for accessing the report?
Pricing options include single-user, multi-user, and enterprise licenses priced at USD 4750, USD 5250, and USD 8750 respectively.
10. Is the market size provided in terms of value or volume?
The market size is provided in terms of value, measured in million and volume, measured in kilotons.
11. Are there any specific market keywords associated with the report?
Yes, the market keyword associated with the report is "Niobium Market," which aids in identifying and referencing the specific market segment covered.
12. How do I determine which pricing option suits my needs best?
The pricing options vary based on user requirements and access needs. Individual users may opt for single-user licenses, while businesses requiring broader access may choose multi-user or enterprise licenses for cost-effective access to the report.
13. Are there any additional resources or data provided in the Niobium Market report?
While the report offers comprehensive insights, it's advisable to review the specific contents or supplementary materials provided to ascertain if additional resources or data are available.
14. How can I stay updated on further developments or reports in the Niobium Market?
To stay informed about further developments, trends, and reports in the Niobium Market, consider subscribing to industry newsletters, following relevant companies and organizations, or regularly checking reputable industry news sources and publications.
Methodology
Step 1 - Identification of Relevant Samples Size from Population Database


Step 2 - Approaches for Defining Global Market Size (Value, Volume* & Price*)

Note*: In applicable scenarios
Step 3 - Data Sources
Primary Research
- Web Analytics
- Survey Reports
- Research Institute
- Latest Research Reports
- Opinion Leaders
Secondary Research
- Annual Reports
- White Paper
- Latest Press Release
- Industry Association
- Paid Database
- Investor Presentations

Step 4 - Data Triangulation
Involves using different sources of information in order to increase the validity of a study
These sources are likely to be stakeholders in a program - participants, other researchers, program staff, other community members, and so on.
Then we put all data in single framework & apply various statistical tools to find out the dynamic on the market.
During the analysis stage, feedback from the stakeholder groups would be compared to determine areas of agreement as well as areas of divergence