

Key Insights
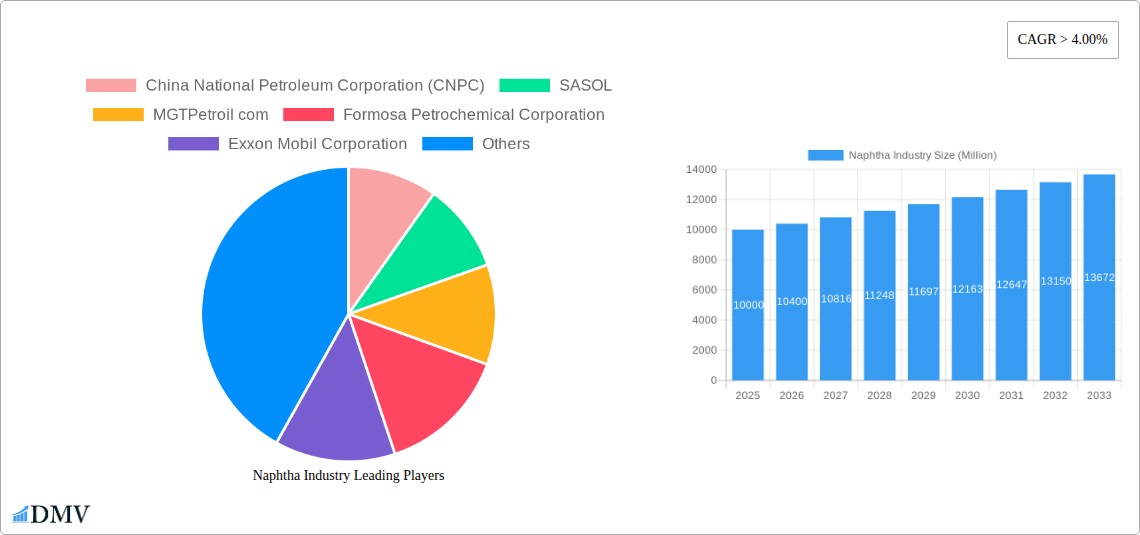
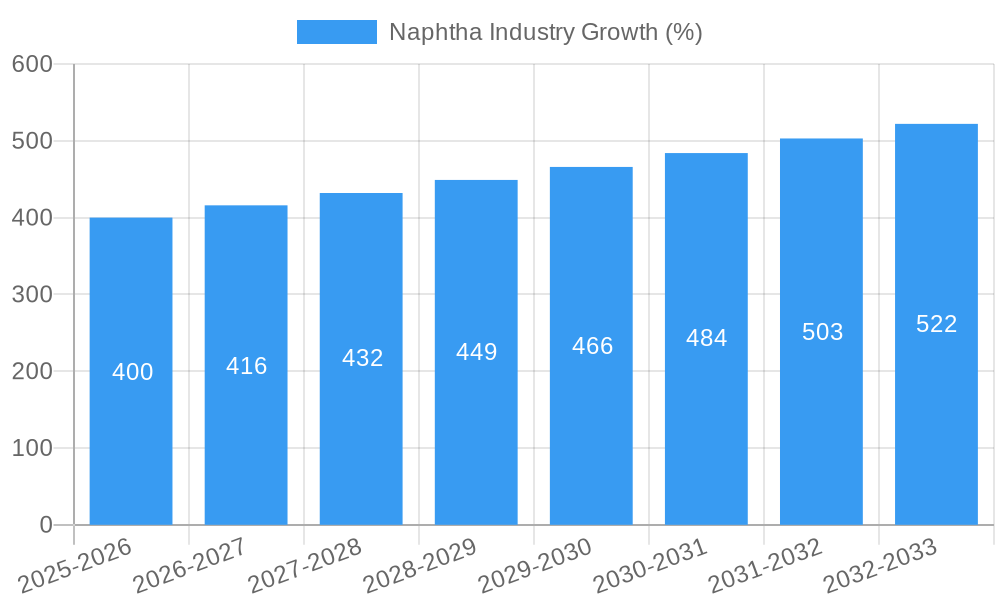
The naphtha market, valued at approximately $XX million in 2025, is projected to experience robust growth, exceeding a 4% CAGR from 2025 to 2033. This expansion is driven primarily by increasing demand from the petrochemical sector, fueled by the rising global consumption of plastics and other petrochemical-derived products. Growth in the paints and coatings industry, particularly in developing economies experiencing rapid infrastructure development, also contributes significantly. The Asia-Pacific region, especially China and India, is expected to dominate the market due to their substantial petrochemical industries and burgeoning construction sectors. Light naphtha, owing to its versatility and suitability for various applications, holds a larger market share compared to heavy naphtha. However, advancements in refining technologies and growing demand for specific petrochemical feedstocks are expected to influence the type-specific market share dynamics throughout the forecast period. While the market faces constraints such as fluctuating crude oil prices and environmental concerns regarding the carbon footprint of naphtha-derived products, ongoing research into sustainable alternatives and stricter environmental regulations are prompting industry players to explore cleaner production methods and downstream applications.
The competitive landscape is characterized by a mix of large, integrated oil and gas companies and specialized petrochemical producers. Companies like CNPC, Sasol, and ExxonMobil are major players, leveraging their extensive global networks and established refining capabilities. However, the market is also witnessing increased participation from regional players, particularly in Asia-Pacific, driving competitive intensity. Strategic partnerships, mergers and acquisitions, and investments in research and development are key strategies employed by companies to enhance their market position and adapt to evolving market dynamics. The forecast period will likely see a shift towards more sustainable practices within the naphtha industry, influenced by growing environmental awareness and tightening regulations. This necessitates ongoing innovation and adaptation from industry players, pushing the sector towards a more environmentally responsible future.
Naphtha Industry Market Report: 2019-2033
This comprehensive report provides a detailed analysis of the global naphtha industry, covering the period from 2019 to 2033. It offers invaluable insights into market trends, competitive dynamics, and future growth potential, equipping stakeholders with the knowledge necessary for informed decision-making. The report meticulously examines key segments, including light and heavy naphtha, and analyzes end-user industries such as petrochemicals, agriculture, paints and coatings, and aerospace. With a base year of 2025 and a forecast period extending to 2033, this report is an essential resource for understanding the evolution and future of the naphtha market. The report incorporates data from leading players including China National Petroleum Corporation (CNPC), SASOL, MGTPetroil com, Formosa Petrochemical Corporation, Exxon Mobil Corporation, Chevron Phillips Chemical Company LLC, Reliance Industries Limited, PetroChina Company Limited, AMOC (Alexandria Mineral Oils Co), SABIC, Petroleos Mexicanos, Saudi Arabian Oil Co (Saudi Aramco), LG Chem, Royal Dutch Shell PLC, BP PLC, and China Petroleum & Chemical Corporation (SINOPEC).
Naphtha Industry Market Composition & Trends
This section delves into the intricate structure of the naphtha market, evaluating its concentration, innovation drivers, regulatory environment, substitute products, end-user profiles, and merger and acquisition (M&A) activities. The global naphtha market, valued at approximately xx Million in 2024, is expected to reach xx Million by 2033, exhibiting a Compound Annual Growth Rate (CAGR) of xx%. Market share is largely concentrated among a few major players, with CNPC and Saudi Aramco holding significant positions. However, the market is dynamic, with considerable M&A activity shaping the competitive landscape. Recent deals have involved investments totaling xx Million, primarily focused on expanding production capacity and integrating upstream and downstream operations.
- Market Concentration: High, with a few dominant players.
- Innovation Catalysts: Focus on efficiency improvements in refining and petrochemical processes.
- Regulatory Landscape: Varies by region, impacting production and distribution.
- Substitute Products: Growing use of alternatives in specific applications is pressuring market share.
- End-User Profiles: Petrochemicals dominate, with agriculture and paints & coatings showing steady growth.
- M&A Activity: Significant investments in capacity expansion and downstream integration, with deal values reaching xx Million annually.
Naphtha Industry Industry Evolution
The naphtha industry has witnessed substantial evolution during the historical period (2019-2024) and is projected to continue its transformation throughout the forecast period (2025-2033). Market growth has been driven by the increasing demand for petrochemicals, particularly in developing economies. Technological advancements in refining and cracking processes have improved efficiency and product yield. However, fluctuating crude oil prices and environmental regulations have posed significant challenges. The industry has adapted by focusing on sustainable practices and exploring alternative feedstocks to mitigate these challenges. This transition, coupled with continued investment in petrochemical projects (as seen with ExxonMobil's xx Million investment in Guangdong), indicates promising future growth. The adoption of advanced technologies, such as smart refineries and process optimization software, is improving efficiency and reducing environmental impact, creating a dynamic and evolving market. The industry growth rate is projected at xx% during the forecast period.
Leading Regions, Countries, or Segments in Naphtha Industry
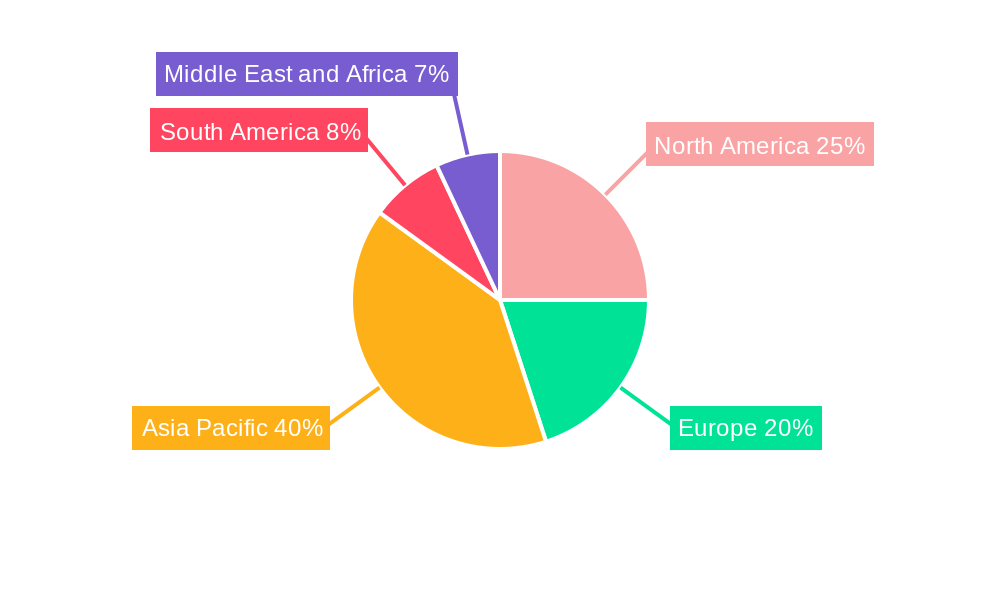
The Asia-Pacific region, specifically China and other East Asian nations, currently holds the dominant position in the naphtha market. This dominance is primarily attributed to the region's robust petrochemical industry and significant investments in refining capacity.
Key Drivers for Asia-Pacific Dominance:
- High demand for petrochemicals fueled by rapid industrialization and economic growth.
- Significant investments in new refinery and petrochemical projects.
- Government support for the development of the petrochemical sector.
By Type: Light naphtha currently enjoys a larger market share due to its suitability for diverse applications, including gasoline blending and petrochemical feedstock.
By End-user Industry: The petrochemical sector overwhelmingly dominates the demand for naphtha, with its use as a primary feedstock in the production of olefins and aromatics.
The Middle East also holds a significant share, owing to its abundant crude oil reserves and the presence of major integrated oil companies. However, the region faces challenges concerning environmental regulations and diversification into higher-value-added products. North America and Europe also contribute significantly but demonstrate slower growth compared to Asia and the Middle East.
Naphtha Industry Product Innovations
Recent innovations in naphtha processing focus on improving yield and reducing by-products. Advanced catalytic cracking technologies have increased the production of valuable petrochemicals, while process optimization techniques minimize energy consumption and environmental impact. The development of new catalysts and improved reactor designs has further enhanced efficiency. Furthermore, advancements in downstream processing have resulted in the production of higher-quality, specialized naphtha derivatives, catering to the demands of niche markets.
Propelling Factors for Naphtha Industry Growth
The naphtha industry’s growth is propelled by several key factors. The burgeoning petrochemical industry, particularly in developing economies, is a significant driver, creating substantial demand for naphtha as a feedstock. Technological advancements in refining processes have enhanced efficiency and product yields, boosting production. Government incentives and supportive policies in several regions are also fostering investment and expansion within the industry. Finally, the increasing demand for various end-use products, such as plastics and fertilizers, further fuels the growth trajectory.
Obstacles in the Naphtha Industry Market
The naphtha market faces obstacles such as fluctuating crude oil prices, which directly impact production costs and profitability. Environmental regulations, particularly regarding emissions and waste disposal, impose compliance costs and may limit expansion opportunities. Geopolitical instability and supply chain disruptions can cause price volatility and threaten the security of supply. Furthermore, intense competition among major players necessitates continuous innovation and cost optimization strategies to maintain market share.
Future Opportunities in Naphtha Industry
Future opportunities lie in the development of more sustainable and efficient naphtha processing technologies, including the integration of renewable energy sources and the exploration of alternative feedstocks. Expanding into new markets, particularly in developing regions with growing petrochemical industries, presents significant potential. The focus on higher-value-added products and specialty chemicals further offers diversification avenues and enhanced profitability.
Major Players in the Naphtha Industry Ecosystem
- China National Petroleum Corporation (CNPC)
- SASOL
- MGTPetroil com
- Formosa Petrochemical Corporation
- Exxon Mobil Corporation
- Chevron Phillips Chemical Company LLC
- Reliance Industries Limited
- PetroChina Company Limited
- AMOC (Alexandria Mineral Oils Co)
- SABIC
- Petroleos Mexicanos
- Saudi Arabian Oil Co (Saudi Aramco)
- LG Chem
- Royal Dutch Shell PLC
- BP PLC
- China Petroleum & Chemical Corporation (SINOPEC)
Key Developments in Naphtha Industry Industry
- November 2021: Exxon Mobil announced a multi-billion-dollar investment in a chemical complex in Guangdong, China, boosting production by 1.6 Million tonnes/year.
- October 2022: LG Chem's seven-week naphtha cracker shutdown in South Korea impacted regional petrochemical supply.
Strategic Naphtha Industry Market Forecast
The naphtha market is poised for continued growth, driven by robust demand from the petrochemical sector and ongoing investments in refining capacity, particularly in Asia. Technological advancements and the focus on sustainability will shape the industry's future, presenting opportunities for innovation and diversification. The market's expansion into new applications and regions, coupled with the development of higher-value-added products, will contribute to its overall growth trajectory over the forecast period. Continued M&A activity is also expected to further consolidate the market and shape the competitive landscape.
Naphtha Industry Segmentation
-
1. Type
- 1.1. Light Naphtha
- 1.2. Heavy Naptha
-
2. End-user Industry
- 2.1. Petrochemical
- 2.2. Agriculture
- 2.3. Paints and Coatings
- 2.4. Aerospace
- 2.5. Other End-user Industries
Naphtha Industry Segmentation By Geography
-
1. Asia Pacific
- 1.1. China
- 1.2. India
- 1.3. Japan
- 1.4. South Korea
- 1.5. Rest of Asia Pacific
-
2. North America
- 2.1. United States
- 2.2. Canada
- 2.3. Mexico
-
3. Europe
- 3.1. Germany
- 3.2. United Kingdom
- 3.3. Italy
- 3.4. France
- 3.5. Rest of Europe
-
4. South America
- 4.1. Brazil
- 4.2. Argentina
- 4.3. Rest of South America
-
5. Middle East and Africa
- 5.1. Saudi Arabia
- 5.2. South Africa
- 5.3. Rest of Middle East and Africa
Naphtha Industry REPORT HIGHLIGHTS
| Aspects | Details |
|---|---|
| Study Period | 2019-2033 |
| Base Year | 2024 |
| Estimated Year | 2025 |
| Forecast Period | 2025-2033 |
| Historical Period | 2019-2024 |
| Growth Rate | CAGR of > 4.00% from 2019-2033 |
| Segmentation |
|
Table of Contents
- 1. Introduction
- 1.1. Research Scope
- 1.2. Market Segmentation
- 1.3. Research Methodology
- 1.4. Definitions and Assumptions
- 2. Executive Summary
- 2.1. Introduction
- 3. Market Dynamics
- 3.1. Introduction
- 3.2. Market Drivers
- 3.2.1. Increasing Demand for Petrochemicals in Asia Pacific; Rising Demand for Fertilizers in India
- 3.3. Market Restrains
- 3.3.1. Natural Gas Liquid Demand in the United States
- 3.4. Market Trends
- 3.4.1. Rising Demand from Petrochemical Industry
- 4. Market Factor Analysis
- 4.1. Porters Five Forces
- 4.2. Supply/Value Chain
- 4.3. PESTEL analysis
- 4.4. Market Entropy
- 4.5. Patent/Trademark Analysis
- 5. Global Naphtha Industry Analysis, Insights and Forecast, 2019-2031
- 5.1. Market Analysis, Insights and Forecast - by Type
- 5.1.1. Light Naphtha
- 5.1.2. Heavy Naptha
- 5.2. Market Analysis, Insights and Forecast - by End-user Industry
- 5.2.1. Petrochemical
- 5.2.2. Agriculture
- 5.2.3. Paints and Coatings
- 5.2.4. Aerospace
- 5.2.5. Other End-user Industries
- 5.3. Market Analysis, Insights and Forecast - by Region
- 5.3.1. Asia Pacific
- 5.3.2. North America
- 5.3.3. Europe
- 5.3.4. South America
- 5.3.5. Middle East and Africa
- 5.1. Market Analysis, Insights and Forecast - by Type
- 6. Asia Pacific Naphtha Industry Analysis, Insights and Forecast, 2019-2031
- 6.1. Market Analysis, Insights and Forecast - by Type
- 6.1.1. Light Naphtha
- 6.1.2. Heavy Naptha
- 6.2. Market Analysis, Insights and Forecast - by End-user Industry
- 6.2.1. Petrochemical
- 6.2.2. Agriculture
- 6.2.3. Paints and Coatings
- 6.2.4. Aerospace
- 6.2.5. Other End-user Industries
- 6.1. Market Analysis, Insights and Forecast - by Type
- 7. North America Naphtha Industry Analysis, Insights and Forecast, 2019-2031
- 7.1. Market Analysis, Insights and Forecast - by Type
- 7.1.1. Light Naphtha
- 7.1.2. Heavy Naptha
- 7.2. Market Analysis, Insights and Forecast - by End-user Industry
- 7.2.1. Petrochemical
- 7.2.2. Agriculture
- 7.2.3. Paints and Coatings
- 7.2.4. Aerospace
- 7.2.5. Other End-user Industries
- 7.1. Market Analysis, Insights and Forecast - by Type
- 8. Europe Naphtha Industry Analysis, Insights and Forecast, 2019-2031
- 8.1. Market Analysis, Insights and Forecast - by Type
- 8.1.1. Light Naphtha
- 8.1.2. Heavy Naptha
- 8.2. Market Analysis, Insights and Forecast - by End-user Industry
- 8.2.1. Petrochemical
- 8.2.2. Agriculture
- 8.2.3. Paints and Coatings
- 8.2.4. Aerospace
- 8.2.5. Other End-user Industries
- 8.1. Market Analysis, Insights and Forecast - by Type
- 9. South America Naphtha Industry Analysis, Insights and Forecast, 2019-2031
- 9.1. Market Analysis, Insights and Forecast - by Type
- 9.1.1. Light Naphtha
- 9.1.2. Heavy Naptha
- 9.2. Market Analysis, Insights and Forecast - by End-user Industry
- 9.2.1. Petrochemical
- 9.2.2. Agriculture
- 9.2.3. Paints and Coatings
- 9.2.4. Aerospace
- 9.2.5. Other End-user Industries
- 9.1. Market Analysis, Insights and Forecast - by Type
- 10. Middle East and Africa Naphtha Industry Analysis, Insights and Forecast, 2019-2031
- 10.1. Market Analysis, Insights and Forecast - by Type
- 10.1.1. Light Naphtha
- 10.1.2. Heavy Naptha
- 10.2. Market Analysis, Insights and Forecast - by End-user Industry
- 10.2.1. Petrochemical
- 10.2.2. Agriculture
- 10.2.3. Paints and Coatings
- 10.2.4. Aerospace
- 10.2.5. Other End-user Industries
- 10.1. Market Analysis, Insights and Forecast - by Type
- 11. Asia Pacific Naphtha Industry Analysis, Insights and Forecast, 2019-2031
- 11.1. Market Analysis, Insights and Forecast - By Country/Sub-region
- 11.1.1 China
- 11.1.2 India
- 11.1.3 Japan
- 11.1.4 South Korea
- 11.1.5 Rest of Asia Pacific
- 12. North America Naphtha Industry Analysis, Insights and Forecast, 2019-2031
- 12.1. Market Analysis, Insights and Forecast - By Country/Sub-region
- 12.1.1 United States
- 12.1.2 Canada
- 12.1.3 Mexico
- 13. Europe Naphtha Industry Analysis, Insights and Forecast, 2019-2031
- 13.1. Market Analysis, Insights and Forecast - By Country/Sub-region
- 13.1.1 Germany
- 13.1.2 United Kingdom
- 13.1.3 Italy
- 13.1.4 France
- 13.1.5 Rest of Europe
- 14. South America Naphtha Industry Analysis, Insights and Forecast, 2019-2031
- 14.1. Market Analysis, Insights and Forecast - By Country/Sub-region
- 14.1.1 Brazil
- 14.1.2 Argentina
- 14.1.3 Rest of South America
- 15. Middle East and Africa Naphtha Industry Analysis, Insights and Forecast, 2019-2031
- 15.1. Market Analysis, Insights and Forecast - By Country/Sub-region
- 15.1.1 Saudi Arabia
- 15.1.2 South Africa
- 15.1.3 Rest of Middle East and Africa
- 16. Competitive Analysis
- 16.1. Global Market Share Analysis 2024
- 16.2. Company Profiles
- 16.2.1 China National Petroleum Corporation (CNPC)
- 16.2.1.1. Overview
- 16.2.1.2. Products
- 16.2.1.3. SWOT Analysis
- 16.2.1.4. Recent Developments
- 16.2.1.5. Financials (Based on Availability)
- 16.2.2 SASOL
- 16.2.2.1. Overview
- 16.2.2.2. Products
- 16.2.2.3. SWOT Analysis
- 16.2.2.4. Recent Developments
- 16.2.2.5. Financials (Based on Availability)
- 16.2.3 MGTPetroil com
- 16.2.3.1. Overview
- 16.2.3.2. Products
- 16.2.3.3. SWOT Analysis
- 16.2.3.4. Recent Developments
- 16.2.3.5. Financials (Based on Availability)
- 16.2.4 Formosa Petrochemical Corporation
- 16.2.4.1. Overview
- 16.2.4.2. Products
- 16.2.4.3. SWOT Analysis
- 16.2.4.4. Recent Developments
- 16.2.4.5. Financials (Based on Availability)
- 16.2.5 Exxon Mobil Corporation
- 16.2.5.1. Overview
- 16.2.5.2. Products
- 16.2.5.3. SWOT Analysis
- 16.2.5.4. Recent Developments
- 16.2.5.5. Financials (Based on Availability)
- 16.2.6 Chevron Phillips Chemical Company LLC
- 16.2.6.1. Overview
- 16.2.6.2. Products
- 16.2.6.3. SWOT Analysis
- 16.2.6.4. Recent Developments
- 16.2.6.5. Financials (Based on Availability)
- 16.2.7 Reliance Industries Limited
- 16.2.7.1. Overview
- 16.2.7.2. Products
- 16.2.7.3. SWOT Analysis
- 16.2.7.4. Recent Developments
- 16.2.7.5. Financials (Based on Availability)
- 16.2.8 PetroChina Company Limited
- 16.2.8.1. Overview
- 16.2.8.2. Products
- 16.2.8.3. SWOT Analysis
- 16.2.8.4. Recent Developments
- 16.2.8.5. Financials (Based on Availability)
- 16.2.9 AMOC (Alexandria Mineral Oils Co )
- 16.2.9.1. Overview
- 16.2.9.2. Products
- 16.2.9.3. SWOT Analysis
- 16.2.9.4. Recent Developments
- 16.2.9.5. Financials (Based on Availability)
- 16.2.10 SABIC
- 16.2.10.1. Overview
- 16.2.10.2. Products
- 16.2.10.3. SWOT Analysis
- 16.2.10.4. Recent Developments
- 16.2.10.5. Financials (Based on Availability)
- 16.2.11 Petroleos Mexicanos
- 16.2.11.1. Overview
- 16.2.11.2. Products
- 16.2.11.3. SWOT Analysis
- 16.2.11.4. Recent Developments
- 16.2.11.5. Financials (Based on Availability)
- 16.2.12 Saudi Arabian Oil Co (Saudi Aramco)*List Not Exhaustive
- 16.2.12.1. Overview
- 16.2.12.2. Products
- 16.2.12.3. SWOT Analysis
- 16.2.12.4. Recent Developments
- 16.2.12.5. Financials (Based on Availability)
- 16.2.13 LG Chem
- 16.2.13.1. Overview
- 16.2.13.2. Products
- 16.2.13.3. SWOT Analysis
- 16.2.13.4. Recent Developments
- 16.2.13.5. Financials (Based on Availability)
- 16.2.14 Royal Dutch Shell PLC
- 16.2.14.1. Overview
- 16.2.14.2. Products
- 16.2.14.3. SWOT Analysis
- 16.2.14.4. Recent Developments
- 16.2.14.5. Financials (Based on Availability)
- 16.2.15 BP PLC
- 16.2.15.1. Overview
- 16.2.15.2. Products
- 16.2.15.3. SWOT Analysis
- 16.2.15.4. Recent Developments
- 16.2.15.5. Financials (Based on Availability)
- 16.2.16 China Petroleum & Chemical Corporation (SINOPEC)
- 16.2.16.1. Overview
- 16.2.16.2. Products
- 16.2.16.3. SWOT Analysis
- 16.2.16.4. Recent Developments
- 16.2.16.5. Financials (Based on Availability)
- 16.2.1 China National Petroleum Corporation (CNPC)
List of Figures
- Figure 1: Global Naphtha Industry Revenue Breakdown (Million, %) by Region 2024 & 2032
- Figure 2: Asia Pacific Naphtha Industry Revenue (Million), by Country 2024 & 2032
- Figure 3: Asia Pacific Naphtha Industry Revenue Share (%), by Country 2024 & 2032
- Figure 4: North America Naphtha Industry Revenue (Million), by Country 2024 & 2032
- Figure 5: North America Naphtha Industry Revenue Share (%), by Country 2024 & 2032
- Figure 6: Europe Naphtha Industry Revenue (Million), by Country 2024 & 2032
- Figure 7: Europe Naphtha Industry Revenue Share (%), by Country 2024 & 2032
- Figure 8: South America Naphtha Industry Revenue (Million), by Country 2024 & 2032
- Figure 9: South America Naphtha Industry Revenue Share (%), by Country 2024 & 2032
- Figure 10: Middle East and Africa Naphtha Industry Revenue (Million), by Country 2024 & 2032
- Figure 11: Middle East and Africa Naphtha Industry Revenue Share (%), by Country 2024 & 2032
- Figure 12: Asia Pacific Naphtha Industry Revenue (Million), by Type 2024 & 2032
- Figure 13: Asia Pacific Naphtha Industry Revenue Share (%), by Type 2024 & 2032
- Figure 14: Asia Pacific Naphtha Industry Revenue (Million), by End-user Industry 2024 & 2032
- Figure 15: Asia Pacific Naphtha Industry Revenue Share (%), by End-user Industry 2024 & 2032
- Figure 16: Asia Pacific Naphtha Industry Revenue (Million), by Country 2024 & 2032
- Figure 17: Asia Pacific Naphtha Industry Revenue Share (%), by Country 2024 & 2032
- Figure 18: North America Naphtha Industry Revenue (Million), by Type 2024 & 2032
- Figure 19: North America Naphtha Industry Revenue Share (%), by Type 2024 & 2032
- Figure 20: North America Naphtha Industry Revenue (Million), by End-user Industry 2024 & 2032
- Figure 21: North America Naphtha Industry Revenue Share (%), by End-user Industry 2024 & 2032
- Figure 22: North America Naphtha Industry Revenue (Million), by Country 2024 & 2032
- Figure 23: North America Naphtha Industry Revenue Share (%), by Country 2024 & 2032
- Figure 24: Europe Naphtha Industry Revenue (Million), by Type 2024 & 2032
- Figure 25: Europe Naphtha Industry Revenue Share (%), by Type 2024 & 2032
- Figure 26: Europe Naphtha Industry Revenue (Million), by End-user Industry 2024 & 2032
- Figure 27: Europe Naphtha Industry Revenue Share (%), by End-user Industry 2024 & 2032
- Figure 28: Europe Naphtha Industry Revenue (Million), by Country 2024 & 2032
- Figure 29: Europe Naphtha Industry Revenue Share (%), by Country 2024 & 2032
- Figure 30: South America Naphtha Industry Revenue (Million), by Type 2024 & 2032
- Figure 31: South America Naphtha Industry Revenue Share (%), by Type 2024 & 2032
- Figure 32: South America Naphtha Industry Revenue (Million), by End-user Industry 2024 & 2032
- Figure 33: South America Naphtha Industry Revenue Share (%), by End-user Industry 2024 & 2032
- Figure 34: South America Naphtha Industry Revenue (Million), by Country 2024 & 2032
- Figure 35: South America Naphtha Industry Revenue Share (%), by Country 2024 & 2032
- Figure 36: Middle East and Africa Naphtha Industry Revenue (Million), by Type 2024 & 2032
- Figure 37: Middle East and Africa Naphtha Industry Revenue Share (%), by Type 2024 & 2032
- Figure 38: Middle East and Africa Naphtha Industry Revenue (Million), by End-user Industry 2024 & 2032
- Figure 39: Middle East and Africa Naphtha Industry Revenue Share (%), by End-user Industry 2024 & 2032
- Figure 40: Middle East and Africa Naphtha Industry Revenue (Million), by Country 2024 & 2032
- Figure 41: Middle East and Africa Naphtha Industry Revenue Share (%), by Country 2024 & 2032
List of Tables
- Table 1: Global Naphtha Industry Revenue Million Forecast, by Region 2019 & 2032
- Table 2: Global Naphtha Industry Revenue Million Forecast, by Type 2019 & 2032
- Table 3: Global Naphtha Industry Revenue Million Forecast, by End-user Industry 2019 & 2032
- Table 4: Global Naphtha Industry Revenue Million Forecast, by Region 2019 & 2032
- Table 5: Global Naphtha Industry Revenue Million Forecast, by Country 2019 & 2032
- Table 6: China Naphtha Industry Revenue (Million) Forecast, by Application 2019 & 2032
- Table 7: India Naphtha Industry Revenue (Million) Forecast, by Application 2019 & 2032
- Table 8: Japan Naphtha Industry Revenue (Million) Forecast, by Application 2019 & 2032
- Table 9: South Korea Naphtha Industry Revenue (Million) Forecast, by Application 2019 & 2032
- Table 10: Rest of Asia Pacific Naphtha Industry Revenue (Million) Forecast, by Application 2019 & 2032
- Table 11: Global Naphtha Industry Revenue Million Forecast, by Country 2019 & 2032
- Table 12: United States Naphtha Industry Revenue (Million) Forecast, by Application 2019 & 2032
- Table 13: Canada Naphtha Industry Revenue (Million) Forecast, by Application 2019 & 2032
- Table 14: Mexico Naphtha Industry Revenue (Million) Forecast, by Application 2019 & 2032
- Table 15: Global Naphtha Industry Revenue Million Forecast, by Country 2019 & 2032
- Table 16: Germany Naphtha Industry Revenue (Million) Forecast, by Application 2019 & 2032
- Table 17: United Kingdom Naphtha Industry Revenue (Million) Forecast, by Application 2019 & 2032
- Table 18: Italy Naphtha Industry Revenue (Million) Forecast, by Application 2019 & 2032
- Table 19: France Naphtha Industry Revenue (Million) Forecast, by Application 2019 & 2032
- Table 20: Rest of Europe Naphtha Industry Revenue (Million) Forecast, by Application 2019 & 2032
- Table 21: Global Naphtha Industry Revenue Million Forecast, by Country 2019 & 2032
- Table 22: Brazil Naphtha Industry Revenue (Million) Forecast, by Application 2019 & 2032
- Table 23: Argentina Naphtha Industry Revenue (Million) Forecast, by Application 2019 & 2032
- Table 24: Rest of South America Naphtha Industry Revenue (Million) Forecast, by Application 2019 & 2032
- Table 25: Global Naphtha Industry Revenue Million Forecast, by Country 2019 & 2032
- Table 26: Saudi Arabia Naphtha Industry Revenue (Million) Forecast, by Application 2019 & 2032
- Table 27: South Africa Naphtha Industry Revenue (Million) Forecast, by Application 2019 & 2032
- Table 28: Rest of Middle East and Africa Naphtha Industry Revenue (Million) Forecast, by Application 2019 & 2032
- Table 29: Global Naphtha Industry Revenue Million Forecast, by Type 2019 & 2032
- Table 30: Global Naphtha Industry Revenue Million Forecast, by End-user Industry 2019 & 2032
- Table 31: Global Naphtha Industry Revenue Million Forecast, by Country 2019 & 2032
- Table 32: China Naphtha Industry Revenue (Million) Forecast, by Application 2019 & 2032
- Table 33: India Naphtha Industry Revenue (Million) Forecast, by Application 2019 & 2032
- Table 34: Japan Naphtha Industry Revenue (Million) Forecast, by Application 2019 & 2032
- Table 35: South Korea Naphtha Industry Revenue (Million) Forecast, by Application 2019 & 2032
- Table 36: Rest of Asia Pacific Naphtha Industry Revenue (Million) Forecast, by Application 2019 & 2032
- Table 37: Global Naphtha Industry Revenue Million Forecast, by Type 2019 & 2032
- Table 38: Global Naphtha Industry Revenue Million Forecast, by End-user Industry 2019 & 2032
- Table 39: Global Naphtha Industry Revenue Million Forecast, by Country 2019 & 2032
- Table 40: United States Naphtha Industry Revenue (Million) Forecast, by Application 2019 & 2032
- Table 41: Canada Naphtha Industry Revenue (Million) Forecast, by Application 2019 & 2032
- Table 42: Mexico Naphtha Industry Revenue (Million) Forecast, by Application 2019 & 2032
- Table 43: Global Naphtha Industry Revenue Million Forecast, by Type 2019 & 2032
- Table 44: Global Naphtha Industry Revenue Million Forecast, by End-user Industry 2019 & 2032
- Table 45: Global Naphtha Industry Revenue Million Forecast, by Country 2019 & 2032
- Table 46: Germany Naphtha Industry Revenue (Million) Forecast, by Application 2019 & 2032
- Table 47: United Kingdom Naphtha Industry Revenue (Million) Forecast, by Application 2019 & 2032
- Table 48: Italy Naphtha Industry Revenue (Million) Forecast, by Application 2019 & 2032
- Table 49: France Naphtha Industry Revenue (Million) Forecast, by Application 2019 & 2032
- Table 50: Rest of Europe Naphtha Industry Revenue (Million) Forecast, by Application 2019 & 2032
- Table 51: Global Naphtha Industry Revenue Million Forecast, by Type 2019 & 2032
- Table 52: Global Naphtha Industry Revenue Million Forecast, by End-user Industry 2019 & 2032
- Table 53: Global Naphtha Industry Revenue Million Forecast, by Country 2019 & 2032
- Table 54: Brazil Naphtha Industry Revenue (Million) Forecast, by Application 2019 & 2032
- Table 55: Argentina Naphtha Industry Revenue (Million) Forecast, by Application 2019 & 2032
- Table 56: Rest of South America Naphtha Industry Revenue (Million) Forecast, by Application 2019 & 2032
- Table 57: Global Naphtha Industry Revenue Million Forecast, by Type 2019 & 2032
- Table 58: Global Naphtha Industry Revenue Million Forecast, by End-user Industry 2019 & 2032
- Table 59: Global Naphtha Industry Revenue Million Forecast, by Country 2019 & 2032
- Table 60: Saudi Arabia Naphtha Industry Revenue (Million) Forecast, by Application 2019 & 2032
- Table 61: South Africa Naphtha Industry Revenue (Million) Forecast, by Application 2019 & 2032
- Table 62: Rest of Middle East and Africa Naphtha Industry Revenue (Million) Forecast, by Application 2019 & 2032
Frequently Asked Questions
1. What is the projected Compound Annual Growth Rate (CAGR) of the Naphtha Industry?
The projected CAGR is approximately > 4.00%.
2. Which companies are prominent players in the Naphtha Industry?
Key companies in the market include China National Petroleum Corporation (CNPC), SASOL, MGTPetroil com, Formosa Petrochemical Corporation, Exxon Mobil Corporation, Chevron Phillips Chemical Company LLC, Reliance Industries Limited, PetroChina Company Limited, AMOC (Alexandria Mineral Oils Co ), SABIC, Petroleos Mexicanos, Saudi Arabian Oil Co (Saudi Aramco)*List Not Exhaustive, LG Chem, Royal Dutch Shell PLC, BP PLC, China Petroleum & Chemical Corporation (SINOPEC).
3. What are the main segments of the Naphtha Industry?
The market segments include Type, End-user Industry.
4. Can you provide details about the market size?
The market size is estimated to be USD XX Million as of 2022.
5. What are some drivers contributing to market growth?
Increasing Demand for Petrochemicals in Asia Pacific; Rising Demand for Fertilizers in India.
6. What are the notable trends driving market growth?
Rising Demand from Petrochemical Industry.
7. Are there any restraints impacting market growth?
Natural Gas Liquid Demand in the United States.
8. Can you provide examples of recent developments in the market?
October 2022: LG Chem shuts down its naphtha crackers in South Korea for maintenance for seven weeks. It will affect the supply of petrochemicals in the region during maintenance.
9. What pricing options are available for accessing the report?
Pricing options include single-user, multi-user, and enterprise licenses priced at USD 4750, USD 5250, and USD 8750 respectively.
10. Is the market size provided in terms of value or volume?
The market size is provided in terms of value, measured in Million.
11. Are there any specific market keywords associated with the report?
Yes, the market keyword associated with the report is "Naphtha Industry," which aids in identifying and referencing the specific market segment covered.
12. How do I determine which pricing option suits my needs best?
The pricing options vary based on user requirements and access needs. Individual users may opt for single-user licenses, while businesses requiring broader access may choose multi-user or enterprise licenses for cost-effective access to the report.
13. Are there any additional resources or data provided in the Naphtha Industry report?
While the report offers comprehensive insights, it's advisable to review the specific contents or supplementary materials provided to ascertain if additional resources or data are available.
14. How can I stay updated on further developments or reports in the Naphtha Industry?
To stay informed about further developments, trends, and reports in the Naphtha Industry, consider subscribing to industry newsletters, following relevant companies and organizations, or regularly checking reputable industry news sources and publications.
Methodology
Step 1 - Identification of Relevant Samples Size from Population Database


Step 2 - Approaches for Defining Global Market Size (Value, Volume* & Price*)

Note*: In applicable scenarios
Step 3 - Data Sources
Primary Research
- Web Analytics
- Survey Reports
- Research Institute
- Latest Research Reports
- Opinion Leaders
Secondary Research
- Annual Reports
- White Paper
- Latest Press Release
- Industry Association
- Paid Database
- Investor Presentations

Step 4 - Data Triangulation
Involves using different sources of information in order to increase the validity of a study
These sources are likely to be stakeholders in a program - participants, other researchers, program staff, other community members, and so on.
Then we put all data in single framework & apply various statistical tools to find out the dynamic on the market.
During the analysis stage, feedback from the stakeholder groups would be compared to determine areas of agreement as well as areas of divergence
