

Key Insights
The global microspheres market, valued at $7.95 billion in 2025, is projected to experience robust growth, driven by increasing demand across diverse sectors. A compound annual growth rate (CAGR) of 9.10% from 2025 to 2033 signifies significant expansion opportunities. Key drivers include the rising adoption of microspheres in advanced medical technologies (drug delivery systems, diagnostics), the burgeoning automotive industry (lightweighting initiatives), and the expanding cosmetics and personal care sector (enhanced product textures and functionalities). Furthermore, the increasing use of microspheres in oil and gas applications for enhanced oil recovery and in paints and coatings for improved performance characteristics contributes to market growth. Technological advancements leading to the development of novel microsphere materials with enhanced properties, such as improved biocompatibility and controlled release capabilities, further fuel market expansion. While regulatory hurdles and potential fluctuations in raw material prices pose some challenges, the overall market outlook remains positive, with significant growth potential across all major geographic regions.
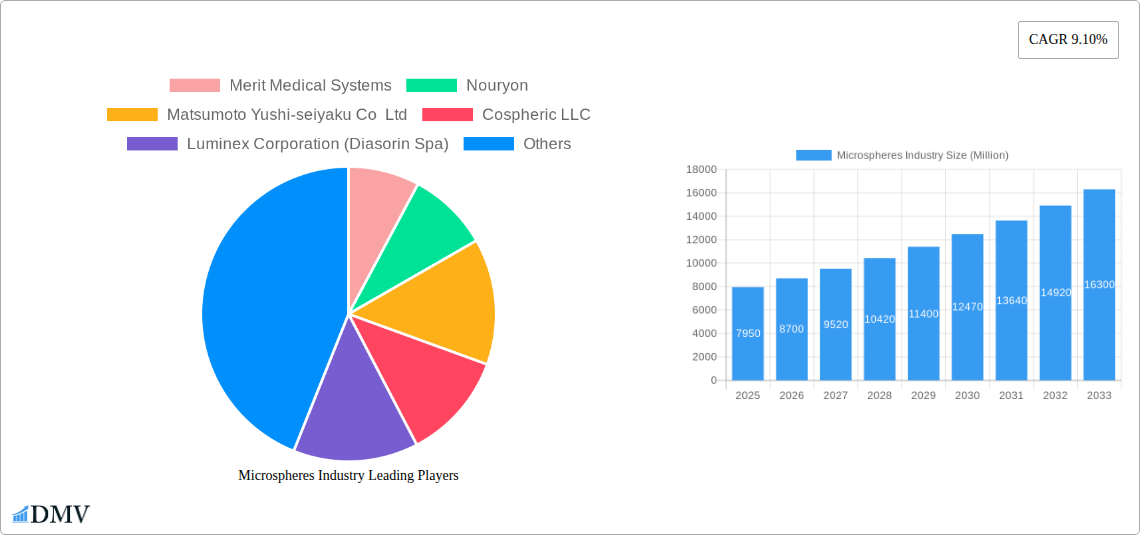
Microspheres Industry Market Size (In Billion)
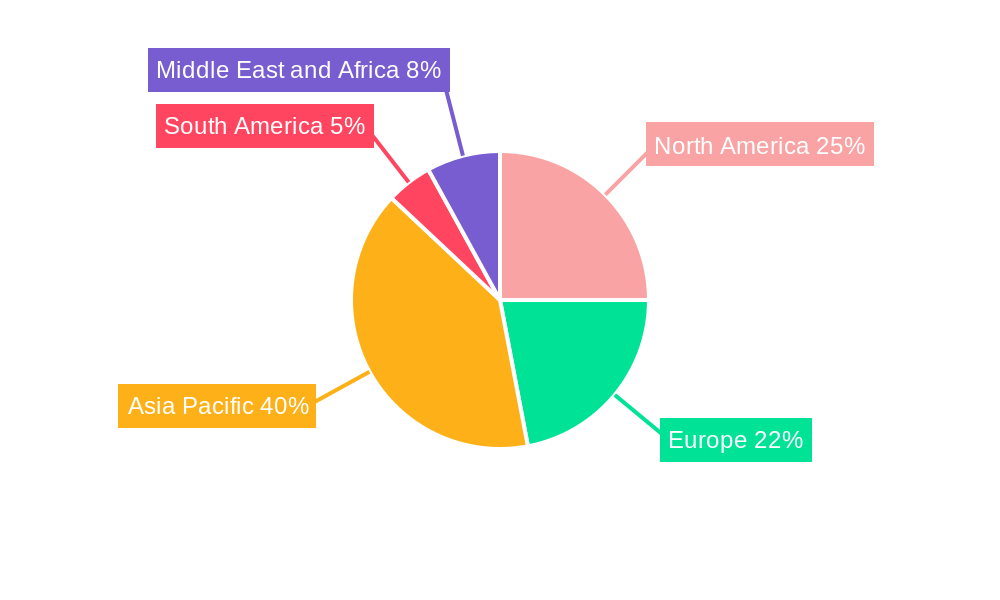
The market segmentation reveals a diverse landscape. Raw material composition (glass, polymer, ceramic, fly ash, metallic) significantly impacts microsphere properties and applications. Hollow and solid microspheres cater to distinct needs, influencing their usage in various applications. Automotive and aerospace industries are major consumers, leveraging microspheres for lightweighting and enhanced performance. The medical technology sector presents substantial growth potential due to the increasing use of microspheres in drug delivery and diagnostic tools. Regionally, Asia Pacific, particularly China and India, are expected to dominate the market due to rapid industrialization and increasing demand from various end-use industries. North America and Europe also maintain significant market shares, fueled by technological advancements and established industrial bases. Companies like 3M, Merit Medical Systems, and others are leading players, driving innovation and expanding market penetration through strategic partnerships and product diversification. The forecast period (2025-2033) promises continued growth, driven by these factors and further technological innovations in microsphere manufacturing and application.

Microspheres Industry Company Market Share
Microspheres Industry Market Report: 2019-2033
This comprehensive report provides an in-depth analysis of the global microspheres market, offering invaluable insights for stakeholders seeking to navigate this dynamic landscape. The study period spans from 2019 to 2033, with 2025 serving as the base and estimated year. The forecast period covers 2025-2033, and the historical period encompasses 2019-2024. The report projects a market value exceeding xx Million by 2033.
Microspheres Industry Market Composition & Trends
This section delves into the competitive dynamics of the microspheres market, examining market concentration, innovation drivers, regulatory influences, substitute products, end-user profiles, and mergers & acquisitions (M&A) activities. The market is characterized by a moderately concentrated landscape, with key players such as 3M, Nouryon, and Momentive holding significant market share. However, several smaller, specialized companies also contribute significantly to niche segments. The xx Million market displays a complex competitive landscape shaped by innovation.
- Market Share Distribution: 3M holds an estimated xx% market share, followed by Nouryon at xx% and Momentive at xx%. The remaining share is distributed among numerous smaller players.
- Innovation Catalysts: Ongoing research into novel material compositions (e.g., advanced polymers and ceramics) and surface modifications are driving innovation. Furthermore, the demand for lighter, stronger, and more functional microspheres fuels continuous improvement in manufacturing processes.
- Regulatory Landscape: Regulations concerning material safety and environmental impact vary across different applications and geographies. Compliance requirements influence production costs and market access.
- Substitute Products: Depending on the specific application, microspheres face competition from alternative materials such as expanded polystyrene, aerogel, and other lightweight fillers.
- End-User Profiles: Key end-users include the automotive, aerospace, medical technology, and construction industries. The report provides detailed analysis of each sector's microsphere consumption patterns.
- M&A Activities: The last five years have witnessed xx M&A deals in the microspheres industry, with an aggregate value of approximately xx Million. These activities reflect industry consolidation and expansion strategies.
Microspheres Industry Evolution
The global microspheres market has experienced significant growth over the past five years, driven primarily by the increasing demand across various end-use industries. Technological advancements have facilitated the development of high-performance microspheres with enhanced properties such as improved strength, reduced density, and tailored surface functionalities. Shifting consumer preferences towards lightweight, high-performance products are also fueling market expansion. The market is expected to experience a compound annual growth rate (CAGR) of xx% during the forecast period, reaching a projected value of xx Million by 2033. The adoption rate of advanced microspheres in niche applications, such as targeted drug delivery and advanced composites, is rising steadily.
Leading Regions, Countries, or Segments in Microspheres Industry
The North American region currently dominates the global microspheres market, driven by robust demand from the automotive and aerospace sectors, along with significant investments in research and development. Within this region, the United States represents the largest national market.
- Raw Material: Glass microspheres currently hold the largest market share due to their cost-effectiveness and versatile properties, followed by polymer-based microspheres.
- Type: Hollow microspheres are more widely used due to their lower density and improved insulation properties compared to solid microspheres.
- Application: The automotive industry leads in microsphere consumption, followed by the aerospace and medical technology sectors.
Key Drivers:
- High Investment in R&D: Significant investments in research and development are leading to the creation of innovative microspheres with improved properties.
- Government Support: Government incentives for lightweighting initiatives in the automotive and aerospace sectors drive demand for microspheres.
- Technological Advancements: Advances in manufacturing processes have enabled the production of microspheres with enhanced properties and improved cost-effectiveness.
Microspheres Industry Product Innovations
Recent years have witnessed significant innovations in microsphere technology, including the development of microspheres with enhanced surface functionality for improved adhesion, compatibility, and controlled release applications. The emergence of biocompatible and biodegradable microspheres is expanding applications in the biomedical field. These innovations enhance performance metrics such as strength-to-weight ratio, thermal insulation capacity, and controlled drug release efficiency. Unique selling propositions often include specialized surface coatings, precise size and morphology control, and tailored material properties catering to specific application needs.
Propelling Factors for Microspheres Industry Growth
Several factors are driving the growth of the microspheres market:
- Lightweighting Initiatives: Increasing demand for lightweight materials in the automotive and aerospace industries is a major driver.
- Enhanced Material Properties: Microspheres offer superior properties such as high strength, low density, and excellent insulation, leading to their adoption in diverse applications.
- Technological Advancements: Continuous innovation in microsphere manufacturing processes and materials improves performance and cost-effectiveness.
Obstacles in the Microspheres Industry Market
The microspheres market faces challenges including:
- Fluctuating Raw Material Prices: Prices of raw materials like glass, polymers, and ceramics can impact profitability.
- Supply Chain Disruptions: Global supply chain disruptions can affect the availability of raw materials and finished products.
- Intense Competition: The market is characterized by a mix of large established companies and smaller specialized players, resulting in intense competition.
Future Opportunities in Microspheres Industry
Significant opportunities exist in:
- Expanding Applications: Exploring new applications in emerging industries like renewable energy and 3D printing.
- Advanced Material Development: Developing microspheres with even more enhanced properties to meet increasingly demanding applications.
- Customization and Tailoring: Offering customized microsphere solutions with tailored properties to meet specific customer requirements.
Major Players in the Microspheres Industry Ecosystem
- Merit Medical Systems
- Nouryon
- Matsumoto Yushi-seiyaku Co Ltd
- Cospheric LLC
- Luminex Corporation (Diasorin Spa)
- Bangs Laboratories Inc
- 3M
- Chase Corporation
- Momentive
- Potters Industries LLC
- Siemens Healthineers AG
- Mo-sci Corporation (Heraeus Holdings)
- Kureha Corporation
- Trelleborg AB
Key Developments in Microspheres Industry Industry
- June 2022: Nouryon launched expancel HP92 microspheres for automotive underbody coatings.
- February 2022: 3M's glass bubbles used for NASA's liquid hydrogen storage tank insulation.
- 2021: 3M began supplying glass bubbles to NASA for the tank project.
Strategic Microspheres Industry Market Forecast
The microspheres market is poised for substantial growth, driven by ongoing technological advancements, increasing demand from diverse industries, and the emergence of new applications. The market's expansion will be fueled by a combination of factors including lightweighting initiatives, improved material properties, and increasing adoption of customized microsphere solutions. The forecast period anticipates consistent growth, with market leaders expected to consolidate their positions while smaller players focus on niche markets and product innovation.
Microspheres Industry Segmentation
-
1. Raw Material
- 1.1. Glass
- 1.2. Polymer
- 1.3. Ceramic
- 1.4. Fly Ash
- 1.5. Metallic
- 1.6. Other Raw Materials
-
2. Type
- 2.1. Hollow
- 2.2. Soild
-
3. Application
- 3.1. Automotive
- 3.2. Aerospace
- 3.3. Cosmetics
- 3.4. Oil and Gas
- 3.5. Paints and Coatings
- 3.6. Medical Technology
- 3.7. Composites
- 3.8. Other Applications
Microspheres Industry Segmentation By Geography
-
1. Asia Pacific
- 1.1. China
- 1.2. India
- 1.3. Japan
- 1.4. South Korea
- 1.5. Rest of Asia Pacific
-
2. North America
- 2.1. United States
- 2.2. Canada
- 2.3. Mexico
-
3. Europe
- 3.1. Germany
- 3.2. United Kingdom
- 3.3. Italy
- 3.4. France
- 3.5. Rest of Europe
-
4. South America
- 4.1. Brazil
- 4.2. Argentina
- 4.3. Rest of South America
-
5. Middle East and Africa
- 5.1. Saudi Arabia
- 5.2. South Africa
- 5.3. Rest of Middle East and Africa
Microspheres Industry Regional Market Share
Geographic Coverage of Microspheres Industry
Microspheres Industry REPORT HIGHLIGHTS
| Aspects | Details |
|---|---|
| Study Period | 2020-2034 |
| Base Year | 2025 |
| Estimated Year | 2026 |
| Forecast Period | 2026-2034 |
| Historical Period | 2020-2025 |
| Growth Rate | CAGR of 9.10% from 2020-2034 |
| Segmentation |
|
Table of Contents
- 1. Introduction
- 1.1. Research Scope
- 1.2. Market Segmentation
- 1.3. Research Objective
- 1.4. Definitions and Assumptions
- 2. Executive Summary
- 2.1. Market Snapshot
- 3. Market Dynamics
- 3.1. Market Drivers
- 3.2. Market Restrains
- 3.3. Market Trends
- 3.4. Market Opportunities
- 4. Market Factor Analysis
- 4.1. Porters Five Forces
- 4.1.1. Bargaining Power of Suppliers
- 4.1.2. Bargaining Power of Buyers
- 4.1.3. Threat of New Entrants
- 4.1.4. Threat of Substitutes
- 4.1.5. Competitive Rivalry
- 4.2. PESTEL analysis
- 4.3. BCG Analysis
- 4.3.1. Stars (High Growth, High Market Share)
- 4.3.2. Cash Cows (Low Growth, High Market Share)
- 4.3.3. Question Mark (High Growth, Low Market Share)
- 4.3.4. Dogs (Low Growth, Low Market Share)
- 4.4. Ansoff Matrix Analysis
- 4.5. Supply Chain Analysis
- 4.6. Regulatory Landscape
- 4.7. Current Market Potential and Opportunity Assessment (TAM–SAM–SOM Framework)
- 4.8. DMV Analyst Note
- 4.1. Porters Five Forces
- 5. Market Analysis, Insights and Forecast 2021-2033
- 5.1. Market Analysis, Insights and Forecast - by Raw Material
- 5.1.1. Glass
- 5.1.2. Polymer
- 5.1.3. Ceramic
- 5.1.4. Fly Ash
- 5.1.5. Metallic
- 5.1.6. Other Raw Materials
- 5.2. Market Analysis, Insights and Forecast - by Type
- 5.2.1. Hollow
- 5.2.2. Soild
- 5.3. Market Analysis, Insights and Forecast - by Application
- 5.3.1. Automotive
- 5.3.2. Aerospace
- 5.3.3. Cosmetics
- 5.3.4. Oil and Gas
- 5.3.5. Paints and Coatings
- 5.3.6. Medical Technology
- 5.3.7. Composites
- 5.3.8. Other Applications
- 5.4. Market Analysis, Insights and Forecast - by Region
- 5.4.1. Asia Pacific
- 5.4.2. North America
- 5.4.3. Europe
- 5.4.4. South America
- 5.4.5. Middle East and Africa
- 5.1. Market Analysis, Insights and Forecast - by Raw Material
- 6. Global Microspheres Industry Analysis, Insights and Forecast, 2021-2033
- 6.1. Market Analysis, Insights and Forecast - by Raw Material
- 6.1.1. Glass
- 6.1.2. Polymer
- 6.1.3. Ceramic
- 6.1.4. Fly Ash
- 6.1.5. Metallic
- 6.1.6. Other Raw Materials
- 6.2. Market Analysis, Insights and Forecast - by Type
- 6.2.1. Hollow
- 6.2.2. Soild
- 6.3. Market Analysis, Insights and Forecast - by Application
- 6.3.1. Automotive
- 6.3.2. Aerospace
- 6.3.3. Cosmetics
- 6.3.4. Oil and Gas
- 6.3.5. Paints and Coatings
- 6.3.6. Medical Technology
- 6.3.7. Composites
- 6.3.8. Other Applications
- 6.1. Market Analysis, Insights and Forecast - by Raw Material
- 7. Asia Pacific Microspheres Industry Analysis, Insights and Forecast, 2020-2032
- 7.1. Market Analysis, Insights and Forecast - by Raw Material
- 7.1.1. Glass
- 7.1.2. Polymer
- 7.1.3. Ceramic
- 7.1.4. Fly Ash
- 7.1.5. Metallic
- 7.1.6. Other Raw Materials
- 7.2. Market Analysis, Insights and Forecast - by Type
- 7.2.1. Hollow
- 7.2.2. Soild
- 7.3. Market Analysis, Insights and Forecast - by Application
- 7.3.1. Automotive
- 7.3.2. Aerospace
- 7.3.3. Cosmetics
- 7.3.4. Oil and Gas
- 7.3.5. Paints and Coatings
- 7.3.6. Medical Technology
- 7.3.7. Composites
- 7.3.8. Other Applications
- 7.1. Market Analysis, Insights and Forecast - by Raw Material
- 8. North America Microspheres Industry Analysis, Insights and Forecast, 2020-2032
- 8.1. Market Analysis, Insights and Forecast - by Raw Material
- 8.1.1. Glass
- 8.1.2. Polymer
- 8.1.3. Ceramic
- 8.1.4. Fly Ash
- 8.1.5. Metallic
- 8.1.6. Other Raw Materials
- 8.2. Market Analysis, Insights and Forecast - by Type
- 8.2.1. Hollow
- 8.2.2. Soild
- 8.3. Market Analysis, Insights and Forecast - by Application
- 8.3.1. Automotive
- 8.3.2. Aerospace
- 8.3.3. Cosmetics
- 8.3.4. Oil and Gas
- 8.3.5. Paints and Coatings
- 8.3.6. Medical Technology
- 8.3.7. Composites
- 8.3.8. Other Applications
- 8.1. Market Analysis, Insights and Forecast - by Raw Material
- 9. Europe Microspheres Industry Analysis, Insights and Forecast, 2020-2032
- 9.1. Market Analysis, Insights and Forecast - by Raw Material
- 9.1.1. Glass
- 9.1.2. Polymer
- 9.1.3. Ceramic
- 9.1.4. Fly Ash
- 9.1.5. Metallic
- 9.1.6. Other Raw Materials
- 9.2. Market Analysis, Insights and Forecast - by Type
- 9.2.1. Hollow
- 9.2.2. Soild
- 9.3. Market Analysis, Insights and Forecast - by Application
- 9.3.1. Automotive
- 9.3.2. Aerospace
- 9.3.3. Cosmetics
- 9.3.4. Oil and Gas
- 9.3.5. Paints and Coatings
- 9.3.6. Medical Technology
- 9.3.7. Composites
- 9.3.8. Other Applications
- 9.1. Market Analysis, Insights and Forecast - by Raw Material
- 10. South America Microspheres Industry Analysis, Insights and Forecast, 2020-2032
- 10.1. Market Analysis, Insights and Forecast - by Raw Material
- 10.1.1. Glass
- 10.1.2. Polymer
- 10.1.3. Ceramic
- 10.1.4. Fly Ash
- 10.1.5. Metallic
- 10.1.6. Other Raw Materials
- 10.2. Market Analysis, Insights and Forecast - by Type
- 10.2.1. Hollow
- 10.2.2. Soild
- 10.3. Market Analysis, Insights and Forecast - by Application
- 10.3.1. Automotive
- 10.3.2. Aerospace
- 10.3.3. Cosmetics
- 10.3.4. Oil and Gas
- 10.3.5. Paints and Coatings
- 10.3.6. Medical Technology
- 10.3.7. Composites
- 10.3.8. Other Applications
- 10.1. Market Analysis, Insights and Forecast - by Raw Material
- 11. Middle East and Africa Microspheres Industry Analysis, Insights and Forecast, 2020-2032
- 11.1. Market Analysis, Insights and Forecast - by Raw Material
- 11.1.1. Glass
- 11.1.2. Polymer
- 11.1.3. Ceramic
- 11.1.4. Fly Ash
- 11.1.5. Metallic
- 11.1.6. Other Raw Materials
- 11.2. Market Analysis, Insights and Forecast - by Type
- 11.2.1. Hollow
- 11.2.2. Soild
- 11.3. Market Analysis, Insights and Forecast - by Application
- 11.3.1. Automotive
- 11.3.2. Aerospace
- 11.3.3. Cosmetics
- 11.3.4. Oil and Gas
- 11.3.5. Paints and Coatings
- 11.3.6. Medical Technology
- 11.3.7. Composites
- 11.3.8. Other Applications
- 11.1. Market Analysis, Insights and Forecast - by Raw Material
- 12. Competitive Analysis
- 12.1. Company Profiles
- 12.1.1 Merit Medical Systems
- 12.1.1.1. Company Overview
- 12.1.1.2. Products
- 12.1.1.3. Company Financials
- 12.1.1.4. SWOT Analysis
- 12.1.2 Nouryon
- 12.1.2.1. Company Overview
- 12.1.2.2. Products
- 12.1.2.3. Company Financials
- 12.1.2.4. SWOT Analysis
- 12.1.3 Matsumoto Yushi-seiyaku Co Ltd
- 12.1.3.1. Company Overview
- 12.1.3.2. Products
- 12.1.3.3. Company Financials
- 12.1.3.4. SWOT Analysis
- 12.1.4 Cospheric LLC
- 12.1.4.1. Company Overview
- 12.1.4.2. Products
- 12.1.4.3. Company Financials
- 12.1.4.4. SWOT Analysis
- 12.1.5 Luminex Corporation (Diasorin Spa)
- 12.1.5.1. Company Overview
- 12.1.5.2. Products
- 12.1.5.3. Company Financials
- 12.1.5.4. SWOT Analysis
- 12.1.6 Bangs Laboratories Inc
- 12.1.6.1. Company Overview
- 12.1.6.2. Products
- 12.1.6.3. Company Financials
- 12.1.6.4. SWOT Analysis
- 12.1.7 3M
- 12.1.7.1. Company Overview
- 12.1.7.2. Products
- 12.1.7.3. Company Financials
- 12.1.7.4. SWOT Analysis
- 12.1.8 Chase Corporation
- 12.1.8.1. Company Overview
- 12.1.8.2. Products
- 12.1.8.3. Company Financials
- 12.1.8.4. SWOT Analysis
- 12.1.9 Momentive
- 12.1.9.1. Company Overview
- 12.1.9.2. Products
- 12.1.9.3. Company Financials
- 12.1.9.4. SWOT Analysis
- 12.1.10 Potters Industries LLC
- 12.1.10.1. Company Overview
- 12.1.10.2. Products
- 12.1.10.3. Company Financials
- 12.1.10.4. SWOT Analysis
- 12.1.11 Siemens Healthineers AG
- 12.1.11.1. Company Overview
- 12.1.11.2. Products
- 12.1.11.3. Company Financials
- 12.1.11.4. SWOT Analysis
- 12.1.12 Mo-sci Corporation (Heraeus Holdings)
- 12.1.12.1. Company Overview
- 12.1.12.2. Products
- 12.1.12.3. Company Financials
- 12.1.12.4. SWOT Analysis
- 12.1.13 Kureha Corporation
- 12.1.13.1. Company Overview
- 12.1.13.2. Products
- 12.1.13.3. Company Financials
- 12.1.13.4. SWOT Analysis
- 12.1.14 Trelleborg AB*List Not Exhaustive
- 12.1.14.1. Company Overview
- 12.1.14.2. Products
- 12.1.14.3. Company Financials
- 12.1.14.4. SWOT Analysis
- 12.1.1 Merit Medical Systems
- 12.2. Market Entropy
- 12.2.1 Company's Key Areas Served
- 12.2.2 Recent Developments
- 12.3. Company Market Share Analysis 2025
- 12.3.1 Top 5 Companies Market Share Analysis
- 12.3.2 Top 3 Companies Market Share Analysis
- 12.4. List of Potential Customers
- 13. Research Methodology
List of Figures
- Figure 1: Global Microspheres Industry Revenue Breakdown (Million, %) by Region 2025 & 2033
- Figure 2: Asia Pacific Microspheres Industry Revenue (Million), by Raw Material 2025 & 2033
- Figure 3: Asia Pacific Microspheres Industry Revenue Share (%), by Raw Material 2025 & 2033
- Figure 4: Asia Pacific Microspheres Industry Revenue (Million), by Type 2025 & 2033
- Figure 5: Asia Pacific Microspheres Industry Revenue Share (%), by Type 2025 & 2033
- Figure 6: Asia Pacific Microspheres Industry Revenue (Million), by Application 2025 & 2033
- Figure 7: Asia Pacific Microspheres Industry Revenue Share (%), by Application 2025 & 2033
- Figure 8: Asia Pacific Microspheres Industry Revenue (Million), by Country 2025 & 2033
- Figure 9: Asia Pacific Microspheres Industry Revenue Share (%), by Country 2025 & 2033
- Figure 10: North America Microspheres Industry Revenue (Million), by Raw Material 2025 & 2033
- Figure 11: North America Microspheres Industry Revenue Share (%), by Raw Material 2025 & 2033
- Figure 12: North America Microspheres Industry Revenue (Million), by Type 2025 & 2033
- Figure 13: North America Microspheres Industry Revenue Share (%), by Type 2025 & 2033
- Figure 14: North America Microspheres Industry Revenue (Million), by Application 2025 & 2033
- Figure 15: North America Microspheres Industry Revenue Share (%), by Application 2025 & 2033
- Figure 16: North America Microspheres Industry Revenue (Million), by Country 2025 & 2033
- Figure 17: North America Microspheres Industry Revenue Share (%), by Country 2025 & 2033
- Figure 18: Europe Microspheres Industry Revenue (Million), by Raw Material 2025 & 2033
- Figure 19: Europe Microspheres Industry Revenue Share (%), by Raw Material 2025 & 2033
- Figure 20: Europe Microspheres Industry Revenue (Million), by Type 2025 & 2033
- Figure 21: Europe Microspheres Industry Revenue Share (%), by Type 2025 & 2033
- Figure 22: Europe Microspheres Industry Revenue (Million), by Application 2025 & 2033
- Figure 23: Europe Microspheres Industry Revenue Share (%), by Application 2025 & 2033
- Figure 24: Europe Microspheres Industry Revenue (Million), by Country 2025 & 2033
- Figure 25: Europe Microspheres Industry Revenue Share (%), by Country 2025 & 2033
- Figure 26: South America Microspheres Industry Revenue (Million), by Raw Material 2025 & 2033
- Figure 27: South America Microspheres Industry Revenue Share (%), by Raw Material 2025 & 2033
- Figure 28: South America Microspheres Industry Revenue (Million), by Type 2025 & 2033
- Figure 29: South America Microspheres Industry Revenue Share (%), by Type 2025 & 2033
- Figure 30: South America Microspheres Industry Revenue (Million), by Application 2025 & 2033
- Figure 31: South America Microspheres Industry Revenue Share (%), by Application 2025 & 2033
- Figure 32: South America Microspheres Industry Revenue (Million), by Country 2025 & 2033
- Figure 33: South America Microspheres Industry Revenue Share (%), by Country 2025 & 2033
- Figure 34: Middle East and Africa Microspheres Industry Revenue (Million), by Raw Material 2025 & 2033
- Figure 35: Middle East and Africa Microspheres Industry Revenue Share (%), by Raw Material 2025 & 2033
- Figure 36: Middle East and Africa Microspheres Industry Revenue (Million), by Type 2025 & 2033
- Figure 37: Middle East and Africa Microspheres Industry Revenue Share (%), by Type 2025 & 2033
- Figure 38: Middle East and Africa Microspheres Industry Revenue (Million), by Application 2025 & 2033
- Figure 39: Middle East and Africa Microspheres Industry Revenue Share (%), by Application 2025 & 2033
- Figure 40: Middle East and Africa Microspheres Industry Revenue (Million), by Country 2025 & 2033
- Figure 41: Middle East and Africa Microspheres Industry Revenue Share (%), by Country 2025 & 2033
List of Tables
- Table 1: Global Microspheres Industry Revenue Million Forecast, by Raw Material 2020 & 2033
- Table 2: Global Microspheres Industry Revenue Million Forecast, by Type 2020 & 2033
- Table 3: Global Microspheres Industry Revenue Million Forecast, by Application 2020 & 2033
- Table 4: Global Microspheres Industry Revenue Million Forecast, by Region 2020 & 2033
- Table 5: Global Microspheres Industry Revenue Million Forecast, by Raw Material 2020 & 2033
- Table 6: Global Microspheres Industry Revenue Million Forecast, by Type 2020 & 2033
- Table 7: Global Microspheres Industry Revenue Million Forecast, by Application 2020 & 2033
- Table 8: Global Microspheres Industry Revenue Million Forecast, by Country 2020 & 2033
- Table 9: China Microspheres Industry Revenue (Million) Forecast, by Application 2020 & 2033
- Table 10: India Microspheres Industry Revenue (Million) Forecast, by Application 2020 & 2033
- Table 11: Japan Microspheres Industry Revenue (Million) Forecast, by Application 2020 & 2033
- Table 12: South Korea Microspheres Industry Revenue (Million) Forecast, by Application 2020 & 2033
- Table 13: Rest of Asia Pacific Microspheres Industry Revenue (Million) Forecast, by Application 2020 & 2033
- Table 14: Global Microspheres Industry Revenue Million Forecast, by Raw Material 2020 & 2033
- Table 15: Global Microspheres Industry Revenue Million Forecast, by Type 2020 & 2033
- Table 16: Global Microspheres Industry Revenue Million Forecast, by Application 2020 & 2033
- Table 17: Global Microspheres Industry Revenue Million Forecast, by Country 2020 & 2033
- Table 18: United States Microspheres Industry Revenue (Million) Forecast, by Application 2020 & 2033
- Table 19: Canada Microspheres Industry Revenue (Million) Forecast, by Application 2020 & 2033
- Table 20: Mexico Microspheres Industry Revenue (Million) Forecast, by Application 2020 & 2033
- Table 21: Global Microspheres Industry Revenue Million Forecast, by Raw Material 2020 & 2033
- Table 22: Global Microspheres Industry Revenue Million Forecast, by Type 2020 & 2033
- Table 23: Global Microspheres Industry Revenue Million Forecast, by Application 2020 & 2033
- Table 24: Global Microspheres Industry Revenue Million Forecast, by Country 2020 & 2033
- Table 25: Germany Microspheres Industry Revenue (Million) Forecast, by Application 2020 & 2033
- Table 26: United Kingdom Microspheres Industry Revenue (Million) Forecast, by Application 2020 & 2033
- Table 27: Italy Microspheres Industry Revenue (Million) Forecast, by Application 2020 & 2033
- Table 28: France Microspheres Industry Revenue (Million) Forecast, by Application 2020 & 2033
- Table 29: Rest of Europe Microspheres Industry Revenue (Million) Forecast, by Application 2020 & 2033
- Table 30: Global Microspheres Industry Revenue Million Forecast, by Raw Material 2020 & 2033
- Table 31: Global Microspheres Industry Revenue Million Forecast, by Type 2020 & 2033
- Table 32: Global Microspheres Industry Revenue Million Forecast, by Application 2020 & 2033
- Table 33: Global Microspheres Industry Revenue Million Forecast, by Country 2020 & 2033
- Table 34: Brazil Microspheres Industry Revenue (Million) Forecast, by Application 2020 & 2033
- Table 35: Argentina Microspheres Industry Revenue (Million) Forecast, by Application 2020 & 2033
- Table 36: Rest of South America Microspheres Industry Revenue (Million) Forecast, by Application 2020 & 2033
- Table 37: Global Microspheres Industry Revenue Million Forecast, by Raw Material 2020 & 2033
- Table 38: Global Microspheres Industry Revenue Million Forecast, by Type 2020 & 2033
- Table 39: Global Microspheres Industry Revenue Million Forecast, by Application 2020 & 2033
- Table 40: Global Microspheres Industry Revenue Million Forecast, by Country 2020 & 2033
- Table 41: Saudi Arabia Microspheres Industry Revenue (Million) Forecast, by Application 2020 & 2033
- Table 42: South Africa Microspheres Industry Revenue (Million) Forecast, by Application 2020 & 2033
- Table 43: Rest of Middle East and Africa Microspheres Industry Revenue (Million) Forecast, by Application 2020 & 2033
Frequently Asked Questions
1. What is the projected Compound Annual Growth Rate (CAGR) of the Microspheres Industry?
The projected CAGR is approximately 9.10%.
2. Which companies are prominent players in the Microspheres Industry?
Key companies in the market include Merit Medical Systems, Nouryon, Matsumoto Yushi-seiyaku Co Ltd, Cospheric LLC, Luminex Corporation (Diasorin Spa), Bangs Laboratories Inc, 3M, Chase Corporation, Momentive, Potters Industries LLC, Siemens Healthineers AG, Mo-sci Corporation (Heraeus Holdings), Kureha Corporation, Trelleborg AB*List Not Exhaustive.
3. What are the main segments of the Microspheres Industry?
The market segments include Raw Material, Type, Application.
4. Can you provide details about the market size?
The market size is estimated to be USD 7.95 Million as of 2022.
5. What are some drivers contributing to market growth?
Increasing Application and Advancements in Medical Industry; Increasing Demand from Cosmetics Industry.
6. What are the notable trends driving market growth?
Increasing Usage in the Medical Technology.
7. Are there any restraints impacting market growth?
High Production and Research and Development Cost.
8. Can you provide examples of recent developments in the market?
In June 2022, Nouryon introduced expancel HP92 microspheres to reduce weight and withstand high pressure in underbody coatings and sealants for the automotive industry. These microspheres are currently produced in Stockvik, Sweden, with production expected in Green Bay, Wisconsin, the United States, in early 2023.
9. What pricing options are available for accessing the report?
Pricing options include single-user, multi-user, and enterprise licenses priced at USD 4750, USD 5250, and USD 8750 respectively.
10. Is the market size provided in terms of value or volume?
The market size is provided in terms of value, measured in Million.
11. Are there any specific market keywords associated with the report?
Yes, the market keyword associated with the report is "Microspheres Industry," which aids in identifying and referencing the specific market segment covered.
12. How do I determine which pricing option suits my needs best?
The pricing options vary based on user requirements and access needs. Individual users may opt for single-user licenses, while businesses requiring broader access may choose multi-user or enterprise licenses for cost-effective access to the report.
13. Are there any additional resources or data provided in the Microspheres Industry report?
While the report offers comprehensive insights, it's advisable to review the specific contents or supplementary materials provided to ascertain if additional resources or data are available.
14. How can I stay updated on further developments or reports in the Microspheres Industry?
To stay informed about further developments, trends, and reports in the Microspheres Industry, consider subscribing to industry newsletters, following relevant companies and organizations, or regularly checking reputable industry news sources and publications.
Methodology
Step 1 - Identification of Relevant Samples Size from Population Database


Step 2 - Approaches for Defining Global Market Size (Value, Volume* & Price*)

Note*: In applicable scenarios
Step 3 - Data Sources
Primary Research
- Web Analytics
- Survey Reports
- Research Institute
- Latest Research Reports
- Opinion Leaders
Secondary Research
- Annual Reports
- White Paper
- Latest Press Release
- Industry Association
- Paid Database
- Investor Presentations

Step 4 - Data Triangulation
Involves using different sources of information in order to increase the validity of a study
These sources are likely to be stakeholders in a program - participants, other researchers, program staff, other community members, and so on.
Then we put all data in single framework & apply various statistical tools to find out the dynamic on the market.
During the analysis stage, feedback from the stakeholder groups would be compared to determine areas of agreement as well as areas of divergence