

Key Insights
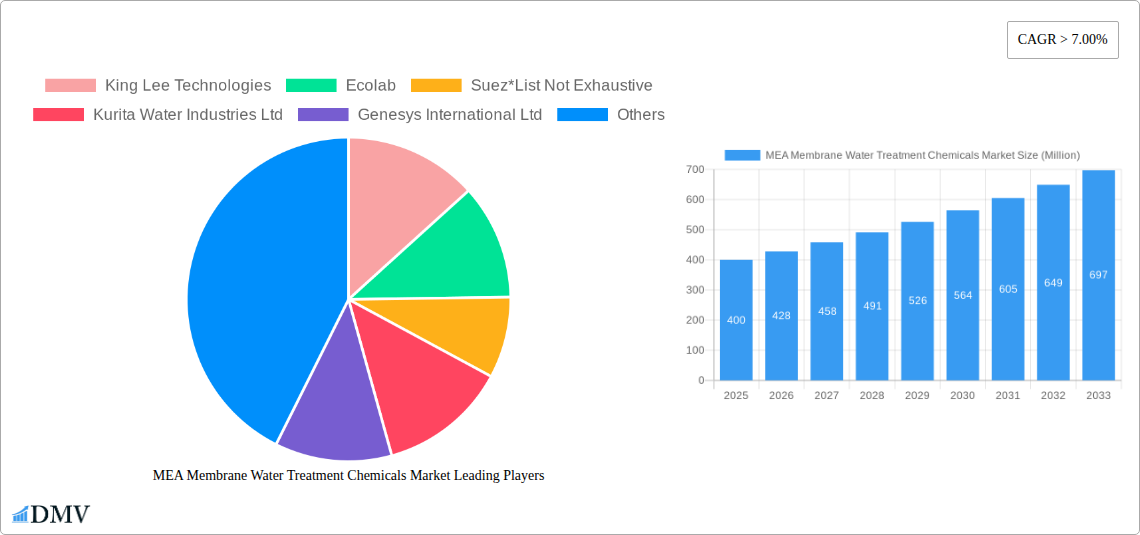
The MEA Membrane Water Treatment Chemicals market is poised for substantial expansion, driven by escalating water scarcity, stringent environmental mandates, and the widespread adoption of advanced membrane technologies. The market is projected to grow at a Compound Annual Growth Rate (CAGR) of 6.1%, reaching an estimated market size of $2.4 billion by 2025. Key growth catalysts include the booming desalination sector in water-stressed nations such as the UAE and Saudi Arabia, alongside heightened demand for purified water across the food & beverage, healthcare, and power industries. Government-led water conservation and management initiatives further accelerate market expansion. Leading global players, including Ecolab, Suez, and Kurita, actively contribute to the region's market dynamics.
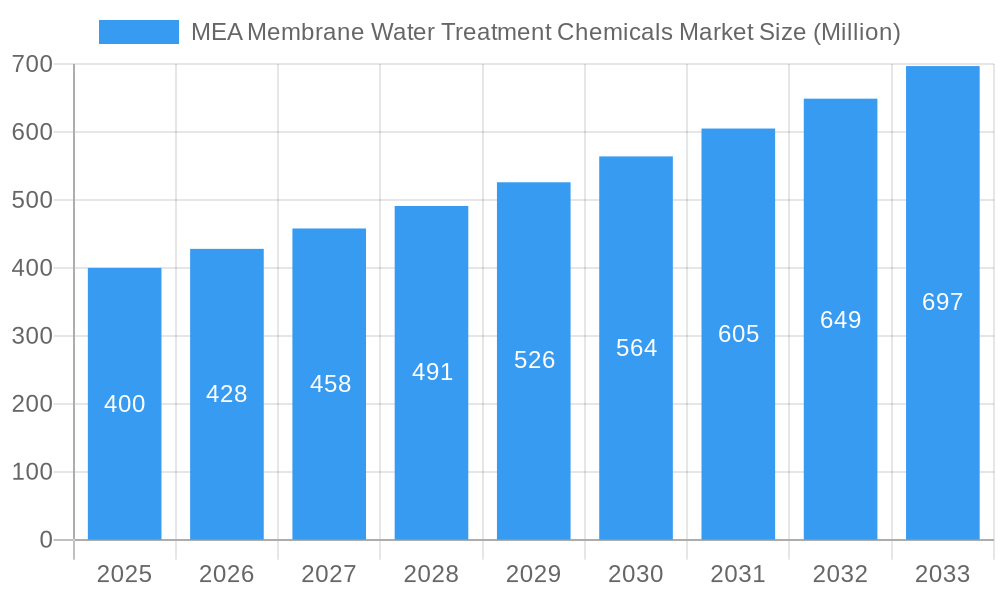
MEA Membrane Water Treatment Chemicals Market Market Size (In Billion)
Segmentation analysis indicates that pre-treatment chemicals will command a significant market share, essential for optimizing membrane efficiency and lifespan. The biological controllers segment is anticipated to experience robust growth, reflecting a growing preference for sustainable water treatment solutions. While desalination, power generation, and food & beverage processing are expected to remain the leading end-user sectors, all industries are projected to contribute to market growth. Potential challenges include volatile raw material costs and economic fluctuations. Nevertheless, the long-term outlook for the MEA Membrane Water Treatment Chemicals market remains optimistic, underpinned by the region's enduring demand for sophisticated and dependable water purification solutions.
MEA Membrane Water Treatment Chemicals Market Company Market Share
MEA Membrane Water Treatment Chemicals Market: A Comprehensive Report (2019-2033)
This insightful report provides a comprehensive analysis of the MEA Membrane Water Treatment Chemicals Market, offering a detailed overview of market trends, growth drivers, challenges, and future opportunities from 2019 to 2033. The study covers key segments including chemical types (pre-treatment, biological controllers, other chemical types) and end-user industries (food and beverage processing, desalination, healthcare, municipal, chemicals, power, other end-user industries), providing a granular understanding of market dynamics across the Middle East and Africa region. With a base year of 2025 and a forecast period extending to 2033, this report is an indispensable resource for stakeholders seeking to navigate this dynamic market. The market size is projected to reach xx Million by 2033.
MEA Membrane Water Treatment Chemicals Market Composition & Trends
This section delves into the competitive landscape, innovation drivers, and regulatory factors shaping the MEA Membrane Water Treatment Chemicals Market. We analyze market concentration, highlighting the leading players such as King Lee Technologies, Ecolab, Suez, Kurita Water Industries Ltd, Genesys International Ltd, Italmatch Chemicals SpA, Kemira, Dow, Solenis, AES Arabia Ltd, and Toray (list not exhaustive). The report assesses market share distribution among these key players and examines the impact of mergers and acquisitions (M&A) activities, including the significant USD 5.25 Billion acquisition of Solenis by Platinum Equity in 2021. This deal significantly reshaped the market landscape.
- Market Concentration: The MEA membrane water treatment chemicals market exhibits a [Describe level of concentration, e.g., moderately concentrated] market structure.
- Innovation Catalysts: Stringent environmental regulations and the increasing demand for water purification are driving innovation in chemical formulations and treatment technologies.
- Regulatory Landscape: Variations in regulations across MEA countries influence market dynamics and adoption rates of specific chemical types.
- Substitute Products: The market faces competition from alternative water treatment technologies, creating pressure on prices and requiring continuous innovation.
- End-User Profiles: Detailed analysis of each end-user industry's water treatment needs and chemical consumption patterns.
- M&A Activities: The report analyzes recent M&A activity, including the Solenis acquisition, evaluating its impact on market consolidation and competitive dynamics. Deal values are explored to understand the financial implications of these transactions.
MEA Membrane Water Treatment Chemicals Market Industry Evolution
This section provides a detailed analysis of the MEA membrane water treatment chemicals market's historical and projected growth trajectories. We examine technological advancements, shifting consumer preferences, and evolving market demands. Data points include specific growth rates for each segment over the study period (2019-2024 and 2025-2033), highlighting factors contributing to growth and adoption rates of various chemical types and treatment methods. The analysis considers the impact of technological progress on market size and segmentation. Factors like increasing urbanization, industrialization, and the rising awareness of water scarcity fuel market growth. The adoption of advanced membrane technologies and the development of more efficient and eco-friendly chemicals are key aspects of this evolution. Further detailed analysis is provided on the historical growth rate between 2019-2024 and forecasted growth rate between 2025-2033.
Leading Regions, Countries, or Segments in MEA Membrane Water Treatment Chemicals Market
This section identifies the dominant regions, countries, and market segments within the MEA region. The analysis considers factors like investment trends, regulatory support, and market size for each segment.
Dominant Segments:
- By Chemical Type: [Identify the dominant chemical type, e.g., Pre-treatment chemicals] holds the largest market share, driven by [explain reason, e.g., its widespread use in various applications].
- By End-User Industry: [Identify the dominant end-user industry, e.g., Desalination] is the leading end-user segment, due to [explain reason, e.g., the high concentration of desalination plants in the region].
Key Drivers (Bullet points for each dominant segment):
- High growth in population and industrialization leading to increased water demand.
- Stringent government regulations promoting water conservation and treatment.
- Significant investments in water infrastructure projects.
In-depth analysis: Paragraphs are included for each dominant segment providing a deeper understanding of the market drivers and the factors that determine its dominance.
MEA Membrane Water Treatment Chemicals Market Product Innovations
Recent years have witnessed significant advancements in membrane water treatment chemicals, including the development of more efficient and environmentally friendly formulations. These innovations address the need for improved performance, reduced costs, and minimized environmental impact. Examples include bio-based chemicals and advanced filtration technologies which offer improved removal of pollutants and extended lifespan for membrane systems. These innovations offer unique selling propositions such as enhanced cleaning efficiency, reduced chemical usage, and improved membrane performance, thereby driving market growth.
Propelling Factors for MEA Membrane Water Treatment Chemicals Market Growth
Several factors are driving the growth of the MEA membrane water treatment chemicals market. These include technological advancements, robust economic growth in certain countries in the region, and supportive government regulations focused on promoting water security and environmental sustainability. The increasing awareness of water scarcity and stringent environmental regulations in the region have pushed demand significantly for sophisticated and eco-friendly water treatment solutions.
Obstacles in the MEA Membrane Water Treatment Chemicals Market
The MEA membrane water treatment chemicals market faces several challenges, including inconsistent regulatory frameworks across different countries, volatility in raw material prices leading to supply chain disruptions, and the intense competition from established players and new entrants. Furthermore, fluctuations in global oil prices and the economic conditions impacting the region are creating uncertainties and affecting demand and investment. These factors result in significant price fluctuations and market uncertainty.
Future Opportunities in MEA Membrane Water Treatment Chemicals Market
Future growth opportunities exist in exploring new markets, adopting innovative technologies, and responding to evolving consumer preferences. This includes developing specialized chemicals for emerging applications, focusing on sustainable and eco-friendly solutions, and expanding into underserved regions. Investment in research and development of advanced membrane technologies and efficient chemical formulations promises substantial future growth potential.
Key Developments in MEA Membrane Water Treatment Chemicals Market Industry
- November 2021: Platinum Equity's acquisition of Solenis for USD 5.25 billion, significantly altering the market landscape through consolidation and expansion into new sectors. This acquisition created a larger, more globally integrated player in the industry, strengthening its overall market position and potentially influencing pricing and competitive strategies.
Strategic MEA Membrane Water Treatment Chemicals Market Forecast
The MEA membrane water treatment chemicals market is poised for robust growth over the forecast period (2025-2033), driven by increasing water scarcity, rising investments in water infrastructure, and the adoption of advanced membrane technologies. The market is expected to benefit from the continued growth of key end-user industries like desalination, as well as innovation in water treatment chemicals and technologies. These advancements will cater to the region's needs for sustainable and effective water management.
MEA Membrane Water Treatment Chemicals Market Segmentation
-
1. Chemical Type
- 1.1. Pre-treatment
- 1.2. Biological Controllers
- 1.3. Other Chemical Types
-
2. End-user Industry
- 2.1. Food and Beverage Processing
- 2.2. Desalination
- 2.3. Healthcare
- 2.4. Municipal
- 2.5. Chemicals
- 2.6. Power
- 2.7. Other End-user Industries
-
3. Geography
- 3.1. Saudi Arabia
- 3.2. South Africa
- 3.3. Qatar
- 3.4. United Arab Emirates
- 3.5. Egypt
- 3.6. Rest of Middle-East and Africa
MEA Membrane Water Treatment Chemicals Market Segmentation By Geography
- 1. Saudi Arabia
- 2. South Africa
- 3. Qatar
- 4. United Arab Emirates
- 5. Egypt
- 6. Rest of Middle East and Africa
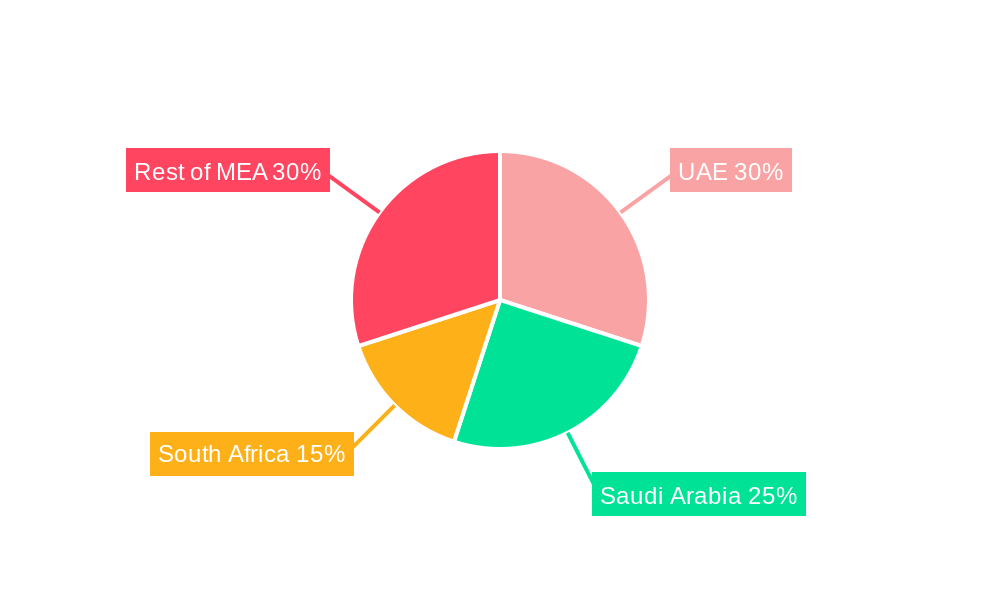
MEA Membrane Water Treatment Chemicals Market Regional Market Share
Geographic Coverage of MEA Membrane Water Treatment Chemicals Market
MEA Membrane Water Treatment Chemicals Market REPORT HIGHLIGHTS
| Aspects | Details |
|---|---|
| Study Period | 2020-2034 |
| Base Year | 2025 |
| Estimated Year | 2026 |
| Forecast Period | 2026-2034 |
| Historical Period | 2020-2025 |
| Growth Rate | CAGR of 6.1% from 2020-2034 |
| Segmentation |
|
Table of Contents
- 1. Introduction
- 1.1. Research Scope
- 1.2. Market Segmentation
- 1.3. Research Objective
- 1.4. Definitions and Assumptions
- 2. Executive Summary
- 2.1. Market Snapshot
- 3. Market Dynamics
- 3.1. Market Drivers
- 3.2. Market Restrains
- 3.3. Market Trends
- 3.4. Market Opportunities
- 4. Market Factor Analysis
- 4.1. Porters Five Forces
- 4.1.1. Bargaining Power of Suppliers
- 4.1.2. Bargaining Power of Buyers
- 4.1.3. Threat of New Entrants
- 4.1.4. Threat of Substitutes
- 4.1.5. Competitive Rivalry
- 4.2. PESTEL analysis
- 4.3. BCG Analysis
- 4.3.1. Stars (High Growth, High Market Share)
- 4.3.2. Cash Cows (Low Growth, High Market Share)
- 4.3.3. Question Mark (High Growth, Low Market Share)
- 4.3.4. Dogs (Low Growth, Low Market Share)
- 4.4. Ansoff Matrix Analysis
- 4.5. Supply Chain Analysis
- 4.6. Regulatory Landscape
- 4.7. Current Market Potential and Opportunity Assessment (TAM–SAM–SOM Framework)
- 4.8. DMV Analyst Note
- 4.1. Porters Five Forces
- 5. Market Analysis, Insights and Forecast 2021-2033
- 5.1. Market Analysis, Insights and Forecast - by Chemical Type
- 5.1.1. Pre-treatment
- 5.1.2. Biological Controllers
- 5.1.3. Other Chemical Types
- 5.2. Market Analysis, Insights and Forecast - by End-user Industry
- 5.2.1. Food and Beverage Processing
- 5.2.2. Desalination
- 5.2.3. Healthcare
- 5.2.4. Municipal
- 5.2.5. Chemicals
- 5.2.6. Power
- 5.2.7. Other End-user Industries
- 5.3. Market Analysis, Insights and Forecast - by Geography
- 5.3.1. Saudi Arabia
- 5.3.2. South Africa
- 5.3.3. Qatar
- 5.3.4. United Arab Emirates
- 5.3.5. Egypt
- 5.3.6. Rest of Middle-East and Africa
- 5.4. Market Analysis, Insights and Forecast - by Region
- 5.4.1. Saudi Arabia
- 5.4.2. South Africa
- 5.4.3. Qatar
- 5.4.4. United Arab Emirates
- 5.4.5. Egypt
- 5.4.6. Rest of Middle East and Africa
- 5.1. Market Analysis, Insights and Forecast - by Chemical Type
- 6. Global MEA Membrane Water Treatment Chemicals Market Analysis, Insights and Forecast, 2021-2033
- 6.1. Market Analysis, Insights and Forecast - by Chemical Type
- 6.1.1. Pre-treatment
- 6.1.2. Biological Controllers
- 6.1.3. Other Chemical Types
- 6.2. Market Analysis, Insights and Forecast - by End-user Industry
- 6.2.1. Food and Beverage Processing
- 6.2.2. Desalination
- 6.2.3. Healthcare
- 6.2.4. Municipal
- 6.2.5. Chemicals
- 6.2.6. Power
- 6.2.7. Other End-user Industries
- 6.3. Market Analysis, Insights and Forecast - by Geography
- 6.3.1. Saudi Arabia
- 6.3.2. South Africa
- 6.3.3. Qatar
- 6.3.4. United Arab Emirates
- 6.3.5. Egypt
- 6.3.6. Rest of Middle-East and Africa
- 6.1. Market Analysis, Insights and Forecast - by Chemical Type
- 7. Saudi Arabia MEA Membrane Water Treatment Chemicals Market Analysis, Insights and Forecast, 2020-2032
- 7.1. Market Analysis, Insights and Forecast - by Chemical Type
- 7.1.1. Pre-treatment
- 7.1.2. Biological Controllers
- 7.1.3. Other Chemical Types
- 7.2. Market Analysis, Insights and Forecast - by End-user Industry
- 7.2.1. Food and Beverage Processing
- 7.2.2. Desalination
- 7.2.3. Healthcare
- 7.2.4. Municipal
- 7.2.5. Chemicals
- 7.2.6. Power
- 7.2.7. Other End-user Industries
- 7.3. Market Analysis, Insights and Forecast - by Geography
- 7.3.1. Saudi Arabia
- 7.3.2. South Africa
- 7.3.3. Qatar
- 7.3.4. United Arab Emirates
- 7.3.5. Egypt
- 7.3.6. Rest of Middle-East and Africa
- 7.1. Market Analysis, Insights and Forecast - by Chemical Type
- 8. South Africa MEA Membrane Water Treatment Chemicals Market Analysis, Insights and Forecast, 2020-2032
- 8.1. Market Analysis, Insights and Forecast - by Chemical Type
- 8.1.1. Pre-treatment
- 8.1.2. Biological Controllers
- 8.1.3. Other Chemical Types
- 8.2. Market Analysis, Insights and Forecast - by End-user Industry
- 8.2.1. Food and Beverage Processing
- 8.2.2. Desalination
- 8.2.3. Healthcare
- 8.2.4. Municipal
- 8.2.5. Chemicals
- 8.2.6. Power
- 8.2.7. Other End-user Industries
- 8.3. Market Analysis, Insights and Forecast - by Geography
- 8.3.1. Saudi Arabia
- 8.3.2. South Africa
- 8.3.3. Qatar
- 8.3.4. United Arab Emirates
- 8.3.5. Egypt
- 8.3.6. Rest of Middle-East and Africa
- 8.1. Market Analysis, Insights and Forecast - by Chemical Type
- 9. Qatar MEA Membrane Water Treatment Chemicals Market Analysis, Insights and Forecast, 2020-2032
- 9.1. Market Analysis, Insights and Forecast - by Chemical Type
- 9.1.1. Pre-treatment
- 9.1.2. Biological Controllers
- 9.1.3. Other Chemical Types
- 9.2. Market Analysis, Insights and Forecast - by End-user Industry
- 9.2.1. Food and Beverage Processing
- 9.2.2. Desalination
- 9.2.3. Healthcare
- 9.2.4. Municipal
- 9.2.5. Chemicals
- 9.2.6. Power
- 9.2.7. Other End-user Industries
- 9.3. Market Analysis, Insights and Forecast - by Geography
- 9.3.1. Saudi Arabia
- 9.3.2. South Africa
- 9.3.3. Qatar
- 9.3.4. United Arab Emirates
- 9.3.5. Egypt
- 9.3.6. Rest of Middle-East and Africa
- 9.1. Market Analysis, Insights and Forecast - by Chemical Type
- 10. United Arab Emirates MEA Membrane Water Treatment Chemicals Market Analysis, Insights and Forecast, 2020-2032
- 10.1. Market Analysis, Insights and Forecast - by Chemical Type
- 10.1.1. Pre-treatment
- 10.1.2. Biological Controllers
- 10.1.3. Other Chemical Types
- 10.2. Market Analysis, Insights and Forecast - by End-user Industry
- 10.2.1. Food and Beverage Processing
- 10.2.2. Desalination
- 10.2.3. Healthcare
- 10.2.4. Municipal
- 10.2.5. Chemicals
- 10.2.6. Power
- 10.2.7. Other End-user Industries
- 10.3. Market Analysis, Insights and Forecast - by Geography
- 10.3.1. Saudi Arabia
- 10.3.2. South Africa
- 10.3.3. Qatar
- 10.3.4. United Arab Emirates
- 10.3.5. Egypt
- 10.3.6. Rest of Middle-East and Africa
- 10.1. Market Analysis, Insights and Forecast - by Chemical Type
- 11. Egypt MEA Membrane Water Treatment Chemicals Market Analysis, Insights and Forecast, 2020-2032
- 11.1. Market Analysis, Insights and Forecast - by Chemical Type
- 11.1.1. Pre-treatment
- 11.1.2. Biological Controllers
- 11.1.3. Other Chemical Types
- 11.2. Market Analysis, Insights and Forecast - by End-user Industry
- 11.2.1. Food and Beverage Processing
- 11.2.2. Desalination
- 11.2.3. Healthcare
- 11.2.4. Municipal
- 11.2.5. Chemicals
- 11.2.6. Power
- 11.2.7. Other End-user Industries
- 11.3. Market Analysis, Insights and Forecast - by Geography
- 11.3.1. Saudi Arabia
- 11.3.2. South Africa
- 11.3.3. Qatar
- 11.3.4. United Arab Emirates
- 11.3.5. Egypt
- 11.3.6. Rest of Middle-East and Africa
- 11.1. Market Analysis, Insights and Forecast - by Chemical Type
- 12. Rest of Middle East and Africa MEA Membrane Water Treatment Chemicals Market Analysis, Insights and Forecast, 2020-2032
- 12.1. Market Analysis, Insights and Forecast - by Chemical Type
- 12.1.1. Pre-treatment
- 12.1.2. Biological Controllers
- 12.1.3. Other Chemical Types
- 12.2. Market Analysis, Insights and Forecast - by End-user Industry
- 12.2.1. Food and Beverage Processing
- 12.2.2. Desalination
- 12.2.3. Healthcare
- 12.2.4. Municipal
- 12.2.5. Chemicals
- 12.2.6. Power
- 12.2.7. Other End-user Industries
- 12.3. Market Analysis, Insights and Forecast - by Geography
- 12.3.1. Saudi Arabia
- 12.3.2. South Africa
- 12.3.3. Qatar
- 12.3.4. United Arab Emirates
- 12.3.5. Egypt
- 12.3.6. Rest of Middle-East and Africa
- 12.1. Market Analysis, Insights and Forecast - by Chemical Type
- 13. Competitive Analysis
- 13.1. Company Profiles
- 13.1.1 King Lee Technologies
- 13.1.1.1. Company Overview
- 13.1.1.2. Products
- 13.1.1.3. Company Financials
- 13.1.1.4. SWOT Analysis
- 13.1.2 Ecolab
- 13.1.2.1. Company Overview
- 13.1.2.2. Products
- 13.1.2.3. Company Financials
- 13.1.2.4. SWOT Analysis
- 13.1.3 Suez*List Not Exhaustive
- 13.1.3.1. Company Overview
- 13.1.3.2. Products
- 13.1.3.3. Company Financials
- 13.1.3.4. SWOT Analysis
- 13.1.4 Kurita Water Industries Ltd
- 13.1.4.1. Company Overview
- 13.1.4.2. Products
- 13.1.4.3. Company Financials
- 13.1.4.4. SWOT Analysis
- 13.1.5 Genesys International Ltd
- 13.1.5.1. Company Overview
- 13.1.5.2. Products
- 13.1.5.3. Company Financials
- 13.1.5.4. SWOT Analysis
- 13.1.6 Italmatch Chemicals SpA
- 13.1.6.1. Company Overview
- 13.1.6.2. Products
- 13.1.6.3. Company Financials
- 13.1.6.4. SWOT Analysis
- 13.1.7 Kemira
- 13.1.7.1. Company Overview
- 13.1.7.2. Products
- 13.1.7.3. Company Financials
- 13.1.7.4. SWOT Analysis
- 13.1.8 Dow
- 13.1.8.1. Company Overview
- 13.1.8.2. Products
- 13.1.8.3. Company Financials
- 13.1.8.4. SWOT Analysis
- 13.1.9 Solenis
- 13.1.9.1. Company Overview
- 13.1.9.2. Products
- 13.1.9.3. Company Financials
- 13.1.9.4. SWOT Analysis
- 13.1.10 AES Arabia Ltd
- 13.1.10.1. Company Overview
- 13.1.10.2. Products
- 13.1.10.3. Company Financials
- 13.1.10.4. SWOT Analysis
- 13.1.11 Toray
- 13.1.11.1. Company Overview
- 13.1.11.2. Products
- 13.1.11.3. Company Financials
- 13.1.11.4. SWOT Analysis
- 13.1.1 King Lee Technologies
- 13.2. Market Entropy
- 13.2.1 Company's Key Areas Served
- 13.2.2 Recent Developments
- 13.3. Company Market Share Analysis 2025
- 13.3.1 Top 5 Companies Market Share Analysis
- 13.3.2 Top 3 Companies Market Share Analysis
- 13.4. List of Potential Customers
- 14. Research Methodology
List of Figures
- Figure 1: Global MEA Membrane Water Treatment Chemicals Market Revenue Breakdown (billion, %) by Region 2025 & 2033
- Figure 2: Saudi Arabia MEA Membrane Water Treatment Chemicals Market Revenue (billion), by Chemical Type 2025 & 2033
- Figure 3: Saudi Arabia MEA Membrane Water Treatment Chemicals Market Revenue Share (%), by Chemical Type 2025 & 2033
- Figure 4: Saudi Arabia MEA Membrane Water Treatment Chemicals Market Revenue (billion), by End-user Industry 2025 & 2033
- Figure 5: Saudi Arabia MEA Membrane Water Treatment Chemicals Market Revenue Share (%), by End-user Industry 2025 & 2033
- Figure 6: Saudi Arabia MEA Membrane Water Treatment Chemicals Market Revenue (billion), by Geography 2025 & 2033
- Figure 7: Saudi Arabia MEA Membrane Water Treatment Chemicals Market Revenue Share (%), by Geography 2025 & 2033
- Figure 8: Saudi Arabia MEA Membrane Water Treatment Chemicals Market Revenue (billion), by Country 2025 & 2033
- Figure 9: Saudi Arabia MEA Membrane Water Treatment Chemicals Market Revenue Share (%), by Country 2025 & 2033
- Figure 10: South Africa MEA Membrane Water Treatment Chemicals Market Revenue (billion), by Chemical Type 2025 & 2033
- Figure 11: South Africa MEA Membrane Water Treatment Chemicals Market Revenue Share (%), by Chemical Type 2025 & 2033
- Figure 12: South Africa MEA Membrane Water Treatment Chemicals Market Revenue (billion), by End-user Industry 2025 & 2033
- Figure 13: South Africa MEA Membrane Water Treatment Chemicals Market Revenue Share (%), by End-user Industry 2025 & 2033
- Figure 14: South Africa MEA Membrane Water Treatment Chemicals Market Revenue (billion), by Geography 2025 & 2033
- Figure 15: South Africa MEA Membrane Water Treatment Chemicals Market Revenue Share (%), by Geography 2025 & 2033
- Figure 16: South Africa MEA Membrane Water Treatment Chemicals Market Revenue (billion), by Country 2025 & 2033
- Figure 17: South Africa MEA Membrane Water Treatment Chemicals Market Revenue Share (%), by Country 2025 & 2033
- Figure 18: Qatar MEA Membrane Water Treatment Chemicals Market Revenue (billion), by Chemical Type 2025 & 2033
- Figure 19: Qatar MEA Membrane Water Treatment Chemicals Market Revenue Share (%), by Chemical Type 2025 & 2033
- Figure 20: Qatar MEA Membrane Water Treatment Chemicals Market Revenue (billion), by End-user Industry 2025 & 2033
- Figure 21: Qatar MEA Membrane Water Treatment Chemicals Market Revenue Share (%), by End-user Industry 2025 & 2033
- Figure 22: Qatar MEA Membrane Water Treatment Chemicals Market Revenue (billion), by Geography 2025 & 2033
- Figure 23: Qatar MEA Membrane Water Treatment Chemicals Market Revenue Share (%), by Geography 2025 & 2033
- Figure 24: Qatar MEA Membrane Water Treatment Chemicals Market Revenue (billion), by Country 2025 & 2033
- Figure 25: Qatar MEA Membrane Water Treatment Chemicals Market Revenue Share (%), by Country 2025 & 2033
- Figure 26: United Arab Emirates MEA Membrane Water Treatment Chemicals Market Revenue (billion), by Chemical Type 2025 & 2033
- Figure 27: United Arab Emirates MEA Membrane Water Treatment Chemicals Market Revenue Share (%), by Chemical Type 2025 & 2033
- Figure 28: United Arab Emirates MEA Membrane Water Treatment Chemicals Market Revenue (billion), by End-user Industry 2025 & 2033
- Figure 29: United Arab Emirates MEA Membrane Water Treatment Chemicals Market Revenue Share (%), by End-user Industry 2025 & 2033
- Figure 30: United Arab Emirates MEA Membrane Water Treatment Chemicals Market Revenue (billion), by Geography 2025 & 2033
- Figure 31: United Arab Emirates MEA Membrane Water Treatment Chemicals Market Revenue Share (%), by Geography 2025 & 2033
- Figure 32: United Arab Emirates MEA Membrane Water Treatment Chemicals Market Revenue (billion), by Country 2025 & 2033
- Figure 33: United Arab Emirates MEA Membrane Water Treatment Chemicals Market Revenue Share (%), by Country 2025 & 2033
- Figure 34: Egypt MEA Membrane Water Treatment Chemicals Market Revenue (billion), by Chemical Type 2025 & 2033
- Figure 35: Egypt MEA Membrane Water Treatment Chemicals Market Revenue Share (%), by Chemical Type 2025 & 2033
- Figure 36: Egypt MEA Membrane Water Treatment Chemicals Market Revenue (billion), by End-user Industry 2025 & 2033
- Figure 37: Egypt MEA Membrane Water Treatment Chemicals Market Revenue Share (%), by End-user Industry 2025 & 2033
- Figure 38: Egypt MEA Membrane Water Treatment Chemicals Market Revenue (billion), by Geography 2025 & 2033
- Figure 39: Egypt MEA Membrane Water Treatment Chemicals Market Revenue Share (%), by Geography 2025 & 2033
- Figure 40: Egypt MEA Membrane Water Treatment Chemicals Market Revenue (billion), by Country 2025 & 2033
- Figure 41: Egypt MEA Membrane Water Treatment Chemicals Market Revenue Share (%), by Country 2025 & 2033
- Figure 42: Rest of Middle East and Africa MEA Membrane Water Treatment Chemicals Market Revenue (billion), by Chemical Type 2025 & 2033
- Figure 43: Rest of Middle East and Africa MEA Membrane Water Treatment Chemicals Market Revenue Share (%), by Chemical Type 2025 & 2033
- Figure 44: Rest of Middle East and Africa MEA Membrane Water Treatment Chemicals Market Revenue (billion), by End-user Industry 2025 & 2033
- Figure 45: Rest of Middle East and Africa MEA Membrane Water Treatment Chemicals Market Revenue Share (%), by End-user Industry 2025 & 2033
- Figure 46: Rest of Middle East and Africa MEA Membrane Water Treatment Chemicals Market Revenue (billion), by Geography 2025 & 2033
- Figure 47: Rest of Middle East and Africa MEA Membrane Water Treatment Chemicals Market Revenue Share (%), by Geography 2025 & 2033
- Figure 48: Rest of Middle East and Africa MEA Membrane Water Treatment Chemicals Market Revenue (billion), by Country 2025 & 2033
- Figure 49: Rest of Middle East and Africa MEA Membrane Water Treatment Chemicals Market Revenue Share (%), by Country 2025 & 2033
List of Tables
- Table 1: Global MEA Membrane Water Treatment Chemicals Market Revenue billion Forecast, by Chemical Type 2020 & 2033
- Table 2: Global MEA Membrane Water Treatment Chemicals Market Revenue billion Forecast, by End-user Industry 2020 & 2033
- Table 3: Global MEA Membrane Water Treatment Chemicals Market Revenue billion Forecast, by Geography 2020 & 2033
- Table 4: Global MEA Membrane Water Treatment Chemicals Market Revenue billion Forecast, by Region 2020 & 2033
- Table 5: Global MEA Membrane Water Treatment Chemicals Market Revenue billion Forecast, by Chemical Type 2020 & 2033
- Table 6: Global MEA Membrane Water Treatment Chemicals Market Revenue billion Forecast, by End-user Industry 2020 & 2033
- Table 7: Global MEA Membrane Water Treatment Chemicals Market Revenue billion Forecast, by Geography 2020 & 2033
- Table 8: Global MEA Membrane Water Treatment Chemicals Market Revenue billion Forecast, by Country 2020 & 2033
- Table 9: Global MEA Membrane Water Treatment Chemicals Market Revenue billion Forecast, by Chemical Type 2020 & 2033
- Table 10: Global MEA Membrane Water Treatment Chemicals Market Revenue billion Forecast, by End-user Industry 2020 & 2033
- Table 11: Global MEA Membrane Water Treatment Chemicals Market Revenue billion Forecast, by Geography 2020 & 2033
- Table 12: Global MEA Membrane Water Treatment Chemicals Market Revenue billion Forecast, by Country 2020 & 2033
- Table 13: Global MEA Membrane Water Treatment Chemicals Market Revenue billion Forecast, by Chemical Type 2020 & 2033
- Table 14: Global MEA Membrane Water Treatment Chemicals Market Revenue billion Forecast, by End-user Industry 2020 & 2033
- Table 15: Global MEA Membrane Water Treatment Chemicals Market Revenue billion Forecast, by Geography 2020 & 2033
- Table 16: Global MEA Membrane Water Treatment Chemicals Market Revenue billion Forecast, by Country 2020 & 2033
- Table 17: Global MEA Membrane Water Treatment Chemicals Market Revenue billion Forecast, by Chemical Type 2020 & 2033
- Table 18: Global MEA Membrane Water Treatment Chemicals Market Revenue billion Forecast, by End-user Industry 2020 & 2033
- Table 19: Global MEA Membrane Water Treatment Chemicals Market Revenue billion Forecast, by Geography 2020 & 2033
- Table 20: Global MEA Membrane Water Treatment Chemicals Market Revenue billion Forecast, by Country 2020 & 2033
- Table 21: Global MEA Membrane Water Treatment Chemicals Market Revenue billion Forecast, by Chemical Type 2020 & 2033
- Table 22: Global MEA Membrane Water Treatment Chemicals Market Revenue billion Forecast, by End-user Industry 2020 & 2033
- Table 23: Global MEA Membrane Water Treatment Chemicals Market Revenue billion Forecast, by Geography 2020 & 2033
- Table 24: Global MEA Membrane Water Treatment Chemicals Market Revenue billion Forecast, by Country 2020 & 2033
- Table 25: Global MEA Membrane Water Treatment Chemicals Market Revenue billion Forecast, by Chemical Type 2020 & 2033
- Table 26: Global MEA Membrane Water Treatment Chemicals Market Revenue billion Forecast, by End-user Industry 2020 & 2033
- Table 27: Global MEA Membrane Water Treatment Chemicals Market Revenue billion Forecast, by Geography 2020 & 2033
- Table 28: Global MEA Membrane Water Treatment Chemicals Market Revenue billion Forecast, by Country 2020 & 2033
Frequently Asked Questions
1. What is the projected Compound Annual Growth Rate (CAGR) of the MEA Membrane Water Treatment Chemicals Market?
The projected CAGR is approximately 6.1%.
2. Which companies are prominent players in the MEA Membrane Water Treatment Chemicals Market?
Key companies in the market include King Lee Technologies, Ecolab, Suez*List Not Exhaustive, Kurita Water Industries Ltd, Genesys International Ltd, Italmatch Chemicals SpA, Kemira, Dow, Solenis, AES Arabia Ltd, Toray.
3. What are the main segments of the MEA Membrane Water Treatment Chemicals Market?
The market segments include Chemical Type, End-user Industry, Geography.
4. Can you provide details about the market size?
The market size is estimated to be USD 2.4 billion as of 2022.
5. What are some drivers contributing to market growth?
Growing Demand for Freshwater; Other Drivers.
6. What are the notable trends driving market growth?
The Desalination Industry is Expected to Dominate the Market.
7. Are there any restraints impacting market growth?
High Capital Cost; Other Restraints.
8. Can you provide examples of recent developments in the market?
In November 2021, Platinum Equity bought Solenis, a prominent worldwide manufacturer of specialty chemicals, from Clayton, Dubilier & Rice (CD&R) and BASF in a USD 5.25 billion deal. Solenis has been fully exited by both CD&R and BASF. Solenis has amalgamated with Sigura Water, an existing Platinum Equity portfolio firm, as part of the transaction. Solenis is expanding its portfolio by acquiring Sigura's residential and commercial pool water and spa treatment sectors. As a result of the transaction, Solenis will now have a worldwide presence of 120 countries, 47 production locations, and over 6,000 people.
9. What pricing options are available for accessing the report?
Pricing options include single-user, multi-user, and enterprise licenses priced at USD 4750, USD 5250, and USD 8750 respectively.
10. Is the market size provided in terms of value or volume?
The market size is provided in terms of value, measured in billion.
11. Are there any specific market keywords associated with the report?
Yes, the market keyword associated with the report is "MEA Membrane Water Treatment Chemicals Market," which aids in identifying and referencing the specific market segment covered.
12. How do I determine which pricing option suits my needs best?
The pricing options vary based on user requirements and access needs. Individual users may opt for single-user licenses, while businesses requiring broader access may choose multi-user or enterprise licenses for cost-effective access to the report.
13. Are there any additional resources or data provided in the MEA Membrane Water Treatment Chemicals Market report?
While the report offers comprehensive insights, it's advisable to review the specific contents or supplementary materials provided to ascertain if additional resources or data are available.
14. How can I stay updated on further developments or reports in the MEA Membrane Water Treatment Chemicals Market?
To stay informed about further developments, trends, and reports in the MEA Membrane Water Treatment Chemicals Market, consider subscribing to industry newsletters, following relevant companies and organizations, or regularly checking reputable industry news sources and publications.
Methodology
Step 1 - Identification of Relevant Samples Size from Population Database


Step 2 - Approaches for Defining Global Market Size (Value, Volume* & Price*)

Note*: In applicable scenarios
Step 3 - Data Sources
Primary Research
- Web Analytics
- Survey Reports
- Research Institute
- Latest Research Reports
- Opinion Leaders
Secondary Research
- Annual Reports
- White Paper
- Latest Press Release
- Industry Association
- Paid Database
- Investor Presentations

Step 4 - Data Triangulation
Involves using different sources of information in order to increase the validity of a study
These sources are likely to be stakeholders in a program - participants, other researchers, program staff, other community members, and so on.
Then we put all data in single framework & apply various statistical tools to find out the dynamic on the market.
During the analysis stage, feedback from the stakeholder groups would be compared to determine areas of agreement as well as areas of divergence