

Key Insights
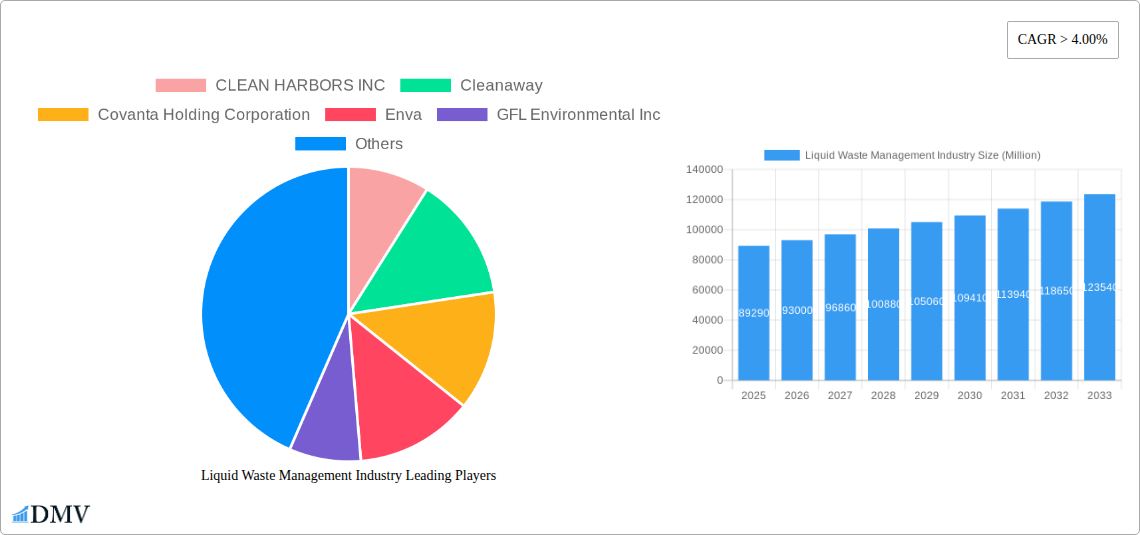
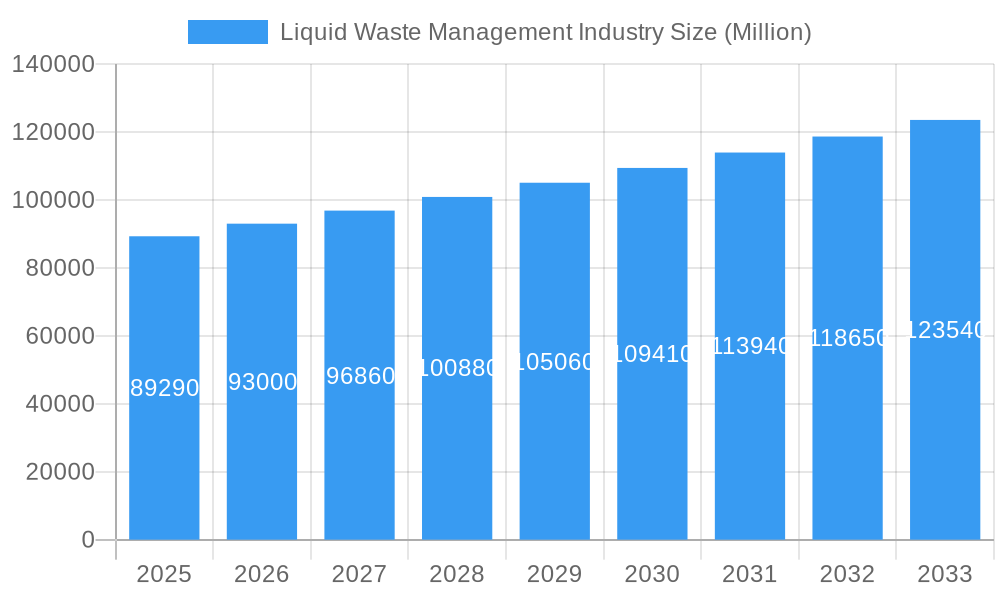
The global liquid waste management market, valued at $89.29 billion in 2025, is poised for substantial growth, exhibiting a Compound Annual Growth Rate (CAGR) exceeding 4.00% from 2025 to 2033. This expansion is fueled by several key drivers. Stringent environmental regulations globally are pushing industries to adopt more sustainable waste disposal methods, driving demand for advanced liquid waste treatment technologies. The increasing industrialization and urbanization in developing economies further contribute to the market's growth, as these regions generate significant volumes of liquid waste requiring effective management. Technological advancements in treatment techniques, such as membrane filtration, advanced oxidation processes, and biological treatment, are enhancing efficiency and reducing environmental impact, thereby attracting investment and fostering market growth. Growing awareness among consumers and businesses about the detrimental effects of improper waste disposal on public health and the environment is also creating a positive market sentiment.
Liquid Waste Management Industry Market Size (In Billion)
However, the market faces some challenges. High initial investment costs associated with establishing and maintaining advanced liquid waste treatment facilities can pose a barrier to entry for smaller players. The fluctuating prices of raw materials and energy required for treatment processes also influence operational costs and profitability. Additionally, the complexity of liquid waste composition and the need for customized treatment solutions based on waste characteristics can impact operational efficiency. Despite these restraints, the long-term outlook for the liquid waste management market remains positive, driven by the increasing need for sustainable and environmentally sound waste management practices. Leading players like Clean Harbors Inc., Cleanaway, and Veolia are actively innovating and expanding their service offerings to capitalize on market opportunities. The market is expected to witness consolidation as larger companies acquire smaller players, further enhancing their market share and capabilities.
Liquid Waste Management Industry Company Market Share
Liquid Waste Management Industry Market Report: 2019-2033
This comprehensive report provides an in-depth analysis of the global liquid waste management industry, offering invaluable insights for stakeholders seeking to navigate this dynamic market. With a study period spanning 2019-2033, a base year of 2025, and a forecast period of 2025-2033, this report delivers crucial data and projections to inform strategic decision-making. The market is projected to reach xx Million by 2033, representing significant growth opportunities.
Liquid Waste Management Industry Market Composition & Trends
The global liquid waste management market exhibits a moderately consolidated structure, with several major players commanding significant market share. Market concentration is influenced by factors such as economies of scale, technological capabilities, and geographical reach. Innovation is driven by stringent environmental regulations, increasing demand for sustainable waste solutions, and advancements in treatment technologies. The regulatory landscape varies significantly across regions, with some countries implementing stricter standards than others, impacting operational costs and technological adoption. Substitute products, such as on-site treatment systems, exert competitive pressure on centralized waste management services. End-user profiles include industrial, commercial, and municipal sectors, each with specific waste characteristics and treatment requirements. Mergers and acquisitions (M&A) activity is robust, with significant deals shaping the competitive landscape. For example, the combined market share of the top 5 players is estimated to be around 40% in 2025.
- Market Share Distribution (2025): WM Intellectual Property Holdings L L C (15%), Suez (12%), Veolia (10%), Cleanaway (8%), Others (55%) Note: These figures are estimates.
- M&A Deal Values (2019-2024): Total value of deals exceeded $xx Million, with an average deal size of $xx Million.
- Key Innovation Catalysts: Stringent environmental regulations, increasing demand for resource recovery, advancements in biological treatment technologies.
- Substitute Products: On-site treatment systems, decentralized waste management solutions.
Liquid Waste Management Industry Industry Evolution
The liquid waste management industry has experienced substantial and dynamic growth over the past five years (2019-2024). This upward trajectory has been primarily fueled by the accelerating pace of urbanization, intensified industrialization, and a pervasive increase in environmental awareness across the globe. During this period, the market has demonstrated a robust Compound Annual Growth Rate (CAGR) of approximately XX%, indicating significant expansion. A key driver of this progress has been the widespread adoption of cutting-edge technological advancements. Innovations such as Advanced Oxidation Processes (AOPs), renowned for their superior pollutant breakdown capabilities, and Membrane Bioreactors (MBRs), which yield higher quality treated effluent, have demonstrably enhanced treatment efficiency and significantly minimized environmental impact. Furthermore, evolving consumer demands are actively steering the industry towards more sustainable and cost-effective solutions. This shift is creating fertile ground for innovation, particularly in nascent areas like resource recovery from waste streams and the development of waste-to-energy technologies. Complementing these market forces, escalating government investments in essential infrastructure development and the growing embrace of sustainable waste management practices are providing substantial impetus to the sector. Projections indicate that this growth will persist, with an anticipated CAGR of XX% expected from 2025 to 2033, leading to a market valuation of XX Million by the latter year. This sustained expansion will be propelled by ongoing strategic investments in infrastructure modernization and the continued integration of pioneering technologies. The adoption rate of advanced treatment technologies, including AOPs, is forecast to climb from an estimated XX% in 2025 to a substantial XX% by 2033.
Leading Regions, Countries, or Segments in Liquid Waste Management Industry
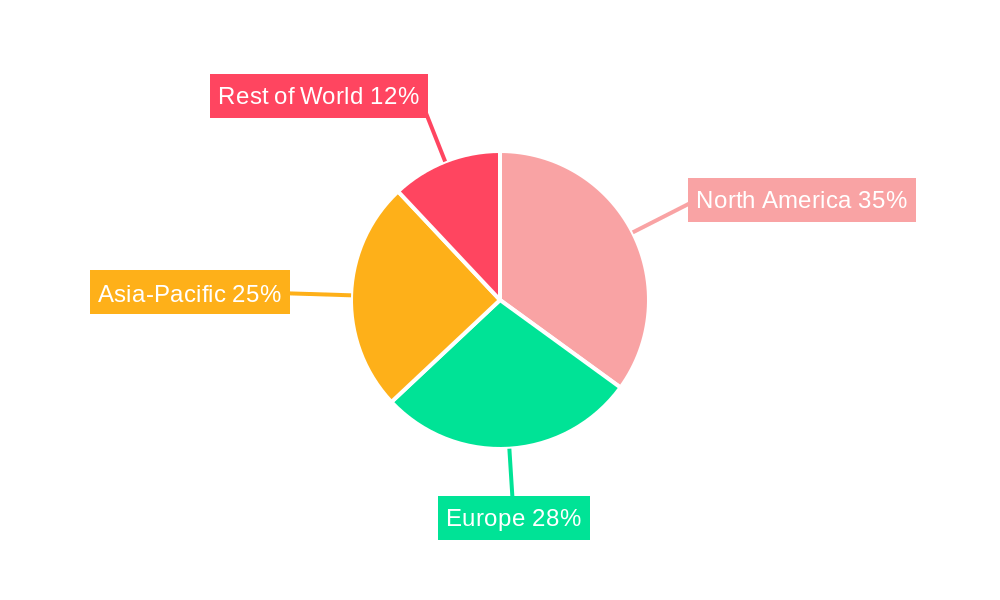
The North American region currently stands as the undisputed leader in the global liquid waste management market, a position it maintains due to a confluence of powerful contributing factors. Foremost among these are the existence of stringent environmental regulations that mandate high standards for waste treatment, a persistently robust industrial sector generating substantial liquid waste volumes, and significant, ongoing investments in critical infrastructure development. European nations also command a considerable market presence, underpinned by their exceptionally strict environmental policies and the presence of highly developed and efficient waste management infrastructures. These regions are at the forefront of adopting innovative solutions and ensuring compliant and effective waste management practices.
- Key Drivers in North America:
- A high volume and diversity of industrial activity, resulting in large quantities of liquid waste requiring specialized management.
- Stringent and consistently enforced environmental regulations that actively promote and necessitate investment in advanced treatment technologies.
- Substantial and sustained public and private sector investments channelled into essential infrastructure projects and upgrades.
- Key Drivers in Europe:
- A comprehensive framework of stringent environmental regulations and forward-thinking policies that actively encourage and mandate sustainable waste management practices.
- A highly developed and mature waste management infrastructure, characterized by widespread access to advanced treatment facilities and services.
- A growing and increasingly vocal awareness among consumers regarding the critical importance of environmental protection and responsible waste disposal.
The preeminent positions of North America and Europe are largely attributable to their proactive approaches, including the early and widespread adoption of advanced treatment technologies, the implementation of rigorous environmental standards, and sustained economic growth that supports significant investment in the sector.
Liquid Waste Management Industry Product Innovations
Recent groundbreaking innovations in the liquid waste management sector are revolutionizing how waste is treated and managed. Key among these are advanced oxidation processes (AOPs), which offer unparalleled effectiveness in breaking down recalcitrant pollutants. Complementing these are membrane bioreactors (MBRs), significantly enhancing effluent quality through advanced separation techniques. Furthermore, the resurgence and refinement of anaerobic digestion technologies are enabling efficient biogas generation for energy recovery and the valuable extraction of resources from waste streams. These cutting-edge technologies present compelling unique selling propositions, including markedly reduced energy consumption during operation, substantially higher treatment efficiencies, and robust resource recovery capabilities. Beyond these core treatment technologies, advancements in sophisticated sensor technology and powerful data analytics are playing an increasingly vital role in optimizing operational efficiency, enabling real-time monitoring, and fine-tuning treatment processes for maximum effectiveness and minimal environmental impact.
Propelling Factors for Liquid Waste Management Industry Growth
Several factors are propelling the growth of the liquid waste management industry. Stringent environmental regulations globally are driving the adoption of advanced treatment technologies. Increasing industrialization and urbanization generate larger volumes of liquid waste, boosting demand for efficient management solutions. Government investments in infrastructure projects are creating opportunities for expansion and modernization. Furthermore, increasing consumer awareness of environmental sustainability is pushing the demand for environmentally friendly waste management practices.
Obstacles in the Liquid Waste Management Industry Market
The liquid waste management industry, while experiencing significant growth, also navigates a landscape of notable obstacles. Foremost among these are the complex and stringent regulatory compliance requirements, which often translate into substantial operational costs and necessitate ongoing vigilance. Supply chain disruptions, particularly concerning specialized equipment, critical chemicals, and spare parts, can critically impact project timelines and disrupt operational continuity. The intensely competitive market environment, characterized by the presence of both established industry giants and agile emerging players, frequently leads to significant price pressures and a continuous imperative for innovation to maintain market share. Furthermore, the inherent volatility in raw material prices can directly influence profit margins and necessitate robust financial planning. The aggregate financial burden associated with stringent regulatory compliance and recurring supply chain disruptions is estimated to be in the region of XX Million annually, posing a significant challenge to profitability and strategic planning.
Future Opportunities in Liquid Waste Management Industry
Future opportunities lie in the development and adoption of innovative treatment technologies that further improve efficiency and sustainability. Expanding into emerging markets with rapidly growing economies presents significant growth potential. The increasing focus on resource recovery and circular economy principles offers opportunities for new business models and revenue streams. Advancements in digital technologies can enhance monitoring, optimization, and management of waste treatment processes.
Major Players in the Liquid Waste Management Industry Ecosystem
- CLEAN HARBORS INC
- Cleanaway
- Covanta Holding Corporation
- Enva
- GFL Environmental Inc
- Hulsey (a Blue Flow Company)
- Ovivo
- REMONDIS SE & Co KG
- SUEZ
- Veolia
- WM Intellectual Property Holdings L L C
*List Not Exhaustive
Key Developments in Liquid Waste Management Industry Industry
- October 2023: SUEZ Recycling and Recovery UK acquired Devon Contract Waste (DCW), strengthening its market position.
- September 2023: SUEZ secured contracts for water and waste projects in China, supporting the country's carbon neutrality goals.
- January 2022: Veolia finalized the sale of the new SUEZ to a consortium of investors, reshaping the industry landscape.
Strategic Liquid Waste Management Industry Market Forecast
The liquid waste management industry is robustly positioned for sustained and accelerated growth, driven by a powerful synergy of ongoing technological advancements, a palpable increase in global environmental awareness, and the implementation of supportive governmental policies worldwide. The future landscape presents a wealth of opportunities, particularly in the widespread adoption of truly sustainable practices, the maximization of resource recovery from waste streams, and the continuous development of novel and highly efficient treatment technologies. The market is anticipated to witness considerable expansion within emerging economies, offering lucrative and diverse investment prospects for companies operating within this vital sector. Overall, the global market is projected to experience robust and dynamic growth, fueled by an ever-increasing demand for efficient, reliable, and environmentally responsible waste management solutions that prioritize both public health and ecological preservation.
Liquid Waste Management Industry Segmentation
-
1. Source
- 1.1. Residential
- 1.2. Commercial
- 1.3. Industrial
-
2. Service
- 2.1. Collection
- 2.2. Transportation/Hauling
- 2.3. Disposal/Recycling
-
3. End-user Industry
- 3.1. Automotive
- 3.2. Iron and Steel
- 3.3. Oil and Gas
- 3.4. Pharmaceutical
- 3.5. Textile
- 3.6. Other En
Liquid Waste Management Industry Segmentation By Geography
-
1. Asia Pacific
- 1.1. China
- 1.2. India
- 1.3. Japan
- 1.4. South Korea
- 1.5. Rest of Asia Pacific
-
2. North America
- 2.1. United States
- 2.2. Canada
- 2.3. Mexico
-
3. Europe
- 3.1. Germany
- 3.2. United Kingdom
- 3.3. France
- 3.4. Italy
- 3.5. Rest of Europe
-
4. South America
- 4.1. Brazil
- 4.2. Argentina
- 4.3. Rest of South America
-
5. Middle East and Africa
- 5.1. Saudi Arabia
- 5.2. South Africa
- 5.3. Rest of Middle East and Africa
Liquid Waste Management Industry Regional Market Share
Geographic Coverage of Liquid Waste Management Industry
Liquid Waste Management Industry REPORT HIGHLIGHTS
| Aspects | Details |
|---|---|
| Study Period | 2020-2034 |
| Base Year | 2025 |
| Estimated Year | 2026 |
| Forecast Period | 2026-2034 |
| Historical Period | 2020-2025 |
| Growth Rate | CAGR of > 4.00% from 2020-2034 |
| Segmentation |
|
Table of Contents
- 1. Introduction
- 1.1. Research Scope
- 1.2. Market Segmentation
- 1.3. Research Objective
- 1.4. Definitions and Assumptions
- 2. Executive Summary
- 2.1. Market Snapshot
- 3. Market Dynamics
- 3.1. Market Drivers
- 3.2. Market Restrains
- 3.3. Market Trends
- 3.4. Market Opportunities
- 4. Market Factor Analysis
- 4.1. Porters Five Forces
- 4.1.1. Bargaining Power of Suppliers
- 4.1.2. Bargaining Power of Buyers
- 4.1.3. Threat of New Entrants
- 4.1.4. Threat of Substitutes
- 4.1.5. Competitive Rivalry
- 4.2. PESTEL analysis
- 4.3. BCG Analysis
- 4.3.1. Stars (High Growth, High Market Share)
- 4.3.2. Cash Cows (Low Growth, High Market Share)
- 4.3.3. Question Mark (High Growth, Low Market Share)
- 4.3.4. Dogs (Low Growth, Low Market Share)
- 4.4. Ansoff Matrix Analysis
- 4.5. Supply Chain Analysis
- 4.6. Regulatory Landscape
- 4.7. Current Market Potential and Opportunity Assessment (TAM–SAM–SOM Framework)
- 4.8. DMV Analyst Note
- 4.1. Porters Five Forces
- 5. Market Analysis, Insights and Forecast 2021-2033
- 5.1. Market Analysis, Insights and Forecast - by Source
- 5.1.1. Residential
- 5.1.2. Commercial
- 5.1.3. Industrial
- 5.2. Market Analysis, Insights and Forecast - by Service
- 5.2.1. Collection
- 5.2.2. Transportation/Hauling
- 5.2.3. Disposal/Recycling
- 5.3. Market Analysis, Insights and Forecast - by End-user Industry
- 5.3.1. Automotive
- 5.3.2. Iron and Steel
- 5.3.3. Oil and Gas
- 5.3.4. Pharmaceutical
- 5.3.5. Textile
- 5.3.6. Other En
- 5.4. Market Analysis, Insights and Forecast - by Region
- 5.4.1. Asia Pacific
- 5.4.2. North America
- 5.4.3. Europe
- 5.4.4. South America
- 5.4.5. Middle East and Africa
- 5.1. Market Analysis, Insights and Forecast - by Source
- 6. Global Liquid Waste Management Industry Analysis, Insights and Forecast, 2021-2033
- 6.1. Market Analysis, Insights and Forecast - by Source
- 6.1.1. Residential
- 6.1.2. Commercial
- 6.1.3. Industrial
- 6.2. Market Analysis, Insights and Forecast - by Service
- 6.2.1. Collection
- 6.2.2. Transportation/Hauling
- 6.2.3. Disposal/Recycling
- 6.3. Market Analysis, Insights and Forecast - by End-user Industry
- 6.3.1. Automotive
- 6.3.2. Iron and Steel
- 6.3.3. Oil and Gas
- 6.3.4. Pharmaceutical
- 6.3.5. Textile
- 6.3.6. Other En
- 6.1. Market Analysis, Insights and Forecast - by Source
- 7. Asia Pacific Liquid Waste Management Industry Analysis, Insights and Forecast, 2020-2032
- 7.1. Market Analysis, Insights and Forecast - by Source
- 7.1.1. Residential
- 7.1.2. Commercial
- 7.1.3. Industrial
- 7.2. Market Analysis, Insights and Forecast - by Service
- 7.2.1. Collection
- 7.2.2. Transportation/Hauling
- 7.2.3. Disposal/Recycling
- 7.3. Market Analysis, Insights and Forecast - by End-user Industry
- 7.3.1. Automotive
- 7.3.2. Iron and Steel
- 7.3.3. Oil and Gas
- 7.3.4. Pharmaceutical
- 7.3.5. Textile
- 7.3.6. Other En
- 7.1. Market Analysis, Insights and Forecast - by Source
- 8. North America Liquid Waste Management Industry Analysis, Insights and Forecast, 2020-2032
- 8.1. Market Analysis, Insights and Forecast - by Source
- 8.1.1. Residential
- 8.1.2. Commercial
- 8.1.3. Industrial
- 8.2. Market Analysis, Insights and Forecast - by Service
- 8.2.1. Collection
- 8.2.2. Transportation/Hauling
- 8.2.3. Disposal/Recycling
- 8.3. Market Analysis, Insights and Forecast - by End-user Industry
- 8.3.1. Automotive
- 8.3.2. Iron and Steel
- 8.3.3. Oil and Gas
- 8.3.4. Pharmaceutical
- 8.3.5. Textile
- 8.3.6. Other En
- 8.1. Market Analysis, Insights and Forecast - by Source
- 9. Europe Liquid Waste Management Industry Analysis, Insights and Forecast, 2020-2032
- 9.1. Market Analysis, Insights and Forecast - by Source
- 9.1.1. Residential
- 9.1.2. Commercial
- 9.1.3. Industrial
- 9.2. Market Analysis, Insights and Forecast - by Service
- 9.2.1. Collection
- 9.2.2. Transportation/Hauling
- 9.2.3. Disposal/Recycling
- 9.3. Market Analysis, Insights and Forecast - by End-user Industry
- 9.3.1. Automotive
- 9.3.2. Iron and Steel
- 9.3.3. Oil and Gas
- 9.3.4. Pharmaceutical
- 9.3.5. Textile
- 9.3.6. Other En
- 9.1. Market Analysis, Insights and Forecast - by Source
- 10. South America Liquid Waste Management Industry Analysis, Insights and Forecast, 2020-2032
- 10.1. Market Analysis, Insights and Forecast - by Source
- 10.1.1. Residential
- 10.1.2. Commercial
- 10.1.3. Industrial
- 10.2. Market Analysis, Insights and Forecast - by Service
- 10.2.1. Collection
- 10.2.2. Transportation/Hauling
- 10.2.3. Disposal/Recycling
- 10.3. Market Analysis, Insights and Forecast - by End-user Industry
- 10.3.1. Automotive
- 10.3.2. Iron and Steel
- 10.3.3. Oil and Gas
- 10.3.4. Pharmaceutical
- 10.3.5. Textile
- 10.3.6. Other En
- 10.1. Market Analysis, Insights and Forecast - by Source
- 11. Middle East and Africa Liquid Waste Management Industry Analysis, Insights and Forecast, 2020-2032
- 11.1. Market Analysis, Insights and Forecast - by Source
- 11.1.1. Residential
- 11.1.2. Commercial
- 11.1.3. Industrial
- 11.2. Market Analysis, Insights and Forecast - by Service
- 11.2.1. Collection
- 11.2.2. Transportation/Hauling
- 11.2.3. Disposal/Recycling
- 11.3. Market Analysis, Insights and Forecast - by End-user Industry
- 11.3.1. Automotive
- 11.3.2. Iron and Steel
- 11.3.3. Oil and Gas
- 11.3.4. Pharmaceutical
- 11.3.5. Textile
- 11.3.6. Other En
- 11.1. Market Analysis, Insights and Forecast - by Source
- 12. Competitive Analysis
- 12.1. Company Profiles
- 12.1.1 CLEAN HARBORS INC
- 12.1.1.1. Company Overview
- 12.1.1.2. Products
- 12.1.1.3. Company Financials
- 12.1.1.4. SWOT Analysis
- 12.1.2 Cleanaway
- 12.1.2.1. Company Overview
- 12.1.2.2. Products
- 12.1.2.3. Company Financials
- 12.1.2.4. SWOT Analysis
- 12.1.3 Covanta Holding Corporation
- 12.1.3.1. Company Overview
- 12.1.3.2. Products
- 12.1.3.3. Company Financials
- 12.1.3.4. SWOT Analysis
- 12.1.4 Enva
- 12.1.4.1. Company Overview
- 12.1.4.2. Products
- 12.1.4.3. Company Financials
- 12.1.4.4. SWOT Analysis
- 12.1.5 GFL Environmental Inc
- 12.1.5.1. Company Overview
- 12.1.5.2. Products
- 12.1.5.3. Company Financials
- 12.1.5.4. SWOT Analysis
- 12.1.6 Hulsey (a Blue Flow Company)
- 12.1.6.1. Company Overview
- 12.1.6.2. Products
- 12.1.6.3. Company Financials
- 12.1.6.4. SWOT Analysis
- 12.1.7 Ovivo
- 12.1.7.1. Company Overview
- 12.1.7.2. Products
- 12.1.7.3. Company Financials
- 12.1.7.4. SWOT Analysis
- 12.1.8 REMONDIS SE & Co KG
- 12.1.8.1. Company Overview
- 12.1.8.2. Products
- 12.1.8.3. Company Financials
- 12.1.8.4. SWOT Analysis
- 12.1.9 SUEZ
- 12.1.9.1. Company Overview
- 12.1.9.2. Products
- 12.1.9.3. Company Financials
- 12.1.9.4. SWOT Analysis
- 12.1.10 Veolia
- 12.1.10.1. Company Overview
- 12.1.10.2. Products
- 12.1.10.3. Company Financials
- 12.1.10.4. SWOT Analysis
- 12.1.11 WM Intellectual Property Holdings L L C *List Not Exhaustive
- 12.1.11.1. Company Overview
- 12.1.11.2. Products
- 12.1.11.3. Company Financials
- 12.1.11.4. SWOT Analysis
- 12.1.1 CLEAN HARBORS INC
- 12.2. Market Entropy
- 12.2.1 Company's Key Areas Served
- 12.2.2 Recent Developments
- 12.3. Company Market Share Analysis 2025
- 12.3.1 Top 5 Companies Market Share Analysis
- 12.3.2 Top 3 Companies Market Share Analysis
- 12.4. List of Potential Customers
- 13. Research Methodology
List of Figures
- Figure 1: Global Liquid Waste Management Industry Revenue Breakdown (Million, %) by Region 2025 & 2033
- Figure 2: Global Liquid Waste Management Industry Volume Breakdown (Billion, %) by Region 2025 & 2033
- Figure 3: Asia Pacific Liquid Waste Management Industry Revenue (Million), by Source 2025 & 2033
- Figure 4: Asia Pacific Liquid Waste Management Industry Volume (Billion), by Source 2025 & 2033
- Figure 5: Asia Pacific Liquid Waste Management Industry Revenue Share (%), by Source 2025 & 2033
- Figure 6: Asia Pacific Liquid Waste Management Industry Volume Share (%), by Source 2025 & 2033
- Figure 7: Asia Pacific Liquid Waste Management Industry Revenue (Million), by Service 2025 & 2033
- Figure 8: Asia Pacific Liquid Waste Management Industry Volume (Billion), by Service 2025 & 2033
- Figure 9: Asia Pacific Liquid Waste Management Industry Revenue Share (%), by Service 2025 & 2033
- Figure 10: Asia Pacific Liquid Waste Management Industry Volume Share (%), by Service 2025 & 2033
- Figure 11: Asia Pacific Liquid Waste Management Industry Revenue (Million), by End-user Industry 2025 & 2033
- Figure 12: Asia Pacific Liquid Waste Management Industry Volume (Billion), by End-user Industry 2025 & 2033
- Figure 13: Asia Pacific Liquid Waste Management Industry Revenue Share (%), by End-user Industry 2025 & 2033
- Figure 14: Asia Pacific Liquid Waste Management Industry Volume Share (%), by End-user Industry 2025 & 2033
- Figure 15: Asia Pacific Liquid Waste Management Industry Revenue (Million), by Country 2025 & 2033
- Figure 16: Asia Pacific Liquid Waste Management Industry Volume (Billion), by Country 2025 & 2033
- Figure 17: Asia Pacific Liquid Waste Management Industry Revenue Share (%), by Country 2025 & 2033
- Figure 18: Asia Pacific Liquid Waste Management Industry Volume Share (%), by Country 2025 & 2033
- Figure 19: North America Liquid Waste Management Industry Revenue (Million), by Source 2025 & 2033
- Figure 20: North America Liquid Waste Management Industry Volume (Billion), by Source 2025 & 2033
- Figure 21: North America Liquid Waste Management Industry Revenue Share (%), by Source 2025 & 2033
- Figure 22: North America Liquid Waste Management Industry Volume Share (%), by Source 2025 & 2033
- Figure 23: North America Liquid Waste Management Industry Revenue (Million), by Service 2025 & 2033
- Figure 24: North America Liquid Waste Management Industry Volume (Billion), by Service 2025 & 2033
- Figure 25: North America Liquid Waste Management Industry Revenue Share (%), by Service 2025 & 2033
- Figure 26: North America Liquid Waste Management Industry Volume Share (%), by Service 2025 & 2033
- Figure 27: North America Liquid Waste Management Industry Revenue (Million), by End-user Industry 2025 & 2033
- Figure 28: North America Liquid Waste Management Industry Volume (Billion), by End-user Industry 2025 & 2033
- Figure 29: North America Liquid Waste Management Industry Revenue Share (%), by End-user Industry 2025 & 2033
- Figure 30: North America Liquid Waste Management Industry Volume Share (%), by End-user Industry 2025 & 2033
- Figure 31: North America Liquid Waste Management Industry Revenue (Million), by Country 2025 & 2033
- Figure 32: North America Liquid Waste Management Industry Volume (Billion), by Country 2025 & 2033
- Figure 33: North America Liquid Waste Management Industry Revenue Share (%), by Country 2025 & 2033
- Figure 34: North America Liquid Waste Management Industry Volume Share (%), by Country 2025 & 2033
- Figure 35: Europe Liquid Waste Management Industry Revenue (Million), by Source 2025 & 2033
- Figure 36: Europe Liquid Waste Management Industry Volume (Billion), by Source 2025 & 2033
- Figure 37: Europe Liquid Waste Management Industry Revenue Share (%), by Source 2025 & 2033
- Figure 38: Europe Liquid Waste Management Industry Volume Share (%), by Source 2025 & 2033
- Figure 39: Europe Liquid Waste Management Industry Revenue (Million), by Service 2025 & 2033
- Figure 40: Europe Liquid Waste Management Industry Volume (Billion), by Service 2025 & 2033
- Figure 41: Europe Liquid Waste Management Industry Revenue Share (%), by Service 2025 & 2033
- Figure 42: Europe Liquid Waste Management Industry Volume Share (%), by Service 2025 & 2033
- Figure 43: Europe Liquid Waste Management Industry Revenue (Million), by End-user Industry 2025 & 2033
- Figure 44: Europe Liquid Waste Management Industry Volume (Billion), by End-user Industry 2025 & 2033
- Figure 45: Europe Liquid Waste Management Industry Revenue Share (%), by End-user Industry 2025 & 2033
- Figure 46: Europe Liquid Waste Management Industry Volume Share (%), by End-user Industry 2025 & 2033
- Figure 47: Europe Liquid Waste Management Industry Revenue (Million), by Country 2025 & 2033
- Figure 48: Europe Liquid Waste Management Industry Volume (Billion), by Country 2025 & 2033
- Figure 49: Europe Liquid Waste Management Industry Revenue Share (%), by Country 2025 & 2033
- Figure 50: Europe Liquid Waste Management Industry Volume Share (%), by Country 2025 & 2033
- Figure 51: South America Liquid Waste Management Industry Revenue (Million), by Source 2025 & 2033
- Figure 52: South America Liquid Waste Management Industry Volume (Billion), by Source 2025 & 2033
- Figure 53: South America Liquid Waste Management Industry Revenue Share (%), by Source 2025 & 2033
- Figure 54: South America Liquid Waste Management Industry Volume Share (%), by Source 2025 & 2033
- Figure 55: South America Liquid Waste Management Industry Revenue (Million), by Service 2025 & 2033
- Figure 56: South America Liquid Waste Management Industry Volume (Billion), by Service 2025 & 2033
- Figure 57: South America Liquid Waste Management Industry Revenue Share (%), by Service 2025 & 2033
- Figure 58: South America Liquid Waste Management Industry Volume Share (%), by Service 2025 & 2033
- Figure 59: South America Liquid Waste Management Industry Revenue (Million), by End-user Industry 2025 & 2033
- Figure 60: South America Liquid Waste Management Industry Volume (Billion), by End-user Industry 2025 & 2033
- Figure 61: South America Liquid Waste Management Industry Revenue Share (%), by End-user Industry 2025 & 2033
- Figure 62: South America Liquid Waste Management Industry Volume Share (%), by End-user Industry 2025 & 2033
- Figure 63: South America Liquid Waste Management Industry Revenue (Million), by Country 2025 & 2033
- Figure 64: South America Liquid Waste Management Industry Volume (Billion), by Country 2025 & 2033
- Figure 65: South America Liquid Waste Management Industry Revenue Share (%), by Country 2025 & 2033
- Figure 66: South America Liquid Waste Management Industry Volume Share (%), by Country 2025 & 2033
- Figure 67: Middle East and Africa Liquid Waste Management Industry Revenue (Million), by Source 2025 & 2033
- Figure 68: Middle East and Africa Liquid Waste Management Industry Volume (Billion), by Source 2025 & 2033
- Figure 69: Middle East and Africa Liquid Waste Management Industry Revenue Share (%), by Source 2025 & 2033
- Figure 70: Middle East and Africa Liquid Waste Management Industry Volume Share (%), by Source 2025 & 2033
- Figure 71: Middle East and Africa Liquid Waste Management Industry Revenue (Million), by Service 2025 & 2033
- Figure 72: Middle East and Africa Liquid Waste Management Industry Volume (Billion), by Service 2025 & 2033
- Figure 73: Middle East and Africa Liquid Waste Management Industry Revenue Share (%), by Service 2025 & 2033
- Figure 74: Middle East and Africa Liquid Waste Management Industry Volume Share (%), by Service 2025 & 2033
- Figure 75: Middle East and Africa Liquid Waste Management Industry Revenue (Million), by End-user Industry 2025 & 2033
- Figure 76: Middle East and Africa Liquid Waste Management Industry Volume (Billion), by End-user Industry 2025 & 2033
- Figure 77: Middle East and Africa Liquid Waste Management Industry Revenue Share (%), by End-user Industry 2025 & 2033
- Figure 78: Middle East and Africa Liquid Waste Management Industry Volume Share (%), by End-user Industry 2025 & 2033
- Figure 79: Middle East and Africa Liquid Waste Management Industry Revenue (Million), by Country 2025 & 2033
- Figure 80: Middle East and Africa Liquid Waste Management Industry Volume (Billion), by Country 2025 & 2033
- Figure 81: Middle East and Africa Liquid Waste Management Industry Revenue Share (%), by Country 2025 & 2033
- Figure 82: Middle East and Africa Liquid Waste Management Industry Volume Share (%), by Country 2025 & 2033
List of Tables
- Table 1: Global Liquid Waste Management Industry Revenue Million Forecast, by Source 2020 & 2033
- Table 2: Global Liquid Waste Management Industry Volume Billion Forecast, by Source 2020 & 2033
- Table 3: Global Liquid Waste Management Industry Revenue Million Forecast, by Service 2020 & 2033
- Table 4: Global Liquid Waste Management Industry Volume Billion Forecast, by Service 2020 & 2033
- Table 5: Global Liquid Waste Management Industry Revenue Million Forecast, by End-user Industry 2020 & 2033
- Table 6: Global Liquid Waste Management Industry Volume Billion Forecast, by End-user Industry 2020 & 2033
- Table 7: Global Liquid Waste Management Industry Revenue Million Forecast, by Region 2020 & 2033
- Table 8: Global Liquid Waste Management Industry Volume Billion Forecast, by Region 2020 & 2033
- Table 9: Global Liquid Waste Management Industry Revenue Million Forecast, by Source 2020 & 2033
- Table 10: Global Liquid Waste Management Industry Volume Billion Forecast, by Source 2020 & 2033
- Table 11: Global Liquid Waste Management Industry Revenue Million Forecast, by Service 2020 & 2033
- Table 12: Global Liquid Waste Management Industry Volume Billion Forecast, by Service 2020 & 2033
- Table 13: Global Liquid Waste Management Industry Revenue Million Forecast, by End-user Industry 2020 & 2033
- Table 14: Global Liquid Waste Management Industry Volume Billion Forecast, by End-user Industry 2020 & 2033
- Table 15: Global Liquid Waste Management Industry Revenue Million Forecast, by Country 2020 & 2033
- Table 16: Global Liquid Waste Management Industry Volume Billion Forecast, by Country 2020 & 2033
- Table 17: China Liquid Waste Management Industry Revenue (Million) Forecast, by Application 2020 & 2033
- Table 18: China Liquid Waste Management Industry Volume (Billion) Forecast, by Application 2020 & 2033
- Table 19: India Liquid Waste Management Industry Revenue (Million) Forecast, by Application 2020 & 2033
- Table 20: India Liquid Waste Management Industry Volume (Billion) Forecast, by Application 2020 & 2033
- Table 21: Japan Liquid Waste Management Industry Revenue (Million) Forecast, by Application 2020 & 2033
- Table 22: Japan Liquid Waste Management Industry Volume (Billion) Forecast, by Application 2020 & 2033
- Table 23: South Korea Liquid Waste Management Industry Revenue (Million) Forecast, by Application 2020 & 2033
- Table 24: South Korea Liquid Waste Management Industry Volume (Billion) Forecast, by Application 2020 & 2033
- Table 25: Rest of Asia Pacific Liquid Waste Management Industry Revenue (Million) Forecast, by Application 2020 & 2033
- Table 26: Rest of Asia Pacific Liquid Waste Management Industry Volume (Billion) Forecast, by Application 2020 & 2033
- Table 27: Global Liquid Waste Management Industry Revenue Million Forecast, by Source 2020 & 2033
- Table 28: Global Liquid Waste Management Industry Volume Billion Forecast, by Source 2020 & 2033
- Table 29: Global Liquid Waste Management Industry Revenue Million Forecast, by Service 2020 & 2033
- Table 30: Global Liquid Waste Management Industry Volume Billion Forecast, by Service 2020 & 2033
- Table 31: Global Liquid Waste Management Industry Revenue Million Forecast, by End-user Industry 2020 & 2033
- Table 32: Global Liquid Waste Management Industry Volume Billion Forecast, by End-user Industry 2020 & 2033
- Table 33: Global Liquid Waste Management Industry Revenue Million Forecast, by Country 2020 & 2033
- Table 34: Global Liquid Waste Management Industry Volume Billion Forecast, by Country 2020 & 2033
- Table 35: United States Liquid Waste Management Industry Revenue (Million) Forecast, by Application 2020 & 2033
- Table 36: United States Liquid Waste Management Industry Volume (Billion) Forecast, by Application 2020 & 2033
- Table 37: Canada Liquid Waste Management Industry Revenue (Million) Forecast, by Application 2020 & 2033
- Table 38: Canada Liquid Waste Management Industry Volume (Billion) Forecast, by Application 2020 & 2033
- Table 39: Mexico Liquid Waste Management Industry Revenue (Million) Forecast, by Application 2020 & 2033
- Table 40: Mexico Liquid Waste Management Industry Volume (Billion) Forecast, by Application 2020 & 2033
- Table 41: Global Liquid Waste Management Industry Revenue Million Forecast, by Source 2020 & 2033
- Table 42: Global Liquid Waste Management Industry Volume Billion Forecast, by Source 2020 & 2033
- Table 43: Global Liquid Waste Management Industry Revenue Million Forecast, by Service 2020 & 2033
- Table 44: Global Liquid Waste Management Industry Volume Billion Forecast, by Service 2020 & 2033
- Table 45: Global Liquid Waste Management Industry Revenue Million Forecast, by End-user Industry 2020 & 2033
- Table 46: Global Liquid Waste Management Industry Volume Billion Forecast, by End-user Industry 2020 & 2033
- Table 47: Global Liquid Waste Management Industry Revenue Million Forecast, by Country 2020 & 2033
- Table 48: Global Liquid Waste Management Industry Volume Billion Forecast, by Country 2020 & 2033
- Table 49: Germany Liquid Waste Management Industry Revenue (Million) Forecast, by Application 2020 & 2033
- Table 50: Germany Liquid Waste Management Industry Volume (Billion) Forecast, by Application 2020 & 2033
- Table 51: United Kingdom Liquid Waste Management Industry Revenue (Million) Forecast, by Application 2020 & 2033
- Table 52: United Kingdom Liquid Waste Management Industry Volume (Billion) Forecast, by Application 2020 & 2033
- Table 53: France Liquid Waste Management Industry Revenue (Million) Forecast, by Application 2020 & 2033
- Table 54: France Liquid Waste Management Industry Volume (Billion) Forecast, by Application 2020 & 2033
- Table 55: Italy Liquid Waste Management Industry Revenue (Million) Forecast, by Application 2020 & 2033
- Table 56: Italy Liquid Waste Management Industry Volume (Billion) Forecast, by Application 2020 & 2033
- Table 57: Rest of Europe Liquid Waste Management Industry Revenue (Million) Forecast, by Application 2020 & 2033
- Table 58: Rest of Europe Liquid Waste Management Industry Volume (Billion) Forecast, by Application 2020 & 2033
- Table 59: Global Liquid Waste Management Industry Revenue Million Forecast, by Source 2020 & 2033
- Table 60: Global Liquid Waste Management Industry Volume Billion Forecast, by Source 2020 & 2033
- Table 61: Global Liquid Waste Management Industry Revenue Million Forecast, by Service 2020 & 2033
- Table 62: Global Liquid Waste Management Industry Volume Billion Forecast, by Service 2020 & 2033
- Table 63: Global Liquid Waste Management Industry Revenue Million Forecast, by End-user Industry 2020 & 2033
- Table 64: Global Liquid Waste Management Industry Volume Billion Forecast, by End-user Industry 2020 & 2033
- Table 65: Global Liquid Waste Management Industry Revenue Million Forecast, by Country 2020 & 2033
- Table 66: Global Liquid Waste Management Industry Volume Billion Forecast, by Country 2020 & 2033
- Table 67: Brazil Liquid Waste Management Industry Revenue (Million) Forecast, by Application 2020 & 2033
- Table 68: Brazil Liquid Waste Management Industry Volume (Billion) Forecast, by Application 2020 & 2033
- Table 69: Argentina Liquid Waste Management Industry Revenue (Million) Forecast, by Application 2020 & 2033
- Table 70: Argentina Liquid Waste Management Industry Volume (Billion) Forecast, by Application 2020 & 2033
- Table 71: Rest of South America Liquid Waste Management Industry Revenue (Million) Forecast, by Application 2020 & 2033
- Table 72: Rest of South America Liquid Waste Management Industry Volume (Billion) Forecast, by Application 2020 & 2033
- Table 73: Global Liquid Waste Management Industry Revenue Million Forecast, by Source 2020 & 2033
- Table 74: Global Liquid Waste Management Industry Volume Billion Forecast, by Source 2020 & 2033
- Table 75: Global Liquid Waste Management Industry Revenue Million Forecast, by Service 2020 & 2033
- Table 76: Global Liquid Waste Management Industry Volume Billion Forecast, by Service 2020 & 2033
- Table 77: Global Liquid Waste Management Industry Revenue Million Forecast, by End-user Industry 2020 & 2033
- Table 78: Global Liquid Waste Management Industry Volume Billion Forecast, by End-user Industry 2020 & 2033
- Table 79: Global Liquid Waste Management Industry Revenue Million Forecast, by Country 2020 & 2033
- Table 80: Global Liquid Waste Management Industry Volume Billion Forecast, by Country 2020 & 2033
- Table 81: Saudi Arabia Liquid Waste Management Industry Revenue (Million) Forecast, by Application 2020 & 2033
- Table 82: Saudi Arabia Liquid Waste Management Industry Volume (Billion) Forecast, by Application 2020 & 2033
- Table 83: South Africa Liquid Waste Management Industry Revenue (Million) Forecast, by Application 2020 & 2033
- Table 84: South Africa Liquid Waste Management Industry Volume (Billion) Forecast, by Application 2020 & 2033
- Table 85: Rest of Middle East and Africa Liquid Waste Management Industry Revenue (Million) Forecast, by Application 2020 & 2033
- Table 86: Rest of Middle East and Africa Liquid Waste Management Industry Volume (Billion) Forecast, by Application 2020 & 2033
Frequently Asked Questions
1. What is the projected Compound Annual Growth Rate (CAGR) of the Liquid Waste Management Industry?
The projected CAGR is approximately > 4.00%.
2. Which companies are prominent players in the Liquid Waste Management Industry?
Key companies in the market include CLEAN HARBORS INC, Cleanaway, Covanta Holding Corporation, Enva, GFL Environmental Inc, Hulsey (a Blue Flow Company), Ovivo, REMONDIS SE & Co KG, SUEZ, Veolia, WM Intellectual Property Holdings L L C *List Not Exhaustive.
3. What are the main segments of the Liquid Waste Management Industry?
The market segments include Source, Service, End-user Industry.
4. Can you provide details about the market size?
The market size is estimated to be USD 89.29 Million as of 2022.
5. What are some drivers contributing to market growth?
Growth in the Pharmaceutical and Healthcare Industry; Increased Manufacturing Activities Containing Toxic Chemicals Leading to Growing Liquid Effluent Management; Other Drivers.
6. What are the notable trends driving market growth?
Oil and Gas Segment to Dominate the Market.
7. Are there any restraints impacting market growth?
Growth in the Pharmaceutical and Healthcare Industry; Increased Manufacturing Activities Containing Toxic Chemicals Leading to Growing Liquid Effluent Management; Other Drivers.
8. Can you provide examples of recent developments in the market?
October 2023: SUEZ Recycling and Recovery UK completed the acquisition of Devon Contract Waste (DCW), a prominent recycling and waste management company. This strategic move is aimed at enhancing SUEZ's global position within the waste sector.
9. What pricing options are available for accessing the report?
Pricing options include single-user, multi-user, and enterprise licenses priced at USD 4750, USD 5250, and USD 8750 respectively.
10. Is the market size provided in terms of value or volume?
The market size is provided in terms of value, measured in Million and volume, measured in Billion.
11. Are there any specific market keywords associated with the report?
Yes, the market keyword associated with the report is "Liquid Waste Management Industry," which aids in identifying and referencing the specific market segment covered.
12. How do I determine which pricing option suits my needs best?
The pricing options vary based on user requirements and access needs. Individual users may opt for single-user licenses, while businesses requiring broader access may choose multi-user or enterprise licenses for cost-effective access to the report.
13. Are there any additional resources or data provided in the Liquid Waste Management Industry report?
While the report offers comprehensive insights, it's advisable to review the specific contents or supplementary materials provided to ascertain if additional resources or data are available.
14. How can I stay updated on further developments or reports in the Liquid Waste Management Industry?
To stay informed about further developments, trends, and reports in the Liquid Waste Management Industry, consider subscribing to industry newsletters, following relevant companies and organizations, or regularly checking reputable industry news sources and publications.
Methodology
Step 1 - Identification of Relevant Samples Size from Population Database


Step 2 - Approaches for Defining Global Market Size (Value, Volume* & Price*)

Note*: In applicable scenarios
Step 3 - Data Sources
Primary Research
- Web Analytics
- Survey Reports
- Research Institute
- Latest Research Reports
- Opinion Leaders
Secondary Research
- Annual Reports
- White Paper
- Latest Press Release
- Industry Association
- Paid Database
- Investor Presentations

Step 4 - Data Triangulation
Involves using different sources of information in order to increase the validity of a study
These sources are likely to be stakeholders in a program - participants, other researchers, program staff, other community members, and so on.
Then we put all data in single framework & apply various statistical tools to find out the dynamic on the market.
During the analysis stage, feedback from the stakeholder groups would be compared to determine areas of agreement as well as areas of divergence