

Key Insights
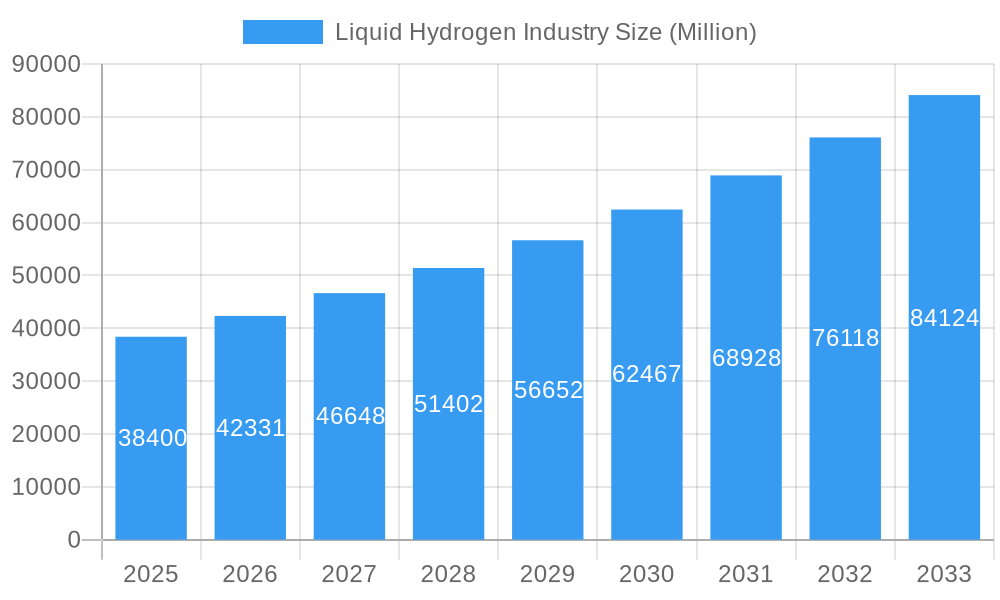
The liquid hydrogen market, valued at $38,400 million in 2025, is projected to experience robust growth, driven by the increasing demand for clean energy and its crucial role in various sectors. A compound annual growth rate (CAGR) of 10.27% from 2025 to 2033 indicates significant expansion. Key drivers include the burgeoning automotive industry's adoption of fuel cell electric vehicles (FCEVs), the aerospace sector's utilization of liquid hydrogen for rocket propulsion and space exploration, and the growing marine industry's interest in hydrogen-powered ships. Furthermore, supportive government policies aimed at reducing carbon emissions and promoting renewable energy sources are fueling market growth. While challenges remain, such as the high cost of production and storage, coupled with the need for robust infrastructure development, ongoing technological advancements are addressing these limitations. The market segmentation reveals significant contributions from cryogenic tank and high-pressure tube trailer distribution methods, with substantial demand stemming from automotive, aerospace, and marine end-user industries. Geographic analysis reveals strong growth prospects across North America, Europe, and Asia Pacific, fueled by substantial investments in hydrogen infrastructure and government incentives.
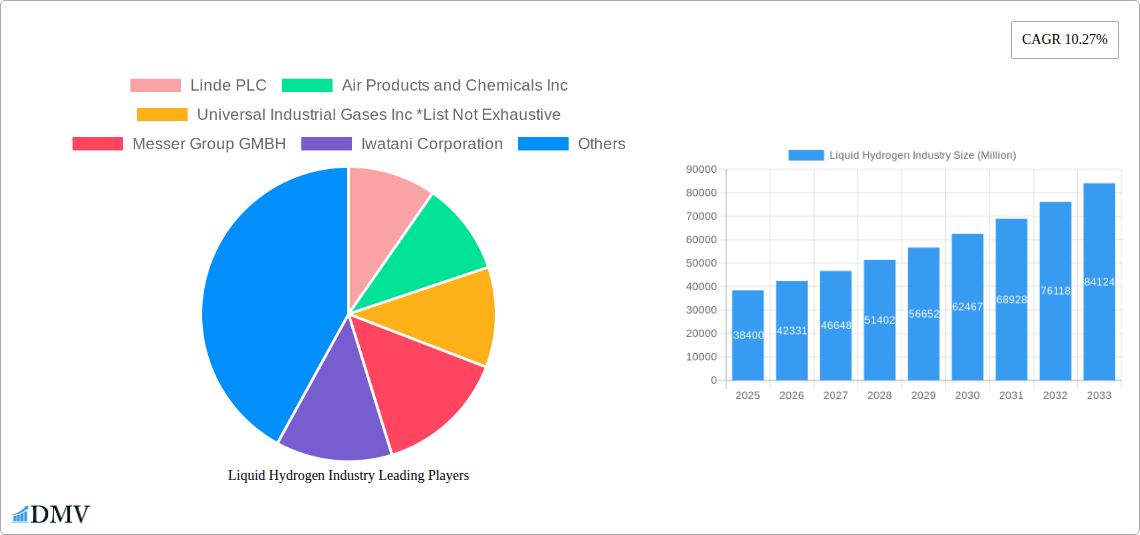
Liquid Hydrogen Industry Market Size (In Billion)
The competitive landscape is characterized by both established players and emerging companies, leading to innovation and competition. Major companies like Linde PLC, Air Products and Chemicals Inc., and Air Liquide are actively involved in expanding their liquid hydrogen production and distribution capabilities. The involvement of companies like ITM Power indicates a growing interest in the electrolysis-based production of green hydrogen. The market’s trajectory suggests that continued innovation in production technologies, coupled with supportive regulatory frameworks and increasing investments, will propel the liquid hydrogen market to greater heights over the forecast period, especially considering the intensifying global focus on decarbonization efforts. This presents substantial opportunities for businesses across the entire value chain, from production and distribution to end-use applications.
Liquid Hydrogen Industry Company Market Share
Liquid Hydrogen Industry: A Comprehensive Market Report (2019-2033)
This insightful report provides a detailed analysis of the Liquid Hydrogen Industry, encompassing market size, growth drivers, challenges, and future opportunities. The study period covers 2019-2033, with a base year of 2025 and a forecast period of 2025-2033. The report examines key segments, leading players, and recent industry developments, offering crucial insights for stakeholders seeking to navigate this rapidly evolving market. The global market is projected to reach xx Million by 2033.
Liquid Hydrogen Industry Market Composition & Trends
This section delves into the competitive landscape of the liquid hydrogen market, evaluating market concentration, innovation drivers, regulatory frameworks, substitute products, end-user profiles, and mergers & acquisitions (M&A) activity. The report analyzes market share distribution amongst key players like Linde PLC, Air Products and Chemicals Inc., Messer Group GMBH, Iwatani Corporation, Air Liquide, Nippon Sanso Holdings Corporation, and Praxair Technology Inc., along with emerging players like ITM Power and Universal Industrial Gases Inc. Analysis will include an assessment of the impact of recent M&A activities, with estimated deal values providing a clear picture of market consolidation. The report also examines the influence of government regulations and incentives on market growth, analyzing the impact of various policies on production, distribution, and adoption of liquid hydrogen. Furthermore, the report will explore the potential influence of substitute fuels and technologies on the market's future trajectory. Specific end-user industry analysis will be provided, exploring demand drivers within automotive, aerospace, marine, and other sectors.
- Market Share Distribution: Linde PLC holds an estimated xx% market share in 2025, followed by Air Products and Chemicals Inc. with xx%.
- M&A Activity: Analysis of significant M&A deals in the period 2019-2024, including deal values (in Millions).
- Innovation Catalysts: Assessment of technological advancements driving market growth and their impact on market dynamics.
- Regulatory Landscape: A detailed overview of key regulations impacting the liquid hydrogen market globally.
Liquid Hydrogen Industry Industry Evolution
This section provides a comprehensive analysis of the liquid hydrogen industry's evolution, covering market growth trajectories, technological advancements, and shifting consumer demands. We present a detailed analysis of historical and projected growth rates, supported by market size estimations for the study period (2019-2033). The report will incorporate various data points, including adoption metrics within key end-user sectors, and highlight technological advancements impacting production efficiency, storage, and transportation. Further, we examine the evolution of consumer demands and the impact of changing regulatory frameworks on the industry's trajectory. The analysis will detail factors such as the increasing demand for clean energy, the growing awareness of environmental concerns, and the ongoing development of hydrogen infrastructure. The report will also analyze the impact of government incentives and regulations on the market's growth trajectory.
Leading Regions, Countries, or Segments in Liquid Hydrogen Industry
This section identifies the leading regions, countries, and segments within the liquid hydrogen industry, analyzing dominance factors through a detailed examination of market share, investment trends, and regulatory support within Distribution (Cryogenic Tank, High-Pressure Tube Trailers) and End-user Industries (Automotive, Aerospace, Marine, Other).
Key Drivers:
- Investment Trends: Analysis of significant investments in production facilities, infrastructure development, and R&D.
- Regulatory Support: Evaluation of the role of government policies and incentives in shaping market dominance.
Dominance Factors: In-depth analysis of factors contributing to the leading position of specific regions, countries, or segments, backed by data and insights.
Liquid Hydrogen Industry Product Innovations
This section showcases recent product innovations in liquid hydrogen technologies, highlighting unique selling propositions (USPs) and technological advancements that have improved efficiency, safety, and cost-effectiveness. Analysis will include examples of improved cryogenic tank designs, advancements in high-pressure tube trailer technology, and innovative applications within the end-user sectors.
Propelling Factors for Liquid Hydrogen Industry Growth
This section outlines the key growth drivers propelling the liquid hydrogen industry, focusing on technological advancements in production, storage, and transportation; economic factors, such as decreasing production costs and increasing demand from various sectors; and the supportive regulatory environment with examples of government policies and incentives that are fostering industry development.
Obstacles in the Liquid Hydrogen Industry Market
This section discusses the barriers and restraints hindering the liquid hydrogen industry's growth. We identify and quantify the impact of regulatory hurdles, supply chain disruptions, and competitive pressures, including challenges related to infrastructure development, high production costs, and safety concerns.
Future Opportunities in Liquid Hydrogen Industry
This section highlights emerging opportunities in the liquid hydrogen industry, focusing on new markets (e.g., developing economies), technological advancements (e.g., improved storage solutions), and evolving consumer trends (e.g., increased demand for sustainable transportation).
Major Players in the Liquid Hydrogen Industry Ecosystem
- Linde PLC (Linde PLC)
- Air Products and Chemicals Inc. (Air Products and Chemicals Inc.)
- Universal Industrial Gases Inc.
- Messer Group GMBH (Messer Group GMBH)
- Iwatani Corporation (Iwatani Corporation)
- Air Liquide (Air Liquide)
- Nippon Sanso Holdings Corporation (Nippon Sanso Holdings Corporation)
- Praxair Technology Inc.
- ITM Power (ITM Power)
Key Developments in Liquid Hydrogen Industry Industry
- May 2022: Air Liquide invested USD 250 Million and established its largest liquid hydrogen production and logistics infrastructure complex in North Las Vegas, Nevada. This significantly increased liquid hydrogen production capacity in the US and showcased commitment to the hydrogen mobility industry.
- Sept 2022: Linde announced the construction of a 35-megawatt PEM electrolyzer in Niagara Falls, New York, representing the largest electrolyzer installed by Linde globally and boosting green liquid hydrogen production capacity in the US.
- Mar 2023: Iwatani Corporation and ENEOS Corporation launched a "Liquefied Hydrogen Supply Chain Commercialization Demonstration Project," aiming to develop marine transportation technologies for liquefied clean hydrogen and reduce hydrogen supply costs to 30 JPY/Nm3 by 2030.
Strategic Liquid Hydrogen Industry Market Forecast
This section summarizes the growth catalysts and future market potential for the liquid hydrogen industry, forecasting continued growth driven by technological advancements, increasing demand from various sectors, and supportive government policies. The forecast considers the evolving competitive landscape and potential challenges, providing a balanced outlook for the industry's future. The report emphasizes the long-term opportunities for companies involved in production, storage, distribution, and end-use applications of liquid hydrogen.
Liquid Hydrogen Industry Segmentation
-
1. Distribution
- 1.1. Cryogenic Tank
- 1.2. High-Pressure Tube Trailers
-
2. End-user Industry
- 2.1. Automotive
- 2.2. Aerospace (including Outer Space)
- 2.3. Marine
- 2.4. Other End-User Industries
Liquid Hydrogen Industry Segmentation By Geography
-
1. Asia Pacific
- 1.1. China
- 1.2. India
- 1.3. Japan
- 1.4. South Korea
- 1.5. Rest of Asia Pacific
-
2. North America
- 2.1. United States
- 2.2. Canada
- 2.3. Mexico
-
3. Europe
- 3.1. Germany
- 3.2. United Kingdom
- 3.3. Italy
- 3.4. France
- 3.5. Rest of Europe
-
4. Rest of the World
- 4.1. South America
- 4.2. Middle East and Africa
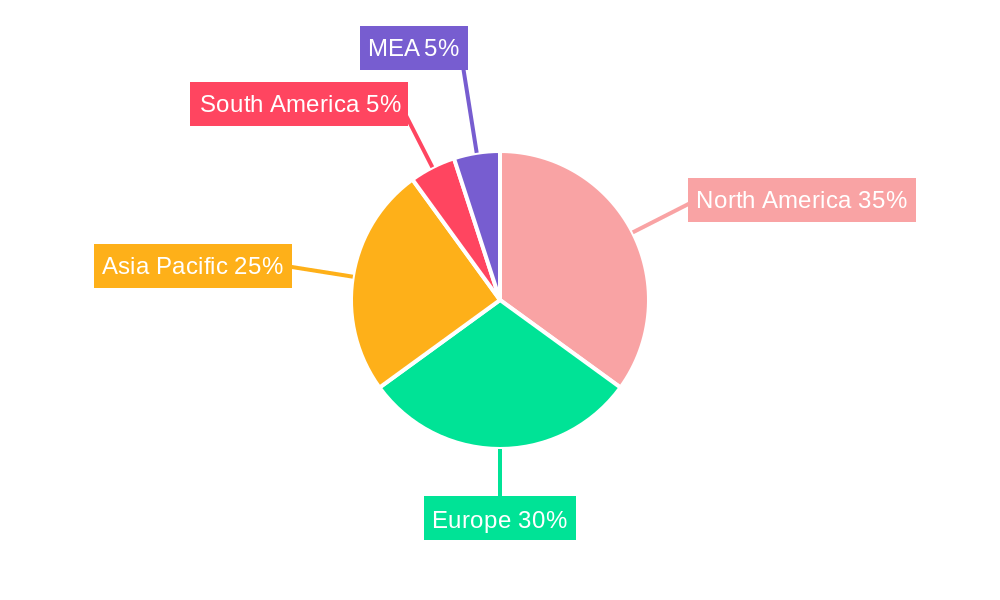
Liquid Hydrogen Industry Regional Market Share
Geographic Coverage of Liquid Hydrogen Industry
Liquid Hydrogen Industry REPORT HIGHLIGHTS
| Aspects | Details |
|---|---|
| Study Period | 2020-2034 |
| Base Year | 2025 |
| Estimated Year | 2026 |
| Forecast Period | 2026-2034 |
| Historical Period | 2020-2025 |
| Growth Rate | CAGR of 10.27% from 2020-2034 |
| Segmentation |
|
Table of Contents
- 1. Introduction
- 1.1. Research Scope
- 1.2. Market Segmentation
- 1.3. Research Objective
- 1.4. Definitions and Assumptions
- 2. Executive Summary
- 2.1. Market Snapshot
- 3. Market Dynamics
- 3.1. Market Drivers
- 3.2. Market Restrains
- 3.3. Market Trends
- 3.4. Market Opportunities
- 4. Market Factor Analysis
- 4.1. Porters Five Forces
- 4.1.1. Bargaining Power of Suppliers
- 4.1.2. Bargaining Power of Buyers
- 4.1.3. Threat of New Entrants
- 4.1.4. Threat of Substitutes
- 4.1.5. Competitive Rivalry
- 4.2. PESTEL analysis
- 4.3. BCG Analysis
- 4.3.1. Stars (High Growth, High Market Share)
- 4.3.2. Cash Cows (Low Growth, High Market Share)
- 4.3.3. Question Mark (High Growth, Low Market Share)
- 4.3.4. Dogs (Low Growth, Low Market Share)
- 4.4. Ansoff Matrix Analysis
- 4.5. Supply Chain Analysis
- 4.6. Regulatory Landscape
- 4.7. Current Market Potential and Opportunity Assessment (TAM–SAM–SOM Framework)
- 4.8. DMV Analyst Note
- 4.1. Porters Five Forces
- 5. Market Analysis, Insights and Forecast 2021-2033
- 5.1. Market Analysis, Insights and Forecast - by Distribution
- 5.1.1. Cryogenic Tank
- 5.1.2. High-Pressure Tube Trailers
- 5.2. Market Analysis, Insights and Forecast - by End-user Industry
- 5.2.1. Automotive
- 5.2.2. Aerospace (including Outer Space)
- 5.2.3. Marine
- 5.2.4. Other End-User Industries
- 5.3. Market Analysis, Insights and Forecast - by Region
- 5.3.1. Asia Pacific
- 5.3.2. North America
- 5.3.3. Europe
- 5.3.4. Rest of the World
- 5.1. Market Analysis, Insights and Forecast - by Distribution
- 6. Global Liquid Hydrogen Industry Analysis, Insights and Forecast, 2021-2033
- 6.1. Market Analysis, Insights and Forecast - by Distribution
- 6.1.1. Cryogenic Tank
- 6.1.2. High-Pressure Tube Trailers
- 6.2. Market Analysis, Insights and Forecast - by End-user Industry
- 6.2.1. Automotive
- 6.2.2. Aerospace (including Outer Space)
- 6.2.3. Marine
- 6.2.4. Other End-User Industries
- 6.1. Market Analysis, Insights and Forecast - by Distribution
- 7. Asia Pacific Liquid Hydrogen Industry Analysis, Insights and Forecast, 2020-2032
- 7.1. Market Analysis, Insights and Forecast - by Distribution
- 7.1.1. Cryogenic Tank
- 7.1.2. High-Pressure Tube Trailers
- 7.2. Market Analysis, Insights and Forecast - by End-user Industry
- 7.2.1. Automotive
- 7.2.2. Aerospace (including Outer Space)
- 7.2.3. Marine
- 7.2.4. Other End-User Industries
- 7.1. Market Analysis, Insights and Forecast - by Distribution
- 8. North America Liquid Hydrogen Industry Analysis, Insights and Forecast, 2020-2032
- 8.1. Market Analysis, Insights and Forecast - by Distribution
- 8.1.1. Cryogenic Tank
- 8.1.2. High-Pressure Tube Trailers
- 8.2. Market Analysis, Insights and Forecast - by End-user Industry
- 8.2.1. Automotive
- 8.2.2. Aerospace (including Outer Space)
- 8.2.3. Marine
- 8.2.4. Other End-User Industries
- 8.1. Market Analysis, Insights and Forecast - by Distribution
- 9. Europe Liquid Hydrogen Industry Analysis, Insights and Forecast, 2020-2032
- 9.1. Market Analysis, Insights and Forecast - by Distribution
- 9.1.1. Cryogenic Tank
- 9.1.2. High-Pressure Tube Trailers
- 9.2. Market Analysis, Insights and Forecast - by End-user Industry
- 9.2.1. Automotive
- 9.2.2. Aerospace (including Outer Space)
- 9.2.3. Marine
- 9.2.4. Other End-User Industries
- 9.1. Market Analysis, Insights and Forecast - by Distribution
- 10. Rest of the World Liquid Hydrogen Industry Analysis, Insights and Forecast, 2020-2032
- 10.1. Market Analysis, Insights and Forecast - by Distribution
- 10.1.1. Cryogenic Tank
- 10.1.2. High-Pressure Tube Trailers
- 10.2. Market Analysis, Insights and Forecast - by End-user Industry
- 10.2.1. Automotive
- 10.2.2. Aerospace (including Outer Space)
- 10.2.3. Marine
- 10.2.4. Other End-User Industries
- 10.1. Market Analysis, Insights and Forecast - by Distribution
- 11. Competitive Analysis
- 11.1. Company Profiles
- 11.1.1 Linde PLC
- 11.1.1.1. Company Overview
- 11.1.1.2. Products
- 11.1.1.3. Company Financials
- 11.1.1.4. SWOT Analysis
- 11.1.2 Air Products and Chemicals Inc
- 11.1.2.1. Company Overview
- 11.1.2.2. Products
- 11.1.2.3. Company Financials
- 11.1.2.4. SWOT Analysis
- 11.1.3 Universal Industrial Gases Inc *List Not Exhaustive
- 11.1.3.1. Company Overview
- 11.1.3.2. Products
- 11.1.3.3. Company Financials
- 11.1.3.4. SWOT Analysis
- 11.1.4 Messer Group GMBH
- 11.1.4.1. Company Overview
- 11.1.4.2. Products
- 11.1.4.3. Company Financials
- 11.1.4.4. SWOT Analysis
- 11.1.5 Iwatani Corporation
- 11.1.5.1. Company Overview
- 11.1.5.2. Products
- 11.1.5.3. Company Financials
- 11.1.5.4. SWOT Analysis
- 11.1.6 Air Liquide
- 11.1.6.1. Company Overview
- 11.1.6.2. Products
- 11.1.6.3. Company Financials
- 11.1.6.4. SWOT Analysis
- 11.1.7 Nippon Sanso Holdings Corporation
- 11.1.7.1. Company Overview
- 11.1.7.2. Products
- 11.1.7.3. Company Financials
- 11.1.7.4. SWOT Analysis
- 11.1.8 Nippon Sanso Holdings Corporation
- 11.1.8.1. Company Overview
- 11.1.8.2. Products
- 11.1.8.3. Company Financials
- 11.1.8.4. SWOT Analysis
- 11.1.9 Praxair Technology Inc.
- 11.1.9.1. Company Overview
- 11.1.9.2. Products
- 11.1.9.3. Company Financials
- 11.1.9.4. SWOT Analysis
- 11.1.10 ITM Power
- 11.1.10.1. Company Overview
- 11.1.10.2. Products
- 11.1.10.3. Company Financials
- 11.1.10.4. SWOT Analysis
- 11.1.1 Linde PLC
- 11.2. Market Entropy
- 11.2.1 Company's Key Areas Served
- 11.2.2 Recent Developments
- 11.3. Company Market Share Analysis 2025
- 11.3.1 Top 5 Companies Market Share Analysis
- 11.3.2 Top 3 Companies Market Share Analysis
- 11.4. List of Potential Customers
- 12. Research Methodology
List of Figures
- Figure 1: Global Liquid Hydrogen Industry Revenue Breakdown (Million, %) by Region 2025 & 2033
- Figure 2: Global Liquid Hydrogen Industry Volume Breakdown (kilotons, %) by Region 2025 & 2033
- Figure 3: Asia Pacific Liquid Hydrogen Industry Revenue (Million), by Distribution 2025 & 2033
- Figure 4: Asia Pacific Liquid Hydrogen Industry Volume (kilotons), by Distribution 2025 & 2033
- Figure 5: Asia Pacific Liquid Hydrogen Industry Revenue Share (%), by Distribution 2025 & 2033
- Figure 6: Asia Pacific Liquid Hydrogen Industry Volume Share (%), by Distribution 2025 & 2033
- Figure 7: Asia Pacific Liquid Hydrogen Industry Revenue (Million), by End-user Industry 2025 & 2033
- Figure 8: Asia Pacific Liquid Hydrogen Industry Volume (kilotons), by End-user Industry 2025 & 2033
- Figure 9: Asia Pacific Liquid Hydrogen Industry Revenue Share (%), by End-user Industry 2025 & 2033
- Figure 10: Asia Pacific Liquid Hydrogen Industry Volume Share (%), by End-user Industry 2025 & 2033
- Figure 11: Asia Pacific Liquid Hydrogen Industry Revenue (Million), by Country 2025 & 2033
- Figure 12: Asia Pacific Liquid Hydrogen Industry Volume (kilotons), by Country 2025 & 2033
- Figure 13: Asia Pacific Liquid Hydrogen Industry Revenue Share (%), by Country 2025 & 2033
- Figure 14: Asia Pacific Liquid Hydrogen Industry Volume Share (%), by Country 2025 & 2033
- Figure 15: North America Liquid Hydrogen Industry Revenue (Million), by Distribution 2025 & 2033
- Figure 16: North America Liquid Hydrogen Industry Volume (kilotons), by Distribution 2025 & 2033
- Figure 17: North America Liquid Hydrogen Industry Revenue Share (%), by Distribution 2025 & 2033
- Figure 18: North America Liquid Hydrogen Industry Volume Share (%), by Distribution 2025 & 2033
- Figure 19: North America Liquid Hydrogen Industry Revenue (Million), by End-user Industry 2025 & 2033
- Figure 20: North America Liquid Hydrogen Industry Volume (kilotons), by End-user Industry 2025 & 2033
- Figure 21: North America Liquid Hydrogen Industry Revenue Share (%), by End-user Industry 2025 & 2033
- Figure 22: North America Liquid Hydrogen Industry Volume Share (%), by End-user Industry 2025 & 2033
- Figure 23: North America Liquid Hydrogen Industry Revenue (Million), by Country 2025 & 2033
- Figure 24: North America Liquid Hydrogen Industry Volume (kilotons), by Country 2025 & 2033
- Figure 25: North America Liquid Hydrogen Industry Revenue Share (%), by Country 2025 & 2033
- Figure 26: North America Liquid Hydrogen Industry Volume Share (%), by Country 2025 & 2033
- Figure 27: Europe Liquid Hydrogen Industry Revenue (Million), by Distribution 2025 & 2033
- Figure 28: Europe Liquid Hydrogen Industry Volume (kilotons), by Distribution 2025 & 2033
- Figure 29: Europe Liquid Hydrogen Industry Revenue Share (%), by Distribution 2025 & 2033
- Figure 30: Europe Liquid Hydrogen Industry Volume Share (%), by Distribution 2025 & 2033
- Figure 31: Europe Liquid Hydrogen Industry Revenue (Million), by End-user Industry 2025 & 2033
- Figure 32: Europe Liquid Hydrogen Industry Volume (kilotons), by End-user Industry 2025 & 2033
- Figure 33: Europe Liquid Hydrogen Industry Revenue Share (%), by End-user Industry 2025 & 2033
- Figure 34: Europe Liquid Hydrogen Industry Volume Share (%), by End-user Industry 2025 & 2033
- Figure 35: Europe Liquid Hydrogen Industry Revenue (Million), by Country 2025 & 2033
- Figure 36: Europe Liquid Hydrogen Industry Volume (kilotons), by Country 2025 & 2033
- Figure 37: Europe Liquid Hydrogen Industry Revenue Share (%), by Country 2025 & 2033
- Figure 38: Europe Liquid Hydrogen Industry Volume Share (%), by Country 2025 & 2033
- Figure 39: Rest of the World Liquid Hydrogen Industry Revenue (Million), by Distribution 2025 & 2033
- Figure 40: Rest of the World Liquid Hydrogen Industry Volume (kilotons), by Distribution 2025 & 2033
- Figure 41: Rest of the World Liquid Hydrogen Industry Revenue Share (%), by Distribution 2025 & 2033
- Figure 42: Rest of the World Liquid Hydrogen Industry Volume Share (%), by Distribution 2025 & 2033
- Figure 43: Rest of the World Liquid Hydrogen Industry Revenue (Million), by End-user Industry 2025 & 2033
- Figure 44: Rest of the World Liquid Hydrogen Industry Volume (kilotons), by End-user Industry 2025 & 2033
- Figure 45: Rest of the World Liquid Hydrogen Industry Revenue Share (%), by End-user Industry 2025 & 2033
- Figure 46: Rest of the World Liquid Hydrogen Industry Volume Share (%), by End-user Industry 2025 & 2033
- Figure 47: Rest of the World Liquid Hydrogen Industry Revenue (Million), by Country 2025 & 2033
- Figure 48: Rest of the World Liquid Hydrogen Industry Volume (kilotons), by Country 2025 & 2033
- Figure 49: Rest of the World Liquid Hydrogen Industry Revenue Share (%), by Country 2025 & 2033
- Figure 50: Rest of the World Liquid Hydrogen Industry Volume Share (%), by Country 2025 & 2033
List of Tables
- Table 1: Global Liquid Hydrogen Industry Revenue Million Forecast, by Distribution 2020 & 2033
- Table 2: Global Liquid Hydrogen Industry Volume kilotons Forecast, by Distribution 2020 & 2033
- Table 3: Global Liquid Hydrogen Industry Revenue Million Forecast, by End-user Industry 2020 & 2033
- Table 4: Global Liquid Hydrogen Industry Volume kilotons Forecast, by End-user Industry 2020 & 2033
- Table 5: Global Liquid Hydrogen Industry Revenue Million Forecast, by Region 2020 & 2033
- Table 6: Global Liquid Hydrogen Industry Volume kilotons Forecast, by Region 2020 & 2033
- Table 7: Global Liquid Hydrogen Industry Revenue Million Forecast, by Distribution 2020 & 2033
- Table 8: Global Liquid Hydrogen Industry Volume kilotons Forecast, by Distribution 2020 & 2033
- Table 9: Global Liquid Hydrogen Industry Revenue Million Forecast, by End-user Industry 2020 & 2033
- Table 10: Global Liquid Hydrogen Industry Volume kilotons Forecast, by End-user Industry 2020 & 2033
- Table 11: Global Liquid Hydrogen Industry Revenue Million Forecast, by Country 2020 & 2033
- Table 12: Global Liquid Hydrogen Industry Volume kilotons Forecast, by Country 2020 & 2033
- Table 13: China Liquid Hydrogen Industry Revenue (Million) Forecast, by Application 2020 & 2033
- Table 14: China Liquid Hydrogen Industry Volume (kilotons) Forecast, by Application 2020 & 2033
- Table 15: India Liquid Hydrogen Industry Revenue (Million) Forecast, by Application 2020 & 2033
- Table 16: India Liquid Hydrogen Industry Volume (kilotons) Forecast, by Application 2020 & 2033
- Table 17: Japan Liquid Hydrogen Industry Revenue (Million) Forecast, by Application 2020 & 2033
- Table 18: Japan Liquid Hydrogen Industry Volume (kilotons) Forecast, by Application 2020 & 2033
- Table 19: South Korea Liquid Hydrogen Industry Revenue (Million) Forecast, by Application 2020 & 2033
- Table 20: South Korea Liquid Hydrogen Industry Volume (kilotons) Forecast, by Application 2020 & 2033
- Table 21: Rest of Asia Pacific Liquid Hydrogen Industry Revenue (Million) Forecast, by Application 2020 & 2033
- Table 22: Rest of Asia Pacific Liquid Hydrogen Industry Volume (kilotons) Forecast, by Application 2020 & 2033
- Table 23: Global Liquid Hydrogen Industry Revenue Million Forecast, by Distribution 2020 & 2033
- Table 24: Global Liquid Hydrogen Industry Volume kilotons Forecast, by Distribution 2020 & 2033
- Table 25: Global Liquid Hydrogen Industry Revenue Million Forecast, by End-user Industry 2020 & 2033
- Table 26: Global Liquid Hydrogen Industry Volume kilotons Forecast, by End-user Industry 2020 & 2033
- Table 27: Global Liquid Hydrogen Industry Revenue Million Forecast, by Country 2020 & 2033
- Table 28: Global Liquid Hydrogen Industry Volume kilotons Forecast, by Country 2020 & 2033
- Table 29: United States Liquid Hydrogen Industry Revenue (Million) Forecast, by Application 2020 & 2033
- Table 30: United States Liquid Hydrogen Industry Volume (kilotons) Forecast, by Application 2020 & 2033
- Table 31: Canada Liquid Hydrogen Industry Revenue (Million) Forecast, by Application 2020 & 2033
- Table 32: Canada Liquid Hydrogen Industry Volume (kilotons) Forecast, by Application 2020 & 2033
- Table 33: Mexico Liquid Hydrogen Industry Revenue (Million) Forecast, by Application 2020 & 2033
- Table 34: Mexico Liquid Hydrogen Industry Volume (kilotons) Forecast, by Application 2020 & 2033
- Table 35: Global Liquid Hydrogen Industry Revenue Million Forecast, by Distribution 2020 & 2033
- Table 36: Global Liquid Hydrogen Industry Volume kilotons Forecast, by Distribution 2020 & 2033
- Table 37: Global Liquid Hydrogen Industry Revenue Million Forecast, by End-user Industry 2020 & 2033
- Table 38: Global Liquid Hydrogen Industry Volume kilotons Forecast, by End-user Industry 2020 & 2033
- Table 39: Global Liquid Hydrogen Industry Revenue Million Forecast, by Country 2020 & 2033
- Table 40: Global Liquid Hydrogen Industry Volume kilotons Forecast, by Country 2020 & 2033
- Table 41: Germany Liquid Hydrogen Industry Revenue (Million) Forecast, by Application 2020 & 2033
- Table 42: Germany Liquid Hydrogen Industry Volume (kilotons) Forecast, by Application 2020 & 2033
- Table 43: United Kingdom Liquid Hydrogen Industry Revenue (Million) Forecast, by Application 2020 & 2033
- Table 44: United Kingdom Liquid Hydrogen Industry Volume (kilotons) Forecast, by Application 2020 & 2033
- Table 45: Italy Liquid Hydrogen Industry Revenue (Million) Forecast, by Application 2020 & 2033
- Table 46: Italy Liquid Hydrogen Industry Volume (kilotons) Forecast, by Application 2020 & 2033
- Table 47: France Liquid Hydrogen Industry Revenue (Million) Forecast, by Application 2020 & 2033
- Table 48: France Liquid Hydrogen Industry Volume (kilotons) Forecast, by Application 2020 & 2033
- Table 49: Rest of Europe Liquid Hydrogen Industry Revenue (Million) Forecast, by Application 2020 & 2033
- Table 50: Rest of Europe Liquid Hydrogen Industry Volume (kilotons) Forecast, by Application 2020 & 2033
- Table 51: Global Liquid Hydrogen Industry Revenue Million Forecast, by Distribution 2020 & 2033
- Table 52: Global Liquid Hydrogen Industry Volume kilotons Forecast, by Distribution 2020 & 2033
- Table 53: Global Liquid Hydrogen Industry Revenue Million Forecast, by End-user Industry 2020 & 2033
- Table 54: Global Liquid Hydrogen Industry Volume kilotons Forecast, by End-user Industry 2020 & 2033
- Table 55: Global Liquid Hydrogen Industry Revenue Million Forecast, by Country 2020 & 2033
- Table 56: Global Liquid Hydrogen Industry Volume kilotons Forecast, by Country 2020 & 2033
- Table 57: South America Liquid Hydrogen Industry Revenue (Million) Forecast, by Application 2020 & 2033
- Table 58: South America Liquid Hydrogen Industry Volume (kilotons) Forecast, by Application 2020 & 2033
- Table 59: Middle East and Africa Liquid Hydrogen Industry Revenue (Million) Forecast, by Application 2020 & 2033
- Table 60: Middle East and Africa Liquid Hydrogen Industry Volume (kilotons) Forecast, by Application 2020 & 2033
Frequently Asked Questions
1. What is the projected Compound Annual Growth Rate (CAGR) of the Liquid Hydrogen Industry?
The projected CAGR is approximately 10.27%.
2. Which companies are prominent players in the Liquid Hydrogen Industry?
Key companies in the market include Linde PLC, Air Products and Chemicals Inc, Universal Industrial Gases Inc *List Not Exhaustive, Messer Group GMBH, Iwatani Corporation, Air Liquide, Nippon Sanso Holdings Corporation, Nippon Sanso Holdings Corporation , Praxair Technology Inc. , ITM Power.
3. What are the main segments of the Liquid Hydrogen Industry?
The market segments include Distribution, End-user Industry.
4. Can you provide details about the market size?
The market size is estimated to be USD 38400 Million as of 2022.
5. What are some drivers contributing to market growth?
Growing Demand for Liquid Hydrogen for Space Exploration; Increasing Adoption of Hydrogen Fuel Cell in Commercial Vehicle.
6. What are the notable trends driving market growth?
Aerospace Industry to Dominate the Market.
7. Are there any restraints impacting market growth?
High Cost Associated with Handling and Storage; Other Restraints.
8. Can you provide examples of recent developments in the market?
Mar 2023: Iwatani Corporation and ENEOS Corporation were working to deliver a "Liquefied Hydrogen Supply Chain Commercialization Demonstration Project. The project aims to develop marine transportation technologies of liquefied clean hydrogen, which will help to achieve a hydrogen supply cost of 30 JPY/Nm3 by 2030.
9. What pricing options are available for accessing the report?
Pricing options include single-user, multi-user, and enterprise licenses priced at USD 4750, USD 5250, and USD 8750 respectively.
10. Is the market size provided in terms of value or volume?
The market size is provided in terms of value, measured in Million and volume, measured in kilotons.
11. Are there any specific market keywords associated with the report?
Yes, the market keyword associated with the report is "Liquid Hydrogen Industry," which aids in identifying and referencing the specific market segment covered.
12. How do I determine which pricing option suits my needs best?
The pricing options vary based on user requirements and access needs. Individual users may opt for single-user licenses, while businesses requiring broader access may choose multi-user or enterprise licenses for cost-effective access to the report.
13. Are there any additional resources or data provided in the Liquid Hydrogen Industry report?
While the report offers comprehensive insights, it's advisable to review the specific contents or supplementary materials provided to ascertain if additional resources or data are available.
14. How can I stay updated on further developments or reports in the Liquid Hydrogen Industry?
To stay informed about further developments, trends, and reports in the Liquid Hydrogen Industry, consider subscribing to industry newsletters, following relevant companies and organizations, or regularly checking reputable industry news sources and publications.
Methodology
Step 1 - Identification of Relevant Samples Size from Population Database


Step 2 - Approaches for Defining Global Market Size (Value, Volume* & Price*)

Note*: In applicable scenarios
Step 3 - Data Sources
Primary Research
- Web Analytics
- Survey Reports
- Research Institute
- Latest Research Reports
- Opinion Leaders
Secondary Research
- Annual Reports
- White Paper
- Latest Press Release
- Industry Association
- Paid Database
- Investor Presentations

Step 4 - Data Triangulation
Involves using different sources of information in order to increase the validity of a study
These sources are likely to be stakeholders in a program - participants, other researchers, program staff, other community members, and so on.
Then we put all data in single framework & apply various statistical tools to find out the dynamic on the market.
During the analysis stage, feedback from the stakeholder groups would be compared to determine areas of agreement as well as areas of divergence